Gold price breakout from Key resistnace Gold price breakout from resistance key area (3360-65) with good volume , as per price action, price can now make another move higher and we can expect continuation of bullish wave towards ATH (3500) , at ATH we have to wait for price action , we can expect breakout or double top like structure there , on breakout we can add to current buy if price move in higher side with current moentum.
Metals

Technical Analysis on XAU/USD (Gold vs USD) – Bullish Reversal 📊 Chart Overview:
This chart of XAU/USD (Gold) on a lower timeframe shows a potential bullish reversal setup. The price action has formed a series of lower highs and lower lows, but now a bullish momentum is building up, suggesting a possible breakout to the upside.
🔍 Key Observations:
🟠 Swing Points Identified:
The orange circles mark significant swing highs and lows, clearly outlining a recent downtrend.
The latest swing low (bottom-right) shows a strong rejection with a bullish engulfing candle forming, indicating buyer interest.
📦 Demand Zone (Support Area):
The grey rectangle near the lower region marks a demand zone where buyers have stepped in before.
Price has reacted strongly from this zone again, validating it as a key support level.
📉 Resistance Turned Potential Breakout Zone:
The red line (~3,291.416) represents a resistance level that was previously support.
Price has broken above it and now appears to be retesting it, indicating a possible retest-confirmation for a bullish continuation.
🎯 Target & Risk Management:
✅ Entry: Confirmed breakout and retest around 3,291.
📈 Target: 3,364.819 (green zone above), based on previous resistance.
❌ Stop Loss: Below 3,267.772, the recent swing low.
The setup offers a favorable risk-to-reward ratio.
🧭 Projection Path:
The white arrowed path illustrates a likely pullback before continuation upward, suggesting a bullish structure if confirmed.
✅ Conclusion:
Gold is showing signs of a bullish reversal from a well-defined demand zone, with a potential rally toward the 3,365 area. A successful retest of the broken resistance as new support would strengthen the bullish bias.
📌 Watch closely for confirmation candles on the retest before entering.

XAUUSD PLAN END-OF-MONTH CASHOUT OR TREND REVERSAL? XAUUSD PLAN – MAY 30 | GOLD DROPS SHARPLY IN ASIAN SESSION | END-OF-MONTH CASHOUT OR TREND REVERSAL?
Gold surprised the market this morning with a sharp drop of nearly $30/oz, despite closing yesterday with a strong bullish daily candle. Profit-taking pressure near month-end and uncertainty surrounding US–China trade negotiations have returned gold to a bearish technical structure in the short term.
🌍 MACRO OVERVIEW:
US–China trade talks show no clear progress, with both sides signaling a cautious and non-committal stance.
Hedge funds and large players may be exiting ahead of monthly/weekly candle closes, causing increased volatility.
Meanwhile, investors are waiting for key US PCE inflation data and more Fed speeches, keeping risk sentiment fragile.
➡️ The market remains technically weak and highly reactive. Price is vulnerable to quick liquidity sweeps and false breakouts — best to stay reactive and trade confirmed zones.
📈 TECHNICAL ANALYSIS (H1 – EMA 13/34/89/200):
Gold has broken below EMA89 and is now trading beneath all major EMAs, indicating a strong short-term downtrend.
The resistance zone at 3,322–3,324 aligns with the EMA200 and a descending trendline, making it a prime area for short entries on rejection.
Key support sits at 3,266–3,264. A break below could send price to test deeper levels at 3,235 or even 3,210, following the broader descending channel.
The 3,274–3,276 zone (EMA13 crossing below EMA34) may offer minor reactions for scalpers in the London session.
🔍 TRADE SETUPS FOR TODAY:
🔵 BUY ZONE: 3,266 – 3,264
Stop Loss: 3,260
Take Profits:
3,270 – 3,274 – 3,278 – 3,282 – 3,286 – 3,290 – 3,300
🔻 SELL ZONE: 3,322 – 3,324
Stop Loss: 3,328
Take Profits:
3,318 – 3,314 – 3,310 – 3,306 – 3,300 – 3,295 – 3,290 – 3,280
🎯 INTRADAY SCALPING IDEAS:
BUY SCALP: 3,274 – 3,276 | SL: 3,270 | TP: 1R (50 pips max)
SELL SCALP: 3,302 – 3,304 and 3,310 zone | SL: 50–60 pips | Flexible TP
📌 SUMMARY:
The current momentum is bearish. Focus on short setups unless price clearly reclaims key EMAs. Scalping opportunities exist around reaction zones. With month-end volatility at play, avoid FOMO and stick to strict SL discipline.
💬 Found this plan helpful? LIKE – COMMENT – FOLLOW for daily GOLD strategies from the MMF Team, crafted for serious traders in India and beyond!

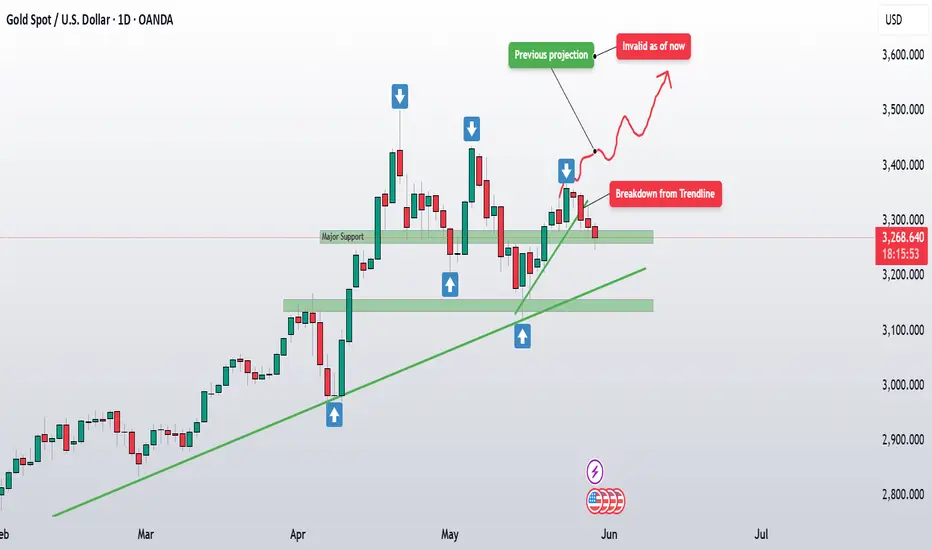
Gold stuck inside range : No clear direction as of now Yesterday, we have seen a strong bounce from the major support zone around 3260–3280 (marked as major support on chart), reclaiming the lost ground after the initial breakdown from the trendline (green line on chart). On daily time frame price seems to be stuck in a tight consolidation range and reflects a choppy environment where neither bulls nor bears have taken decisive control.
It's worth noting that we're right at the dynamic resistance zone ( the red trendline),which continues to cap any upside attempts. On the flip side, the major support area seems to be doing a decent job of holding the floor, at least for now.
With monthly and weekly closing candles coming up today, I’m still in "wait and watch" approach, just like yesterday. The price action around this consolidation zone isn’t giving any clear, high conviction directional clues.

GOLD RETESTING KEY ZONES AHEAD OF INFLATION DATA XAUUSD PLAN – MAY 29 | GOLD RETESTING KEY ZONES AHEAD OF INFLATION DATA | HOLDING OR BREAKING?
After yesterday’s sharp decline, GOLD is showing signs of stabilization around the 3,270 region. This appears to be a consolidation phase before the market reacts to key macro events — particularly the upcoming Core PCE inflation report and a string of Fed speeches this week.
🌍 MACRO LANDSCAPE:
US 10-year yields are holding steady near 4.5%, continuing to pressure gold in the short term.
Fed officials remain cautious about rate cuts, pushing back against dovish expectations.
However, concerns over structural fiscal pressure (including Fed losses and budget cuts) support the long-term bullish case for gold.
➡️ In the short term, the market remains range-bound, and tactical entries near key zones offer the best opportunities.
📈 TECHNICAL OUTLOOK (H1):
Gold is consolidating below a major resistance zone at 3,308–3,310, which aligns with the descending trendline and 200 EMA.
Fibonacci retracement zones (0.5–0.618) also highlight strong resistance around 3,297–3,309.
On the downside, support at 3,263 is key; a break below may expose the broader demand zone near 3,246.
🔍 TRADE SETUPS – MAY 29:
🔵 BUY ZONE: 3,247 – 3,245
Stop Loss: 3,241
Take Profit Targets:
3,251 – 3,255 – 3,260 – 3,264 – 3,270 – 3,275 – 3,280
🔵 BUY SCALP: 3,263 – 3,261
Stop Loss: 3,257
Take Profit Targets:
3,266 – 3,270 – 3,275 – 3,280 – 3,290 – 3,300
🔻 SELL SCALP: 3,294 – 3,296
Stop Loss: 3,300
Take Profit Targets:
3,290 – 3,286 – 3,282 – 3,278 – 3,274 – 3,270 – 3,260
🔻 SELL ZONE: 3,308 – 3,310
Stop Loss: 3,314
Take Profit Targets:
3,304 – 3,300 – 3,296 – 3,292 – 3,288 – 3,280
📌 STRATEGY TIP:
Price is range-bound ahead of key data. Avoid entering mid-range. Wait for price to reach the edges (BUY/SELL zones) and look for clear rejection or confirmation candles. Stick to strict risk management.

XAUUSD PLAN – MAY 28 |WATCHING FOMC + EU TRADE TENSIONS XAUUSD PLAN – MAY 28 | GOLD REBOUNDS SLIGHTLY BUT REMAINS UNDER PRESSURE | WATCHING FOMC + EU TRADE TENSIONS
Gold staged a mild technical recovery after last week’s heavy sell-off of nearly $100. While the bounce offers short-term opportunities, overall structure remains under bearish pressure unless bulls can reclaim the upper distribution zone.
🌍 MACRO CONTEXT – TRADE POLICY & MONETARY UNCERTAINTY:
Trump has delayed the 50% tariff on EU goods until July, calling recent trade talks “positive.”
In response, US 10-year yields spiked back above 4.55%, signaling market expectations for prolonged high interest rates.
Meanwhile, the Fed has announced a 10% workforce cut due to ongoing operational losses from interest payments — a rare move that underscores deeper fiscal constraints.
➡️ With mixed risk sentiment and no clear policy direction, Gold remains a safe-haven focus — but vulnerable in the short-term if yields and the dollar continue to rise.
📈 TECHNICAL OUTLOOK (H1):
Gold is currently trading below the 3,335–3,346 resistance zone, which has repeatedly rejected bullish attempts.
If price fails to reclaim this zone, we could see renewed bearish momentum toward the lower FVG support.
The Fair Value Gap near 3,248 remains a major zone of interest if sellers regain control.
🔍 TRADE PLAN – UPDATED LEVELS:
🔻 SELL ZONE: 3,344 – 3,346
Stop Loss: 3,350
Take Profit: 3,340 – 3,336 – 3,332 – 3,328 – 3,324 – 3,320
🔻 SELL SCALP: 3,326 – 3,328
Stop Loss: 3,332
Take Profit: 3,322 – 3,318 – 3,314 – 3,310 – 3,305 – 3,300
🔵 BUY SCALP: 3,278 – 3,276
Stop Loss: 3,272
Take Profit: 3,282 – 3,286 – 3,290 – 3,294 – 3,298 – 3,302 – 3,310
🔵 BUY ZONE: 3,246 – 3,244
Stop Loss: 3,240
Take Profit: 3,250 – 3,254 – 3,258 – 3,262 – 3,266 – 3,270 – 3,280
📌 STRATEGY TIP:
Avoid mid-range entries. Let price come to your zones. Prioritize confirmed reactions, especially near structural levels like 3,335 and 3,248.

Gold Major Support in Focus: Will It Hold or Slide Further?Gold is testing a major support zone around 3260–3280 after breaking down from trendline support and following up with another red candle.
This breakdown suggests that the recent bullish momentum has faded, and now we have to wait to see if this support can hold. If it doesn’t, the next downside target looks to be around 3130–3155, with even 3000 as a longer-term possibility if the pressure continues. Right now, I’m staying out of any trades, preferring to wait and see if this support zone can provide a bounce or if we’re heading for deeper levels. The price action isn’t giving any clear reversal signs at current area as of now and wee have to assess this on week closing basis.
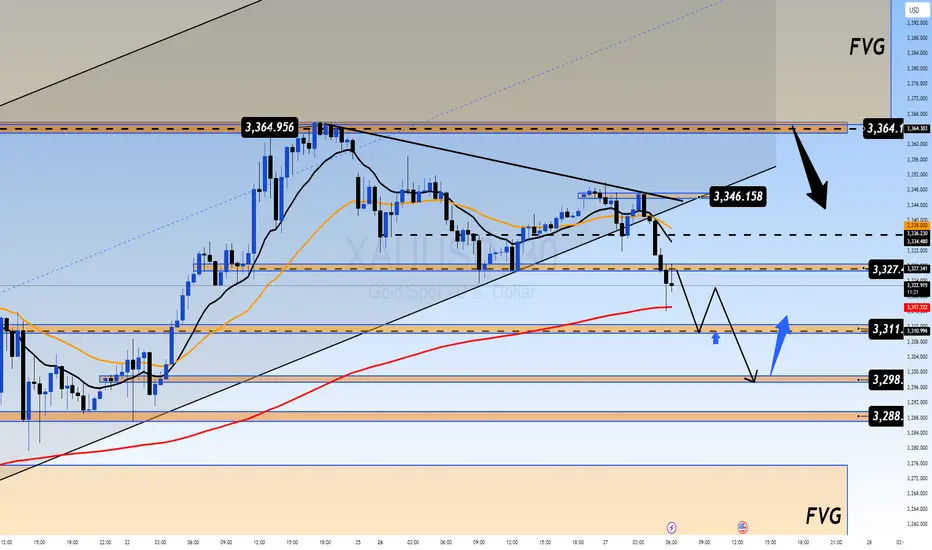
GOLD TRADING INSIDE COMPRESSION ZONE WAITING FOR A CLEAR BREAK XAUUSD PLAN – MAY 27 | GOLD TRADING INSIDE A COMPRESSION ZONE – WAITING FOR A CLEAR BREAKOUT
Gold continues to consolidate below the 3,364 resistance zone after a rejection late last week. The market is currently trading within a compression range, preparing for a breakout – but direction still depends heavily on macro triggers and technical structure.
🌍 MACRO CONTEXT:
U.S. 10-year yields remain above 4.5%, keeping the dollar stable and applying short-term pressure on precious metals.
The Fed’s cost-cutting moves and operational losses are raising deeper concerns about long-term monetary stability.
Risk sentiment is mixed, and institutional money continues to flow cautiously into gold as a long-term value hedge, especially with equities showing signs of exhaustion.
📈 TECHNICAL OUTLOOK (H1):
Price failed to break through the 3,345–3,364 resistance zone, triggering a pullback toward the mid-range.
Key support around 3,311 is now being tested – a decisive level that could determine whether bulls can regain momentum or bears take control.
If price breaks below 3,311, we could see a deeper dip toward the 3,298–3,288 demand zone, which may offer a better re-entry for buyers.
On the upside, a confirmed break above 3,364 could open the door for a move into the Fair Value Gap toward 3,407.
🔹 TRADE SETUPS:
🔵 BUY SCALP
Entry: 3,314 – 3,312
Stop Loss: 3,308
Take Profit Targets:
3,318 – 3,322 – 3,326 – 3,330 – 3,340 – 3,350
🔵 BUY ZONE
Entry: 3,298 – 3,296
Stop Loss: 3,292
Take Profit Targets:
3,302 – 3,306 – 3,310 – 3,314 – 3,320 – 3,330
🔻 SELL SCALP
Entry: 3,346 – 3,348
Stop Loss: 3,350
Take Profit Targets:
3,342 – 3,338 – 3,334 – 3,330 – 3,320 – 3,310
🔻 SELL ZONE
Entry: 3,364 – 3,366
Stop Loss: 3,370
Take Profit Targets:
3,360 – 3,356 – 3,352 – 3,348 – 3,344 – 3,340 – 3,330
📌 Note:
Price is trading in the mid-range of a larger structure. Best opportunities remain near the edges of support/resistance with confirmation. Avoid overtrading in the middle zone. Let the market come to your areas of value.
💬 If you found this plan helpful, Like + Comment + Follow for daily GOLD strategies from the MMF Team.
Gold Analysis Update: Bulls Holding Strong Above 3330Gold has been holding steady above the major pivot level at 3330, with price action continuing to create higher highs and showing strong respect for the ascending trendline support. This tells us that the bulls remain firmly in control. Currently, there’s no major rejection around these levels, and the volume is still supportive of the move higher, with no clear signs of exhaustion yet.
I’m also keeping an eye on the Fibonacci retracement levels visible on the chart: price is above the 0.786 mark at 3369 and could push towards the 1.0 level at 3436 if momentum remains strong.

XAU/USD Technical Analysis – 4H Chart Overview🔍 Current Market Position
Price: $3,358.125
Currently near resistance zone ($3,420–$3,470)
Historical reaction in this zone shows multiple rejections 🛑
📌 Key Levels
🔺 Resistance Point: ~$3,420–$3,470
Rejected here 3 times ➡️ strong supply zone
🔻 Support Level: ~$3,150
Past price bounced here multiple times 🟠
💪 Strong Support: ~$2,950
Major bounce seen in early May 👊
🧭 Pattern Outlook
Repeated resistance test 🔁 ➡️ potential double/triple top
📉 Blue arrow suggests bearish projection towards $3,050–$2,950
If support at $3,150 fails 🔓, expect deeper drop to strong support
🔮 Forecast
🔽 Bearish Bias
High chance of reversal from resistance
Target: $3,050 and possibly $2,950 🎯
⚠️ Watch for
Price Action at Resistance: Rejection = short opportunity 🔧
Break of $3,150 Support: May accelerate bearish move 🧨
📌 Summary:
Market shows clear resistance rejection history. If it plays out again, we may see a strong drop toward lower support zones. Ideal for short setups 📉💼

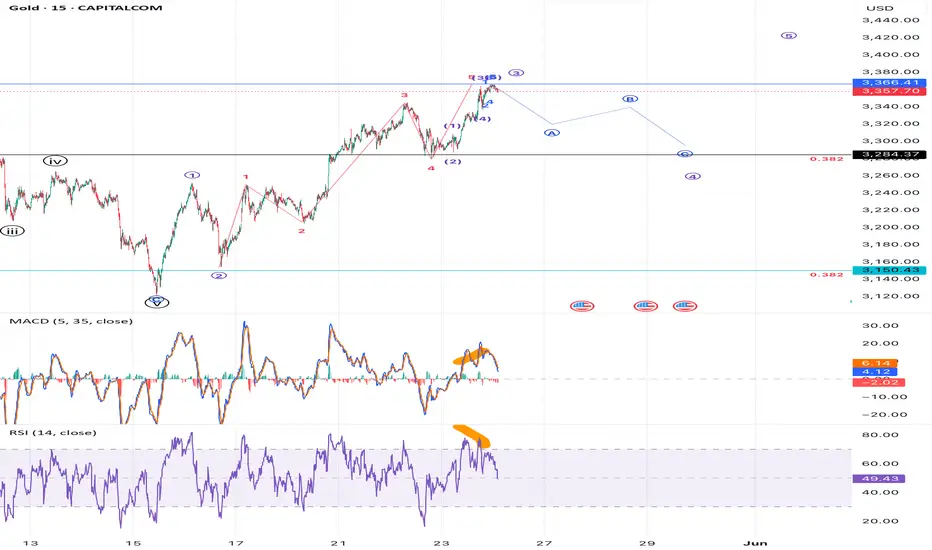
Gold correction as 4th wave Currently we are in impulse wave 12345
As of now gold completed 123 wave as larger degree
Currently we are in 4th wave correction let’s see how 4th wave unfolding
See u at 3284 $
Cmp 3257 $
Article written by dr vikas mavani
GOLD PLAN 23/05–YIELD CURVE FLIPS Will Gold Breakout or Sell Off🔥 GOLD PLAN 23/05 – YIELD CURVE FLIPS | Will Gold Breakout or Sell Off at 3360?
Global markets are heating up again as risk sentiment shifts. A major alert comes from the U.S. bond market:
For the first time since October 2021, the yield curve between the 5-year and 30-year treasuries inverted to +1.00%, signaling strong expectations for inflation and future growth concerns.
🌍 MACRO CATALYSTS DRIVING GOLD:
Iran warns the U.S.: “Leash your mad dog!” – escalating rhetoric as Israel is rumored to be preparing a strike on Iran's nuclear sites. Tehran vows to retaliate and holds the U.S. accountable.
Goldman Sachs says: “Only one way – BUY GOLD!”
Following the failed 20-year bond auction, rising deficits, and fiscal stress, GS urges investors to move into gold and crypto.
The return of risk-off sentiment makes Gold the #1 safe haven asset, attracting global institutional flow.
📈 TECHNICAL OUTLOOK (H1 Chart):
Critical resistance at 3358–3360 is a key decision zone.
A breakout here may trigger a strong move toward previous highs (ATH zone: 3390–3400).
Major support lies around 3276–3274.
A breakdown here may expose gold to deeper pullbacks below the 3200 handle, revisiting the FVG zone.
📌 TRADE PLAN FOR TODAY:
🔵 BUY ZONE:
Entry: 3276 – 3274
SL: 3270
TP: 3280 – 3284 – 3288 – 3292 – 3296 – 3300
🔵 BUY SCALP:
Entry: 3304 – 3302
SL: 3298
TP: 3308 – 3312 – 3316 – 3320 – 3325 – 3330 – 3340
🔻 SELL ZONE:
Entry: 3376 – 3378
SL: 3382
TP: 3372 – 3368 – 3364 – 3360 – 3350
🔻 SELL SCALP:
Entry: 3344 – 3346
SL: 3350
TP: 3340 – 3336 – 3332 – 3328 – 3324 – 3320
⚠️ Caution:
With geopolitical risk and bond market stress rising, volatility is expected to spike. Be patient and trade only on confirmation from key zones.
🎯 Stick to the plan. Don't chase the price. Protect your capital.

Gold What’s Happening on Monthly Price Action:What’s Happening on Monthly Price Action:
Parabolic rally: Gold has gone nearly vertical since mid-2023 a textbook parabolic curve.
Zero rejection wicks: Current and previous candles show strong-bodied closes near the highs, suggesting very little distribution.
RSI is overbought: Hovering well above 70, but still rising, meaning the momentum is intact and buyers are still in full control.
This move still has no exhaustion signal on the monthly.
No long upper wicks
No bearish engulfing
No divergence on RSI yet
We are likely in Phase 2 of the bull run where price accelerates with institutional momentum, not retail euphoria.
We are due for a healthy correction, but calling a top here is premature. A market can stay irrational longer than you can stay solvent.
"Overbought and staying overbought” is a sign of strength, not weakness. Until price shows a rejection the bulls are driving this train. We ride the wave, not fight it

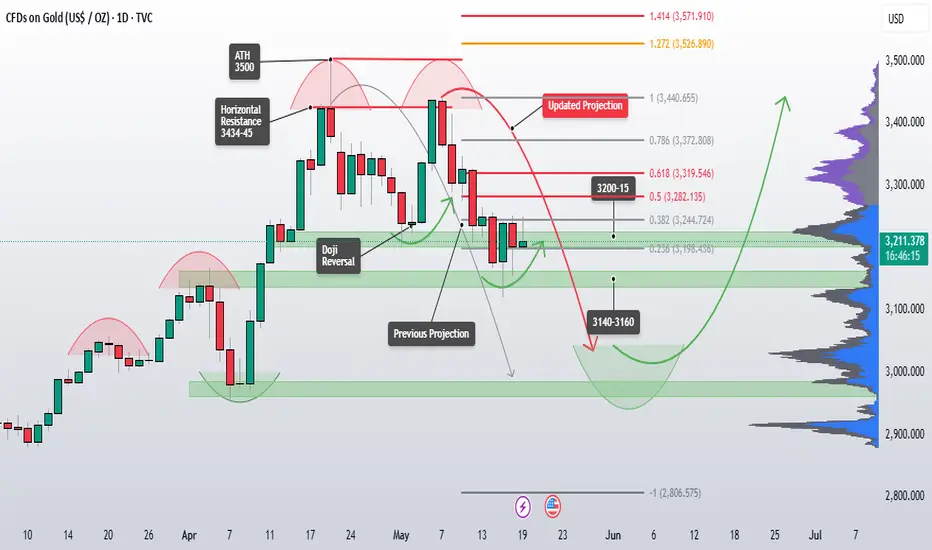
Gold Holding Strong New Highs Loading? After a solid rejection from the 3130–3160 major support zone, gold has shown real strength and bounced back above the 3280–3300 region, which was a key retracement level (0.5–0.618 Fib zone). Initially, I was expecting a deeper correction possibly towards the 3000 area, but price action has flipped the script. Bulls have stepped in strongly.
With the updated projection, we’re now looking at the following bullish path:
Updated Bullish Projection Path
Immediate resistance at 3436-40 (100% Fib extension)
Next targets:
ATH :3500
3520 – 1.272 Fib
3565 – 1.414 Fib
3628 – 1.618 Fib (Major extension target)
Major support to watch 3260-75 area
If price continues to respect the trendline and higher lows, this bullish momentum could stretch further....

The uptrend is being tested at the resistance of 3,305 USDAfter a strong recovery from the bottom around 3,140 USD, the world gold price is touching the important resistance zone at 3,305 USD/ounce in the trading session on May 21. On the 4H chart, the short-term uptrend is reinforced when the price breaks above the EMA 34 and EMA 89, creating a golden cross pattern - a sign that often signals the continuation of the uptrend.
However, the 3,305–3,325 area is currently acting as a short-term resistance - where many reversals have been recorded in the past. The price is showing signs of slowing down when approaching this area, with small candles and narrow bodies, indicating that buying power is temporarily slowing down.
If gold breaks and closes clearly above 3,325, the price will likely continue to move towards 3,375 and further to 3,400 USD. On the contrary, if the price fails to break above the current resistance zone and reverses, the support zone to watch is the confluence between EMA34 and EMA89 around 3,250–3,260.
With market sentiment still dominated by geopolitical factors and US credit risks, gold continues to maintain its safe-haven role. However, investors should monitor the price reaction at the 3,305 area to confirm the next momentum – whether it is a breakout or a technical correction.

FED HAWKISHNESS VS TECHNICAL FAIR VALUE GAPS – BIG MOVE COMING?GOLD PLAN 21/05 – FOMC HAWKISHNESS VS TECHNICAL FAIR VALUE GAPS – BIG MOVE COMING?
The recent surge in gold has paused just as traders digest the latest Federal Reserve signals. Despite rising geopolitical risks and weakening U.S. economic data, Fed officials continue to project a “higher-for-longer” rate stance, keeping the dollar afloat and adding pressure on gold’s rally.
📉 However, the technical structure tells another side of the story.
⚙️ TECHNICAL OUTLOOK: Bearish Trap or Hidden Bullish Opportunity?
On the 1H timeframe, XAU/USD is showing signs of consolidation after tapping into a major Fair Value Gap (FVG) around the 3328–3356 area. We now observe two key FVG zones above and below current price, highlighting high volatility and potential liquidity grabs.
🔍 A short-term bullish scenario is forming if gold retraces towards 3250–3252 support, where trendline confluence and dynamic support suggest strong demand.
Conversely, any strong rejection from 3354–3356 SELL ZONE could activate a bearish play back towards the lower structure levels.
💹 TRADE SETUPS FOR TODAY:
🔵 BUY ZONE:
Entry: 3252–3250
Stop Loss: 3246
Take Profit Targets:
3256 – 3260 – 3264 – 3268 – 3272 – 3280 – 3300 – ???
🔵 BUY SCALP:
Entry: 3277–3275
Stop Loss: 3272
Take Profit Targets:
3280 – 3284 – 3288 – 3292 – 3296 – 3300
🔻 SELL ZONE:
Entry: 3354–3356
Stop Loss: 3360
Take Profit Targets:
3350 – 3346 – 3342 – 3338 – 3334 – 3330 – 3320
🔻 SELL SCALP:
Entry: 3328–3330
Stop Loss: 3334
Take Profit Targets:
3324 – 3320 – 3316 – 3310 – 3305 – 3300
🌍 MACRO INSIGHT:
Fed’s hawkish tone is weighing on precious metals, but gold remains attractive under geopolitical uncertainty and de-dollarization trends.
China and other central banks continue their accumulation, suggesting long-term bullish pressure is intact.
Watch for U.S. data this week – especially PMI and jobless claims – which could provide short-term catalysts.
📌 Stay cautious and disciplined. Stick to your zones and manage risk tightly – volatility is increasing.
👉 If you found this useful, don’t forget to like, comment and follow for daily gold insights!

No trades for now… letting gold show its next moveYesterday, gold closed above 3282 level, which we’ve been tracking closely as the 0.50 Fibonacci level from the 3440–3120 decline. This was a key technical level and with that break, I’ve closed all my short positions initiated from the 3385 area(with a good profit overall), as shared earlier.
With that exit, I’m currently flat and not holding any active positions.
From an intraday perspective, price is now inching toward the next resistance at 3319, which corresponds to the 0.618 Fib retracement a typical zone where reactions or pullbacks possible.
The trend has shifted from a clean corrective phase into a potential BIG RANGE CONSOLIDATION structure(for range we have to wait for weekly close confirmations)
I’ll wait for more clarity in price action near 3319–3345, and reassess if fresh selling opportunities or continuation setups emerge.I prefer to stay on the sidelines and observe how price behaves around the next resistance cluster before jumping into the next move.

Key Rejection Zone Approaching – Bearish Setup in PlayChart Summary:
Asset: Unspecified (USD-based)
Timeframe: Short-term (likely 1H or 4H)
Indicators:
EMA 50 (red): 3,245.772
EMA 200 (blue): 3,223.635
Key Zones:
Resistance Zone (Red box): ~3,310–3,360
Target/Support Zone (Red box): ~3,110–3,160
Mid Support Zone (Blue box): ~3,200–3,230
Trendline: Downward sloping resistance connecting major highs
---
Technical Breakdown:
Trend Analysis:
Primary Trend: Bearish ⬇️
Confirmed by the downtrend line (black) which has been respected multiple times (3 clear touches).
Current Price: 3,290.090
Price is approaching a key confluence zone: resistance area + trendline.
This area has previously acted as strong supply.
Moving Averages:
EMA 50 > EMA 200: Minor bullish signal (Golden Cross), but price action is still below major resistance.
However, this cross may be a false signal if price gets rejected here.
---
Price Action:
Current Move: Strong bullish push toward resistance after rebounding from the target zone ✅
The resistance zone and trendline are likely to act as a rejection point unless broken decisively.
---
Bearish Scenario (High Probability):
If price fails to break above the resistance zone:
Expect a rejection and move back toward:
Blue mid-support: ~3,220
Target zone: ~3,130 (major demand area)
Confirmation: Bearish candlestick pattern or strong wick rejections near resistance.
🔵 Entry Idea: Short near 3,310–3,350
🎯 Target: 3,130 zone
✋ Stop-Loss: Above 3,360 (above trendline + resistance)
---
Bullish Scenario (Less Likely):
If price breaks above the resistance zone with strong volume:
Could signal trend reversal
Next target levels: ~3,400+
---
Conclusion:
Bias: Bearish near resistance zone
Key Level to Watch: 3,310–3,360 (critical for direction)
Trading Approach: Wait for confirmation, don't preemptively short without rejection signals.

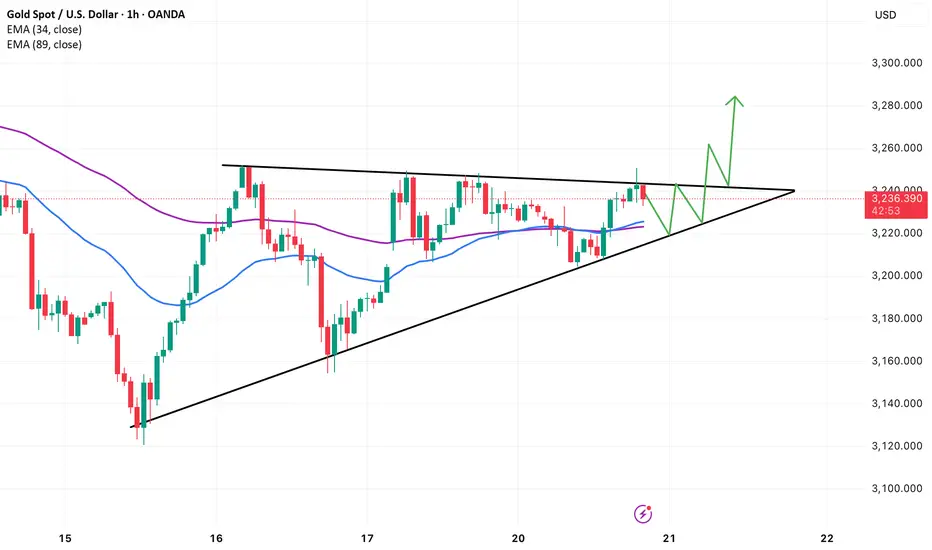
Gold breaks out of triangle patternThe world gold price has increased to 3,222 USD/ounce, continuing the strong recovery thanks to supportive factors from safe-haven sentiment. Moody's downgrade of the US long-term credit rating has fueled concerns about financial risks, while trade tensions due to the US Treasury Secretary's statement have further strengthened gold's position as a safe haven.
On the 1H chart, the price has just broken out of the ascending symmetrical triangle pattern - a technical structure that often signals the continuation of an uptrend. The breakout zone around 3,235 is currently acting as support. As long as the price holds above this zone, the possibility of gold continuing to move towards the target of 3,270–3,280 is quite high. In particular, the EMA34 and EMA89 lines are converging and preparing to create a short-term bullish crossover.
However, investors should note that if the price reverses and breaks through the bottom of the triangle (below 3,220), the bullish pattern will be negated, and the possibility of a bearish reversal will return. With the geopolitical and economic context still having many uncertainties, gold is holding the upper hand but still needs solid confirmation from price action after the breakout.
GOLD MARKET UPDATE - BE READY FOR BIG MOVES!🔥 GOLD MARKET UPDATE – FED'S HAWKISH STANCE SHAKES INVESTORS | BE READY FOR BIG MOVES!
Gold experienced a sharp drop following the latest hawkish comments from the Federal Reserve, as they reaffirmed that current monetary conditions remain stable and tight. This has caused confusion and panic among many investors, leading to a wave of sell-offs during the U.S. and early Asia sessions.
📉 On the higher timeframes, Gold appears to be forming a bearish flag pattern – a classic consolidation structure before a potential continuation move. Despite the strong bullish momentum seen during the Asian and European sessions yesterday, the key resistance near 325x held firm, preventing any major breakout.
For now, Gold seems to be trapped in a new sideways range, and unless price decisively breaks above 325x, we may continue to see choppy price action within this zone.
⚠️ However, if the current selling momentum persists and the price breaks down below the lower trendline support, the bearish flag setup could play out, with up to 80% probability, signaling a potential strong continuation of the downtrend.
Traders should stay extremely alert – a major price movement could happen at any moment!
🔑 Key Support Levels:
3205
3294
3280
3262
🔑 Key Resistance Levels:
3244
3262
3278
3286
💹 Scalping Setup – BUY:
Entry: 3294–3292
Stop Loss: 3288
Take Profit Targets:
3298 – 3302 – 3306 – 3310 – 3315 – 3320 – 3330
🟢 BUY ZONE:
Entry: 3272–3270
Stop Loss: 3266
Take Profit Targets:
3276 – 3280 – 3284 – 3288 – 3292 – 3296 – 3330
🔻 Scalping Setup – SELL:
Entry: 3242–3244
Stop Loss: 3248
Take Profit Targets:
3238 – 3234 – 3230 – 3226 – 3220 – 3210
🔻 SELL Zone:
Entry: 3276–3278
Stop Loss: 3282
Take Profit Targets:
3272 – 3268 – 3264 – 3260 – 3250 – 3240
📌 Remember to always follow your TP/SL strategy to protect your capital!

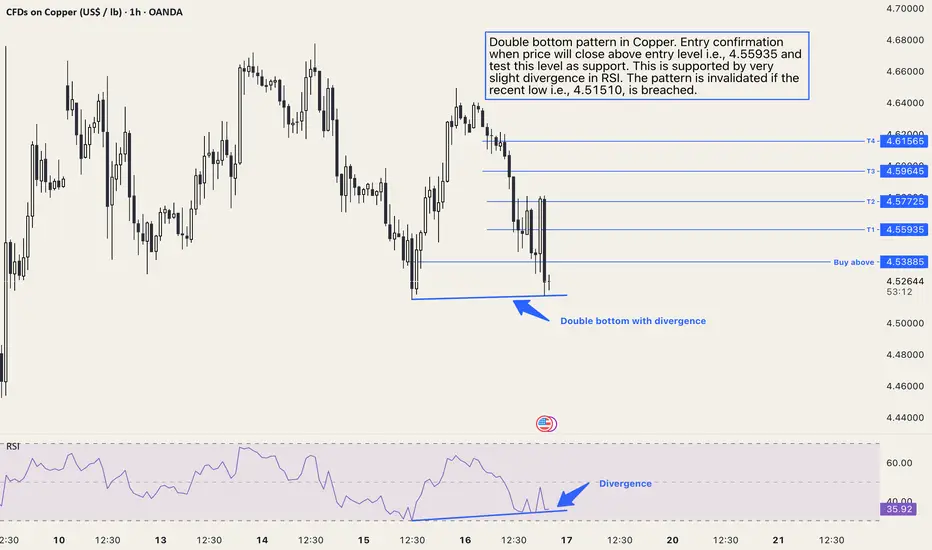
Copper XCUUSD: Double Bottom PatternDouble bottom pattern in Copper. Entry confirmation when price will close above entry level, i.e., 4.55935 and test this level as support. This is supported by a very slight divergence in RSI. The pattern is invalidated if the recent low, i.e., 4.51510, is breached.
The targets are shared on the chart as T1, T2, T3 and T4 respectively.
Beware of short-term bull trapsOn the H4 chart, gold is testing an important resistance zone around EMA89 (purple) after a rebound from the bottom of 3,120. However, both EMA34 and EMA89 are sloping down, indicating that the short-term trend is still bearish. The current rebound is not strong enough to confirm a reversal.
The most recent candle also has a long upper shadow, indicating that selling pressure is waiting above. If the price is rejected at the 3,250–3,260 zone and turns around to break down to 3,220, there is a high possibility that gold will retest the old bottom around 3,120.
The strategy at this time is to stay out or wait to sell lightly if a clear reversal signal appears near the resistance zone. Avoid FOMO because the rebound has not been confirmed by volume or trend structure.

Gold Holding Above 3200… But Is the Rebound Real?Gold followed through on our previous expectation, bouncing from the 3140–3160 support zone after briefly tagging a low near 3120. From there, bulls regained some control and managed to reclaim the 3200 level, which we’ve been watching closely. Although last week’s close was above 3200, I still consider this move a corrective bounce, not a confirmed reversal.
The key level I’m watching now is 3282, which aligns with the 50% Fibonacci retracement of the recent decline from 3440 to 3120. Until price decisively closes above this zone, I’ll continue to treat this as a pullback within a broader correection/downtrend and hold onto a portion of my short positions.
If bulls manage to break and hold above 3282, we could start seeing signs of a short-term trend shift toward higher resistance zones like 3350 or beyond. However, as long as price stays below 3282, the risk remains for another move back below 3200 and if that happens, a revisit of the 3140–3120 support zone is very much on the table. and if that support break, our previous bearish targets come back into focus.
So for now, I’m still leaning toward downside continuation unless the market proves otherwise by reclaiming key resistance with strength.