DeGRAM | GOLD Held Support Level📊 Technical Analysis
Gold’s slide paused at $3 315; holding here keeps $3 500 – 3 520 in play.
💡 Fundamental Analysis
• PBoC has been buying for 5 months in a row.
• WGC expects strong demand from central banks in 2025.
• Trade wars, tensions in the Middle East and South Asia are causing risks that are increasing demand for gold.
• IMF warns new tariffs could slow growth, boosting safe-haven bids.
• Western ETFs had bought ≈240 t by mid-April.
• DXY is at 3-year lows and yields are down.
✨ Summary
Strong central-bank buying, renewed ETF inflows, softer USD yields and rising geopolitical risk align with chart support, favouring a rebound toward $3 500 – 3 520 while $3 315 holds.
-------------------
Share your opinion in the comments and support the idea with a like. Thanks for your support!
Metals

Gold falls below $3,300International gold prices are currently trading around $3,290/ounce, down $40 from last week and far from the record high of $3,500. The bearish structure still prevails as gold is below the EMA34 and EMA89, while failing many times to regain the $3,300 mark.
Strong profit-taking pressure, a recovering USD and rising bond yields are dragging gold prices down, despite the previous optimistic expectations from the Kitco survey. If gold continues to weaken below $3,300, it could head towards $3,250, deeper into the $3,200–$3,220 range. Conversely, only when it surpasses $3,320 will the downtrend be challenged.
Short-term strategy: Prioritize selling when gold recovers weakly.

Trading Plan – April 28, 2025: GOLD (XAU/USD) Strategy🌟 Daily Trading Plan – April 28, 2025: GOLD (XAU/USD) Strategy
📈 Technical Overview:
After the strong sell-off last week, gold is now consolidating around the key support zone 3260–3270.
Price action is tightening, forming a symmetrical triangle pattern on the M15 timeframe.
The MA 13 – 34 – 200 alignment suggests a short-term bearish trend, but selling momentum is weakening.
The chart indicates a potential retest towards resistance levels before deciding the next major move.
🎯 Key Price Zones to Watch:
Immediate Resistance: 3299 – 3313
Major Support: 3260 – 3268 – 3239
Potential Rebound Target: A retest towards 3299 – 3313 before a possible sell-off resumes.
📌 Trading Scenarios:
Primary Strategy: Look for short-term BUY setups near the 3260–3268 support zone, aiming for a corrective move towards resistance, then watch for SELL signals.
🎯 Detailed Plan:
🔵 BUY Zone: 3260 – 3258
Stop Loss: 3254
Take Profit: 3264 – 3268 – 3272 – 3276 – 3280 – 3290
🔴 SELL Zone: 3299 – 3301
Stop Loss: 3306
Take Profit: 3294 – 3290 – 3286 – 3282 – 3275
📢 Important Notes:
Today's price range could move between 60–80 pips, with no major economic events scheduled.
However, the market remains highly sensitive to geopolitical news, especially concerning India–Pakistan tensions and U.S.–China relations.
Always stick to your TP/SL plans and avoid FOMO during rapid price movements.
✅ Summary:
This is a high-sensitivity period for gold. Prioritize trading high-probability setups: BUY at support – SELL at resistance, and only scale in positions after clear confirmation!

Gold Under Pressure: Waiting for the Next Big MoveEarlier today, gold wrapped up the week around $3,320/ounce, falling about $53 from the previous night's peak at $3,373. This drop feels like a natural reaction as market flows begin to shift direction.
The main driver behind the pullback was a stronger U.S. dollar, fueled by easing concerns over the global economy. At the same time, rising U.S. bond yields made non-yielding assets like gold less attractive to investors.
Additionally, progress in U.S. trade talks with other nations further reduced the immediate demand for safe-haven assets like gold.
That said, I believe the market is now in a "holding pattern," awaiting key U.S. economic data — especially the upcoming inflation report from the Fed. If the numbers confirm economic stability, gold may face additional short-term selling pressure.
Bottom line: This is a time to trade cautiously. Focus on how gold reacts around major support zones and adjust strategies based on fresh economic data.
Wishing everyone safe and successful trading!

Gold Retreats as Trump’s Trade Talk Flip Sparks CautionGold Retreats as Trump’s Trade Talk Flip Sparks Caution – Friday Volatility Expected 💥📉
🟡 Market Recap & Sentiment
Gold prices jumped over 1% this week, reaching around $3,500/oz, as investors sought safe-haven assets amid a weakening USD and global uncertainty. However, analysts believe this Price surge is driven by greed and needs a healthy correction.
“Gold might consolidate in the near term, but we’re still in a bull market. Dips will be bought,” said analyst Wong.
Meanwhile, the US Dollar and equities are losing their appeal as investors digest contradictory signals from President Trump. He confirmed that US-China trade negotiations are ongoing, while China denied any talks – sending shockwaves across markets and triggering a sharp pullback in gold during the Asian session.
This political flip-flop is adding confusion, and traders are advised to stay cautious before jumping into any positions.
📉 Fundamental Triggers Today
Core Retail Sales (US) – releasing later today during the US session.
It’s also Friday – which means potential for weekly candle closure volatility and liquidity grabs.
Coupled with the ongoing tariff headlines and geopolitical drama, today could be extremely unpredictable.
📍 Key Levels to Watch
Resistance: 3366 – 3384 – 3406 – 3428 – 3445
Support: 3308 – 3288 – 3270
🔹 Trade Setup Suggestion
🔸 BUY ZONE: 3288 – 3286
SL: 3282
TP: 3292 – 3296 – 3300 – 3304 – 3310
🔸 BUY ZONE: 3270 – 3268
SL: 3264
TP: 3274 – 3278 – 3282 – 3286 – 3290
🔻 SELL ZONE: 3384 – 3386
SL: 3390
TP: 3380 – 3376 – 3372 – 3368 – 3364 – 3360 – ???
🔻 SELL ZONE: 3406 – 3408
SL: 3412
TP: 3400 – 3396 – 3392 – 3388 – 3384 – 3380 – 3370 – 3360
⚠️ Risk Management Reminder
Be cautious today – it’s a Friday with major data and geopolitical uncertainty.
✅ Always respect TP/SL levels.
✅ Let the market show confirmation before entering positions.
Sit tight and let the market come to your zone – don’t rush in with FOMO during uncertain sentiment.

XAUUSDOANDA:XAUUSD
As you can see that gold has created head and shoulder if the the drawn support was broken down side then we can go for sell side. plan your trade accordingly

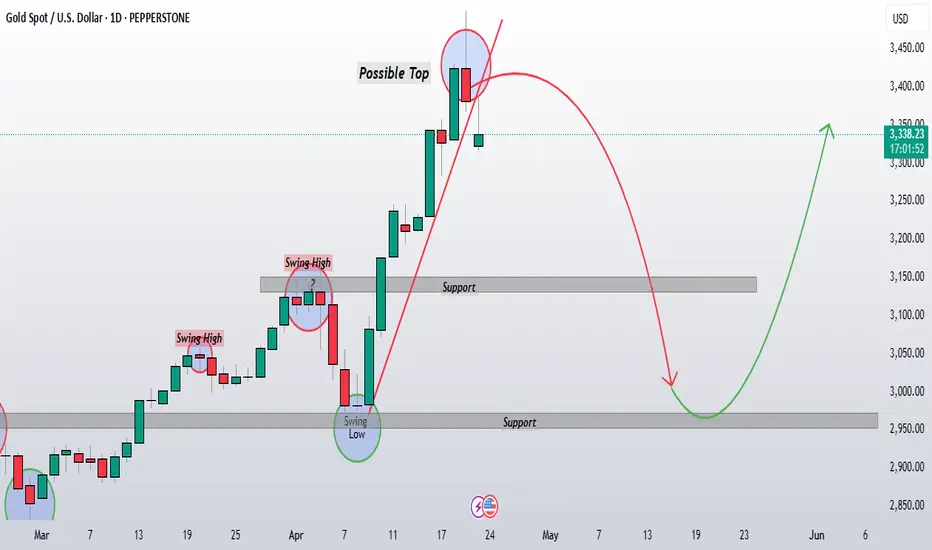
Gold Weekly Close Critical for Confirming correction PatternYesterday's slight price recovery(Green Closing) appears to be a normal bounce after the sharp two-day decline. This aligns with typical market behavior where prices don't move in straight lines, even during strong drop or rise.
The current price action (3349) is still trading well below to golden fib zone(3380-3408) , which suggests that price is still under sellers control as of now.
The key will be whether price respects the first support level around 3150-65 or breaks through it, potentially accelerating toward my 3000 target.
As today is the weekly close, this will be particularly important for setting the tone for next week trading. If gold closes significantly below recent highs, it would strengthen the bearish /correction case for the short-term outlook that I have projected.
Gold Rebounds Sharply After Steep DropAfter plunging $91 to close at $3,288 in yesterday’s session, gold staged an impressive comeback this morning, surging over 700 pips to reach the $3,360 area.
This sharp price swing was largely driven by a mix of news catalysts. U.S. President Donald Trump stated he has no plans to remove Fed Chair Jerome Powell, but called for more aggressive rate cuts—boosting the U.S. dollar and putting short-term pressure on gold.
At the same time, the IMF released its latest global outlook, projecting elevated inflation through 2026. This raised expectations for prolonged monetary tightening from central banks, capping gold’s upside potential. Additionally, a wave of profit-taking after gold's recent rally added to the downward correction.

Gold Surge: 80 Price Bounce from Key Support Gold Surge: 80 Price Bounce from Key Support – What’s Next for the Market? 💰📈
Market Overview:
Gold has surged by 80 pips today, bouncing from the support level at the end of the U.S. session yesterday after liquidity was swept at the 3260 zone. Investors are now looking to buy the dip after the 250+ pip drop in gold over the past few days. Currently, after the strong 80 pip rally, gold is consolidating at the 0.382 Fibonacci retracement zone, with selling pressure mounting.
Key Price Levels to Watch:
Resistance: 3343, 3358, 3376, 3410, 3446
Support: 3210, 3286, 3275, 3230
Market Sentiment:
There’s a strong sell reaction at current levels, which suggests that the price could continue to push lower in both the Asian and European sessions to fill liquidity in the Fair Value Gap (FVG). After the 80 pip rally and 40 pip reaction, the market seems to be consolidating between 3328 and 3320. We expect a price movement range of 80-100 pips today, so caution is advised, especially around key levels at 3376-3378, where a potential sell can be placed.
Next Potential Movements:
If gold fails to break through the 3376-3378 resistance zone, we could see a continuation of the downward move. If the 3376-3378 zone holds strong, this could be a good opportunity to sell.
Should the price break through this zone, we’ll observe the next key resistance around 3410. A break above 3410 could signal a reversal to the upside, turning the trend into a BUY instead of SELL.
Today's Strategy:
For today, the focus will be more on SELL opportunities as gold pushes back to fill the FVG liquidity around 3288. Once we see how the price reacts at these levels, we can start planning for BUY entries.
Watch out for Unemployment Claims data from the U.S. later in the session, as this could trigger volatility. Be cautious when trading around news events, especially in a sensitive market.
Trade Setup:
BUY ZONE: 3230 - 3228
SL: 3224
TP: 3234 - 3238 - 3242 - 3246 - 3250 - 3254 - 3260
SELL ZONE: 3376 - 3378
SL: 3382
TP: 3372 - 3368 - 3364 - 3360 - 3355 - 3350
SELL ZONE: 3408 - 3410
SL: 3414
TP: 3402 - 3398 - 3394 - 3390 - 3386 - 3382 - 3375 - 3370
Risk Management:
It’s important to manage your risk appropriately given the current market conditions. Ensure you’re following your TP/SL levels strictly to protect your capital from market volatility.

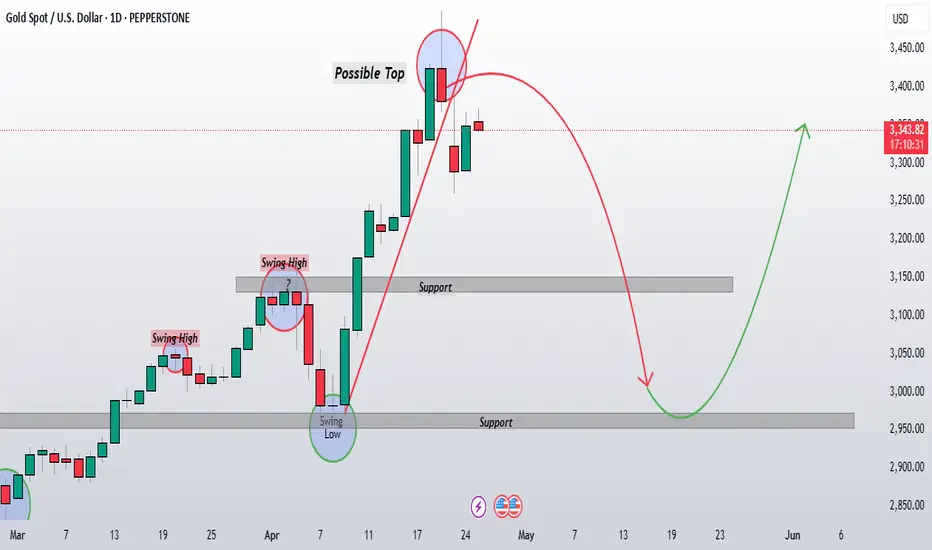
Gold Rejection at 3500 :Signals Potential Top FormationGold finally showing strong signs of a potential top formation after an extended bullish run. After weeks of anticipation, yesterday's price action finally delivered a significant rejection candle at the psychologically important 3500 level, which could be the reversal signal we've been waiting for .
It's worth noting that in such strongly bullish rally, tops often take longer to form than expected (Which we already seen last week and this week), with both time and price extensions being normal market behavior. However, the rejection at 3500 combined with the current technical setup suggests we may finally be seeing the reversal pattern developing.
From a trading perspective, I'm now waiting for a confirmation candle(Follow up from last day candle) to validate that the top is in place. If we see follow-through selling pressure today or tomorrow, this could present an excellent swing short opportunity. The target remains the psychological support level at 3000.
Gold Faces 200 Pips Drop – Will It Recover or Continue Falling?Gold Faces 200 Pips Drop – Will It Recover or Continue Falling? 🔥📉
Market Overview:
Gold (XAU/USD) saw a sharp drop of nearly 200 pips yesterday, falling from the historic high of around $3500 to $3318. This marks the strongest correction in the recent bullish trend. The market is currently volatile, and the question is whether gold will find support at lower levels or continue its downward movement.
What’s Causing the Drop?:
Fed Rate News: The latest news from the Federal Reserve triggered strong profit-taking, which resulted in the sharp decline.
USD Technical Rebound: The USD has rebounded after significant losses, putting pressure on gold.
Market Sentiment Shift: Investor sentiment changed rapidly, leading to mass sell-offs.
Key Levels to Watch:
Support: 3300-3320 (Critical level for a potential bounce)
Resistance: 3378-3380 (Key resistance area)
Next Steps for Gold:
Support at 3300-3320: If gold holds above this range, a strong recovery could follow.
Break below 3300: A breakdown below 3300 may lead to further declines, potentially towards the next support at 3250.
Trading Strategy:
SELL ZONE:
3378 - 3380
SL: 3384
TP: 3374 - 3370 - 3366 - 3362 - 3358 - 3350
SELL ZONE:
3408 - 3410
SL: 3414
TP: 3404 - 3400 - 3396 - 3392 - 3386 - 3380
BUY ZONE:
3292 - 3290
SL: 3286
TP: 3296 - 3300 - 3304 - 3308 - 3312 - 3316 - 3320
Important Notes:
Risk Management: Due to high volatility, make sure to use appropriate stop losses (SL) and take profits (TP).
Watch for Key Levels: Pay close attention to the 3300-3320 zone for signs of a potential bounce or further breakdown.
Adapt to Market Movement: Given the uncertainty, stay flexible and adjust your strategy accordingly.
Conclusion:
Gold’s market is in a highly volatile phase. Key support and resistance levels will determine the next move. Keep a close eye on market reactions and act accordingly.

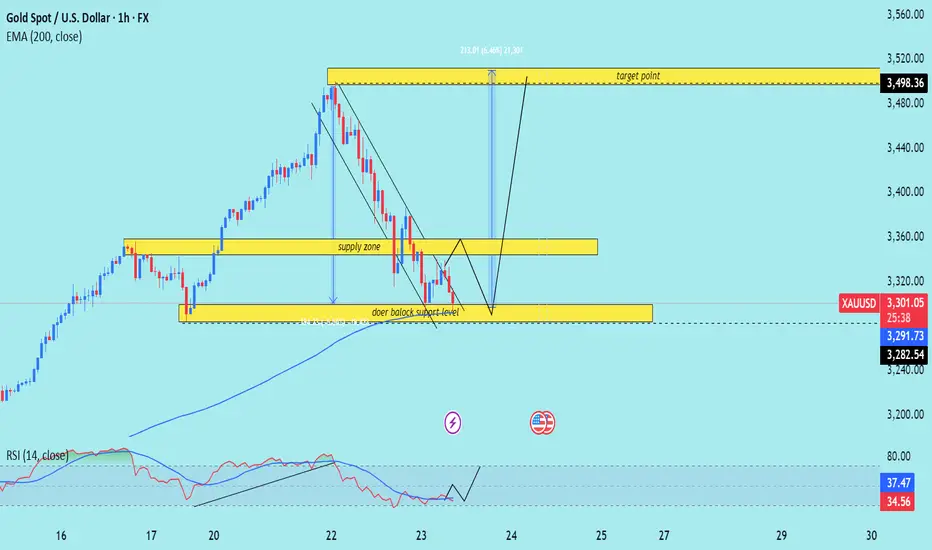
XAU/USD) orderblok key Support Analysis Read The ChaptianSMC Trading point update
technical analysis of Gold Spot against USD (XAUUSD) on the 1-hour timeframe. Here's a breakdown of the key ideas presented:
Chart Analysis Summary:
1. Price Zones:
Supply Zone (Resistance): Around the 3,355–3,365 level.
Demand/Support Zone (Doer Block Support Level): Around 3,282–3,291.
2. Current Price Action:
Price is currently at $3,331.96, close to the supply zone, and bouncing between the zones.
There’s a sharp downtrend, which seems to be slowing down near the support level.
3. Projected Move:
The chart suggests a short-term dip back into the demand/support zone, followed by a bullish reversal.
Target Point: A move back up toward $3,498.36, which is marked as a significant resistance.
4. Technical Indicators:
RSI (Relative Strength Index): Currently around 36.64 and recovering, suggesting potential bullish divergence or an oversold condition.
200 EMA: Around $3,291.52, providing dynamic support — aligning with the lower demand zone.
Mr SMC Trading point
Trade Idea:
Buy Setup (Long Trade):
Entry: Near 3,282–3,291 (support zone).
Target: 3,498.36.
Stop Loss: Below the support zone (~3,270).
Overall Idea:
This is a reversal-based setup. The price is expected to retest the support before launching a bullish leg toward the target. The confluence of the EMA, support zone, and RSI near oversold adds weight to the potential for a bounce.
Pelas support boost 🚀 analysis follow)
EUR/USD Holding Key Support – Eyes Set on 1.1555?Today, EUR/USD remains steady around the 1.1280–1.1300 support zone after a mild pullback. This area aligns with the EMA89 and an ascending trendline, suggesting that the risk of a deeper decline is limited for now.
✅ Key news: The USD is under pressure as markets expect the Fed to keep rates unchanged or pivot toward a more dovish stance. This supports the euro and helps maintain the pair’s upward momentum.
As long as the price holds above this support, a move back toward 1.1420 – 1.1555 remains very much on the table.

Gold Slides on Trump Remarks — But Trading Opportunities RemainGold (XAU/USD) fell over 1% in early Asian trading on Wednesday, currently hovering around $3,333. The drop came after U.S. President Donald Trump clarified that he has no intention of firing Federal Reserve Chairman Jerome Powell.
Trump stated, "The media tends to exaggerate things. No, I’m not planning to fire him. I just want to see him take a more active stance in cutting interest rates." This comment signaled reduced pressure on the Fed, which weakened gold's safe-haven appeal for the short term.
Gold also showed signs of pullback due to developments around Russia-Ukraine peace talks and U.S.-China tariff negotiations. While the long-term bullish trend has paused, the current dip presents new trading setups worth considering.
💡 Suggested Trade Ideas:
SELL XAU/USD:
Zone: 3432–3435
🎯 Take Profit: 3405 / 50–300 pips
🛑 Stop Loss: 3440
BUY XAU/USD:
Zone: 3286–3283
🎯 Take Profit: 3323 / 50–400 pips
🛑 Stop Loss: 3278
Stay calm, read the price action, and make your move when the market enters key zones.
Happy trading and good luck out there! 💰

Gold Elliot Wave Counts - Possibility 2 (Weekly 3rd done)There are two possibilities in Gold. Possibility 1 shared in another post (Targets of Possibility 1: 0.236: $2056, 0.382: $2781)
As per Possibility 2 the spike move up was 5th of 3 and hence we have just completed a 3rd Wave in weekly time frame - ending the move from Oct 2023 lows.
In this case also, we can expect 0.382: 2850, 0.5: 2650.
Gold went up on account of multiple reasons, key of which being de-dollarization and buying by non US countries.
However, my sense is that the spike in price was on account of trades from institutions, which will get unwound when price starts correcting and fuel the correction on the way down.
The move in last 2 weeks was a typical parabolic move, which should mark the capitulation.
Probable Risk: The last move from April lows was just 1 of 5. Hence keeping SL of current high is important.
Breaking 3150 (0.618 of the move from April) should give us more confident that 5 is done.

Gold May Be Entering a New Era — Are You Ready?Last week, gold extended its historic rally once again. As trade tensions between the U.S. and China escalated and the Fed signaled a possible policy shift, the yellow metal regained strong momentum, pushing to new highs around $3,380, gaining over 500 pips from the week’s opening.
What’s most notable is that despite these record levels, market sentiment remains clearly optimistic — and in my view, that optimism is well-founded.
We’re seeing capital flow into gold from all directions: speculators, institutional funds, and even central banks. In today’s uncertain climate, gold isn’t just an option — it’s the market’s natural reaction to instability.
This isn’t only about tariffs or geopolitics. What truly fuels the move is the Fed’s increasingly dovish tone. And every time monetary policy softens, gold steps back into the spotlight as a defensive anchor.
Unless we see a major surprise — such as a sudden trade resolution or a sharp policy pivot — there’s little reason to expect the uptrend to end here. In fact, any short-term correction could serve as a healthier entry point rather than a reversal signal.
So the real question right now isn’t “Has gold gone too far?”
It’s: “Are we ready for a much longer bullish cycle?”

GOLD SMASHES $3,450 – THE FINANCIAL RESET IS HERE! GOLD SMASHES $3,450 – THE FINANCIAL RESET IS HERE!
🔥 The Unstoppable Surge 🔥
Gold explodes past $3,450 as Chinese markets open – a $100/day spike!
In just 2 weeks, gold has soared $500 – this isn’t a rally, it’s a SUPERCHARGE!
Chinese capital is flooding into gold – they’re the Big Boy driving this wave.
💵 USD in Freefall – The Great Escape 💵
DXY crashes hard – the USD is bleeding value.
Money is fleeing the U.S. – investors are ditching the old system.
Gold isn’t just rising – it’s a signal of retreat from the USD and the legacy financial order.
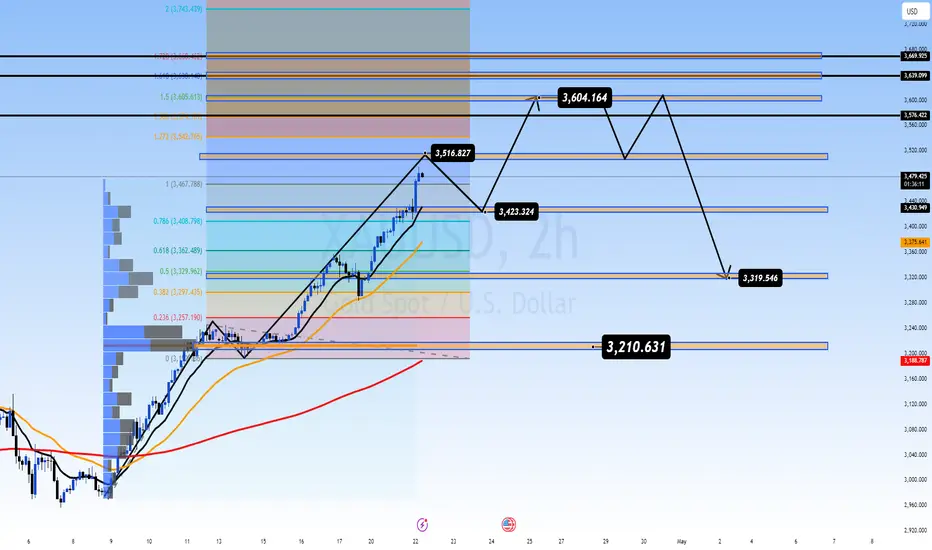
📈 Technical Breakdown 📈
Gold is testing $3,519.546 – a critical resistance (see chart).
Next support at $3,210.631 if we see a pullback.
Fibonacci levels highlight key zones – $3,416.132 as a potential retest.
Momentum is insane – this could be the start of a global market reset.
🌍 What’s Next? 🌍
If gold holds above $3,450, we’re looking at $3,600+ soon.
A financial game reset is looming – are you ready?
Chart Analysis: Gold’s 2H chart shows a parabolic move with heavy volume from Chinese buyers. The trend is clear – this is a structural shift, not a blip.
⚠️ Key Levels to Watch
Resistance: $3,519, $3,601
Support: $3,416, $3,210
Breakout Target: $3,600+
BUY ZONE 3424 - 3422
SL: 3418
TP: 3428 - 3432 - 3436 - 3440 - 3450
SELL ZONE: 3604 - 3606
SL: 3610
TP: 3600 - 3596 - 3592 - 3588 - 3584 - 3580
Gold Holds Steady — Is Another Rally Brewing?Gold prices are holding firm above the key zone around $3,330/oz, showing resilience despite the market slowing down for the Easter holiday. While price action is currently sideways, the bullish momentum hasn't faded.
Ongoing geopolitical tensions, economic uncertainty, and U.S. trade policy shifts continue to fuel safe-haven demand for gold. For now, resistance stands near $3,353, with a solid support base forming around $3,300.
After a strong rally, gold may enter a brief phase of consolidation before building fresh momentum. The ideal approach? Watch for pullbacks to key areas like the EMA 34 or support zones — or wait for a clean breakout above resistance to jump in once the market regains full liquidity.
Stick with the trend, traders — and don’t forget to secure your trades with proper TP and SL. Stay sharp!

Buying Opportunities Based on Key Support and Resistance LevelsGold Strategy for Today: Buying and Selling Opportunities Based on Key Support and Resistance Levels 📈💰
Market Overview:
Gold (XAU/USD) is currently trading in a narrow range, with slight pullbacks but maintaining its upward trend. Below are the key levels that traders should pay attention to today:
Key Support Levels:
3,353.708: A strong support level, potentially a good buy entry if gold pulls back to this level.
3,334.067: Another support zone to keep an eye on for potential bounce if buying pressure remains strong.
Key Resistance Levels:
3,412.327: The primary resistance level; if gold breaks above this, it could continue pushing upwards.
3,419.386: The next significant resistance zone; watch for price action around this level.
Trading Strategy:
BUY ZONE:
3,353 - 3,334
SL: 3,328 (Stop loss to ensure protection)
TP: 3,368 - 3,380 - 3,390 - 3,400 - 3,420
SELL ZONE:
3,412 - 3,420
SL: 3,430 (Stop loss to ensure protection)
TP: 3,400 - 3,390 - 3,380 - 3,370 - 3,360
Outlook:
Gold is still in a strong uptrend, with key support levels at 3,353 and 3,334 providing good buying opportunities. However, as the price approaches resistance levels at 3,412 and 3,419, caution is advised when selling if the price fails to break through and continues higher.
Short-Term Strategy:
During the Asian and European sessions, traders can look for buy opportunities at the nearest support levels if the price pulls back while maintaining its upward momentum.
If the price reaches key resistance zones, consider selling with clear reversal signals.
Important Reminder:
Always stick to your TP/SL levels to ensure risk management and avoid large losses during volatile market conditions.

Gold Is Back in the SpotlightGold has been drawing renewed attention lately, fueled by the weakening U.S. dollar — a consequence of increasingly erratic U.S. trade policies. While the dollar remains the world’s dominant reserve currency, more and more signs suggest that gold is quietly reclaiming its role as a reliable hedge in an uncertain global environment.
One of the biggest catalysts is China’s recent move allowing insurance companies to increase their allocation into gold. That decision alone could generate hundreds of tons in new annual demand — a game-changer in a market where global supply remains tight.
At the same time, major institutions like Citi, UBS, Goldman Sachs, and Bank of America have all raised their gold forecasts for 2025–2026. Some now see gold reaching as high as $3,500/ounce, signaling growing confidence that we’re entering a long-term bullish cycle — not just a short-term surge.
From my perspective, this isn’t just a reaction to news headlines. It feels like a deep, structural shift in how institutions are approaching gold. Last Wednesday’s $100 spike wasn’t random — it marked a clear surge in momentum and sentiment.
Looking ahead, we might see short-term pullbacks, but the overall trend remains unmistakably bullish. If gold does break into new territory in the coming quarters, this could be a crucial phase for planning, observing, and positioning smart Buy entries.

Trump’s Trade Tensions Fuel Safe Haven Demand Amid USD WeaknessGold Analysis: Trump’s Trade Tensions Fuel Safe Haven Demand Amid USD Weakness 💰📈
On April 15, U.S. President Donald Trump ordered an investigation into potential tariffs on critical mineral imports, marking a further escalation in the trade dispute with global partners, especially China. This new wave of tension between the world's two largest economies has caused market sentiment to weaken, pushing investors towards safe-haven assets like gold.
Meanwhile, the U.S. Dollar (USD) has weakened, dropping to its lowest level in three years last week, making gold more attractive for holders of other currencies.
Fed's Stance on Market Volatility: Fed Chairman Jerome Powell indicated that the Federal Reserve will not intervene to "rescue" markets amid heavy volatility, emphasizing that the market is reacting to several uncertainties, particularly the ever-changing trade policies under Trump. Powell believes it's too early to determine what is really causing the volatility, and in the short term, instability could persist, partly driven by hedge funds reducing leverage.
Gold Outlook: Bullish Trend Continues:
Given the current market conditions, it’s evident that gold is likely to continue its upward momentum and reach new all-time highs (ATH). With global financial markets offering little hope for immediate monetary stimulus, as announced by the Fed, gold remains an appealing choice.
Trading Strategy:
Current View: Focus on BUY positions as the market continues to push higher. While we’re trading at ATH levels, sharp pullbacks are normal and can be expected without major news triggers.
Trade Plan: We won’t look for SELL entries at this point, but instead wait for strong market pullbacks to buy. If significant drops occur, we’ll enter BUY positions based on continuation patterns (CP) and key support levels on M15 and M30 charts.
Expected Pullback: After a strong push early in the Asian session today, the price is expected to return to the 331x - 3300 range for potential buy entries.
Key Support Levels:
3314, 3300, 3284, 3266
Key Resistance Levels:
3380, 3396, 3410
Trade Zones:
BUY ZONE: 3300 - 3298
SL: 3264
TP: 3304 - 3308 - 3312 - 3316 - 3320 - 3324 - 3330 - ???
SELL ZONE: 3396 - 3398
SL: 3402
TP: 3392 - 3388 - 3384 - 3380 - 3376 - 3370
Important Reminder:
Focus on securing BUY entries today. Although there could be sudden drops for potential SELL opportunities, they aren’t part of the plan for now. Wait for key resistance levels or psychological barriers set by other traders for potential shorting.
Always adhere to TP/SL levels to ensure your account remains safe. 🛡️

XAU/ USD) bullish trend analysis Read The ChaptianSMC Trading point update
analysis for XAUUSD (Gold vs. USD) on the 2-hour timeframe appears to suggest a bullish continuation setup after a correction. Here's a breakdown of the idea:
Key Points from the Chart:
1. Rising Channel:
The price is moving within an ascending channel.
After a breakout and strong rally, it is currently in a flag or wedge-like correction pattern.
2. Correction Zone:
The price is consolidating downward inside a small descending wedge (a bullish pattern), potentially forming a bull flag.
This is typically a sign of continuation after a strong upward impulse.
3. Support Zone:
A 4H support level is marked around 3,301.416, which aligns with the lower boundary of the flag pattern.
This is a potential buy zone for price to react and bounce.
4. Target Point:
The target is projected at 3,404.254, implying a breakout to the upside if the support holds.
5. RSI Indicator:
RSI is currently around 65, with previous values near 80, suggesting a slight cooldown but still in bullish territory.
A slight drop in RSI might occur before the next bounce.
6. EMA 200:
The EMA 200 is well below current price (around 3,137), indicating a strong bullish trend.
Mr SMC Trading point
Possible Trade Idea:
Entry: Around the 3,301–3,305 support area.
Confirmation: Wait for a bullish reversal pattern (engulfing candle or strong bounce).
Target: Around 3,404 (as per the marked target zone).
Stop Loss: Below the support zone (e.g., below 3,295), depending on risk tolerance.
Pales support boost 🚀 analysis follow)

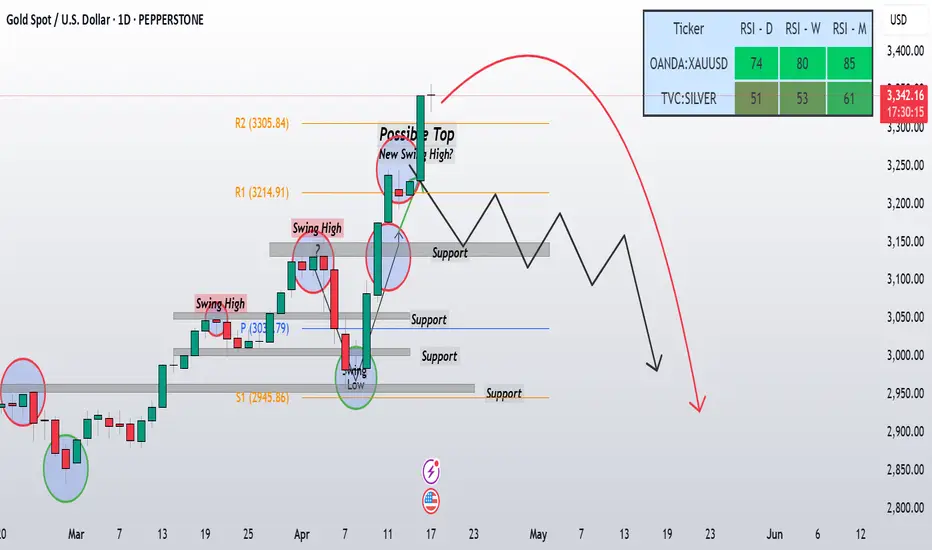
Extreme Sentiment in Metals: Gold & Silver Correction Ahead?In my previous update for this week , Despite my expectation of a correction beginning this week, Gold closed with a 3% gain yesterday, showing amazing strength . The daily chart still reflects an overbought RSI on monthly (85) and weekly (80) timeframes, reinforcing my view that a correction phase is imminent.
While Gold has soared, Silver has lagged, failing to reclaim its late March high. I expect Silver to follow gold during this correction, potentially pushing the Gold/Silver ratio higher to a target of 110-114. The recent upside move in Silver formed an ending diagonal with a powerful throw-over, suggesting exhaustion. For Silver to confirm an uptrend and invalidate the corrective count, it must break above 33.45.
Sentiment levels are at extremes, with the Daily Sentiment Index hitting 83 for Gold and 87 for Silver, indicating overbought conditions that often precede reversals. A major concern is the Dollar Index (DXY), which looks set to make a lower low after forming an triangle on the 1-hour chart. When DXY turns up, metals are likely to face heavy pressure. I believe better entry points for bullish metals positions will emerge after this correction, especially as DXY bottoming process nears.
Despite Gold recent strength, my view remains unchanged —both metals are due for a correction. Gold rally off the April 7 low appears corrective (wave iv) compared to the impulsive wave iii sell-off, and Silver ending diagonal adds to the bearish case.
The lack of daily close confirmation for a correction in Gold hasn’t altered my stance, but I’m watching closely. The DXY anticipated rally could be the catalyst to push metals lower. I’m targeting Gold support at 3,150-3,168 and then 3000 for this correction and Silver critical level at 30.50 as key areas to monitor.