Lets Talk about Nifty, Midcaps, Smallcaps and Banknifty A very general talk on the charts and where they are - more of a awareness sort of video- to exactly know where we are trading in terms of index . I make educational content videos for trading
Midcapstocks

Market View: Strong Uptrend Confirmation for Indian MarketMarket View: Strong Uptrend Confirmation for Indian Market
Key Condition for a Sustainable Rally
For a high-confidence and low-failure bullish phase in the Indian stock market, both of the following must hold:
NIFTY 50 sustains above its All-Time High
RELIANCE sustains above its All-Time High
> These two act as the backbone of the Indian indices. When they move together, the probability of a broad-based rally increases significantly.
Why NIFTY + RELIANCE Together Matter
NIFTY represents overall market sentiment and institutional positioning
RELIANCE carries heavy index weight and reflects FII + DII conviction
When both are above ATH:
Distribution risk reduces
Pullbacks turn into buying opportunities
Trend failures become rare
Impact on Small-Cap & Mid-Cap Stocks
Once NIFTY and RELIANCE confirm strength:
Liquidity flows down the market cap ladder
Small-caps and mid-caps outperform
Sector rotation accelerates
Stocks start moving toward their own All-Time Highs
Breakout + momentum strategies work exceptionally well
> Historically, real wealth-creating phases begin only after large-cap leadership confirms.
Trading Strategy (Action Plan)
Prefer buy on dips, not shorting
Focus on:
Stocks near 52-week high / ATH
Strong relative strength vs NIFTY
Volume expansion on breakouts
Avoid counter-trend shorts in mid & small caps
Risk Note
If either NIFTY or RELIANCE fails to sustain above ATH, market may:
Turn sideways
Enter selective stock-specific moves
See false breakouts in small caps
> NIFTY + RELIANCE above All-Time High = Green signal for Indian Market.
This combination unlocks powerful momentum in small-cap and mid-cap stocks, pushing the broader market toward new highs.

Midcap Multi-Bagger Moves in Trading1. Understanding Midcap Stocks
Midcap stocks generally refer to companies with a market capitalization ranging between ₹5,000 crore to ₹20,000 crore (or $500 million to $5 billion) depending on the market. They strike a balance between stability and growth potential:
Large-cap stocks are stable but slow-growing.
Small-cap stocks offer high growth but come with extreme volatility.
Midcap stocks combine growth potential with manageable risk, making them ideal candidates for multi-bagger moves.
Midcaps are often in the growth phase of their lifecycle. They have proven business models but are not yet fully recognized by institutional investors. This under-representation creates opportunities for early investors to gain extraordinary returns.
2. Characteristics of Midcap Multi-Bagger Stocks
Not all midcap stocks become multi-baggers. Successful midcap multi-baggers usually share some common characteristics:
Strong Revenue and Earnings Growth: Companies showing consistent growth in revenue and net profits, often higher than industry averages.
Scalable Business Model: Ability to expand operations, enter new markets, or increase product offerings without proportionally increasing costs.
Innovative Products/Services: Midcaps introducing unique products or services that create market disruption.
High Return Ratios: Consistently high ROE (Return on Equity) and ROCE (Return on Capital Employed) indicate efficient use of capital.
Low Debt Levels: Companies with manageable debt can reinvest profits into growth rather than servicing loans.
Institutional Recognition: Gradual interest from mutual funds and large investors often acts as a catalyst for price appreciation.
3. Factors Driving Multi-Bagger Moves
The movement of midcap stocks into multi-bagger territory is driven by a combination of fundamental, technical, and macroeconomic factors:
a) Fundamental Drivers
Profitability Expansion: Companies increasing margins due to operational efficiency, technology adoption, or scale benefits.
Sectoral Tailwinds: Industries experiencing high demand, regulatory support, or government incentives (like IT, renewable energy, pharmaceuticals).
Market Share Gains: Companies successfully capturing competitors’ market share through innovation or cost leadership.
b) Technical Drivers
Breakout Patterns: Price movements above historical resistance levels often attract momentum traders.
Volume Expansion: Rising volumes signal genuine investor interest and reduce liquidity concerns.
Institutional Accumulation: When large investors buy in gradually, it supports price stability and long-term uptrend.
c) Macroeconomic Factors
Economic Growth: Midcaps benefit more in a growing economy due to scalability and higher discretionary spending.
Policy Support: Favorable government policies like Make in India, tax incentives, or industry-specific reforms accelerate growth.
Liquidity Conditions: Low-interest rates and higher retail participation often drive up stock prices, including midcaps.
4. Strategies to Identify Midcap Multi-Baggers
Investors employ multiple strategies to identify potential midcap multi-baggers:
Fundamental Analysis:
Analyze balance sheets for revenue and profit growth.
Assess profitability ratios like ROE, ROCE, and profit margins.
Check debt-to-equity ratios and cash flows.
Sectoral Analysis:
Identify industries with high growth potential.
Look for midcaps within these sectors that are leaders or emerging leaders.
Technical Screening:
Use moving averages, trend lines, and volume indicators to spot breakout stocks.
Identify consolidation patterns that precede a rally.
Growth vs. Valuation Analysis:
A true multi-bagger is often undervalued relative to its growth potential.
Metrics like PEG ratio (Price/Earnings to Growth) can be useful.
Tracking Promoter Holding and Insider Buying:
Increasing promoter confidence is often a precursor to stock price appreciation.
Macro Awareness:
Be aware of government initiatives, economic cycles, and sector-specific reforms.
5. Risks Associated with Midcap Multi-Baggers
While midcap multi-baggers are enticing, they come with risks that every trader should be aware of:
Volatility: Prices can fluctuate dramatically due to low liquidity.
Market Sentiment: Negative news or global macro events can disproportionately impact midcaps.
Execution Risk: Companies may fail to scale operations efficiently, leading to missed expectations.
Overvaluation Risk: During bull markets, midcaps often get overvalued, leading to corrections.
Regulatory Risk: Policy changes can affect midcap companies more than established large-cap firms.
Risk management strategies like stop-loss orders, portfolio diversification, and position sizing are crucial to protect capital.
6. Trading Approaches for Midcap Multi-Baggers
There are multiple ways to approach midcap multi-bagger stocks in trading:
a) Long-Term Investment (Buy & Hold)
Buy fundamentally strong midcaps with multi-bagger potential.
Hold through market volatility to realize exponential gains over 3-5 years.
b) Momentum Trading
Focus on midcaps showing breakout patterns, high relative strength, and institutional buying.
Enter during upward trends and exit once momentum weakens.
c) Swing Trading
Identify short-term price oscillations in fundamentally strong midcaps.
Capitalize on price swings while limiting exposure to prolonged downturns.
d) Options Strategies
Use call options to leverage returns with limited capital in highly promising midcap stocks.
Protective puts can hedge against unexpected downtrends.
7. Case Studies of Midcap Multi-Baggers
Several midcap companies in India and globally have delivered exceptional returns:
Bajaj Finance (India) – Evolved from midcap to large-cap, delivering 10x+ returns over a decade.
Page Industries (India) – Niche player in textiles, achieved multi-bagger status due to consistent growth.
Eicher Motors (India) – Benefited from strong product positioning and market share gains.
Case studies highlight the importance of timely investment, research, and patience in reaping multi-bagger benefits.
8. Tips for Retail Traders
Diversify: Avoid putting all capital into one midcap stock.
Focus on Fundamentals: Short-term volatility may be high, but strong fundamentals increase multi-bagger chances.
Monitor Trends: Follow market news, sector growth, and macroeconomic indicators.
Patience is Key: Multi-bagger moves often take 3–7 years to materialize.
Avoid Herd Mentality: Don’t chase stocks just because they are trending; focus on research-based picks.
Conclusion
Midcap multi-baggers represent a unique opportunity for traders and investors willing to balance risk and reward. These stocks lie at the intersection of growth, innovation, and market inefficiencies. While identifying them requires a combination of fundamental research, technical analysis, and macroeconomic awareness, the potential rewards can be extraordinary. By understanding the drivers, risks, and strategies involved, traders can position themselves to benefit from the transformational wealth creation that midcap multi-baggers offer.
The world of midcap trading is not for the faint-hearted, but for disciplined investors with a growth mindset, it can be the playground of extraordinary returns.
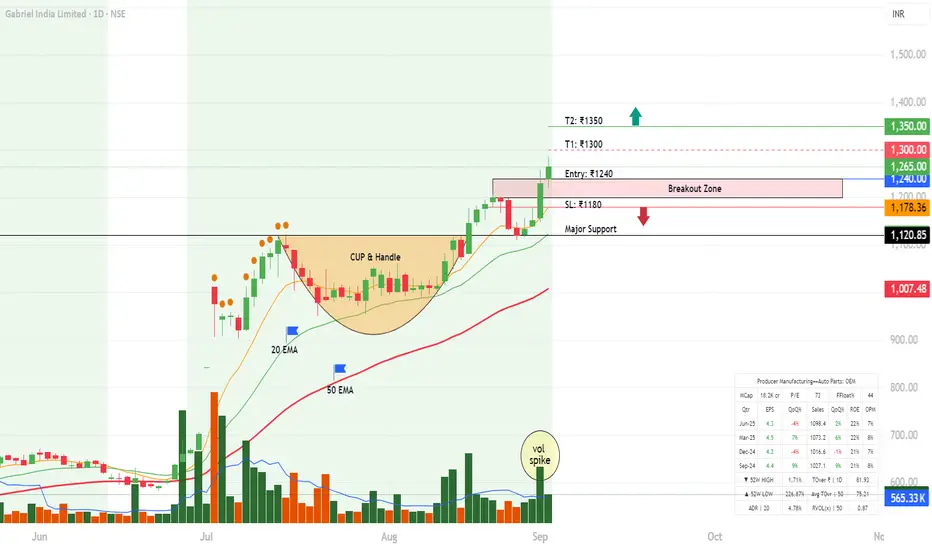
Gabriel India Ltd | Textbook Cup & Handle Breakout | Swing TradeGabriel India has formed a classic Cup & Handle pattern on the daily timeframe and given a decisive breakout above ₹1200 with strong volumes.
This indicates institutional accumulation and signals the start of a potential bullish leg.
Technical Analysis
Pattern: Cup & Handle → bullish continuation
Breakout Zone: ₹1200–1240 (now acting as strong support)
Current Price: ₹1265 (close as of 02 Sep 2025)
Volume: Noticeable spike, validating breakout strength
EMA Setup: Price trending above 20EMA (₹1178) & 50EMA (₹1123) → trend intact
Fundamental Key Area
Sector: Auto Ancillary (OEM supplier – suspension systems)
Market Cap: ~₹18,200 Cr (Mid-cap)
P/E: ~73 → premium valuation, market pricing in growth
Recent EPS: ₹4.3 (Jun-25) → steady growth
Sales Growth: +22% YoY (Jun-25) → consistent performance
Operating Margin: ~8% → stable margins for auto sector
Trade Plan
Entry Zone: ₹1240–1265 (CMP or on dips)
Stop-Loss: ₹1180 (below handle support & 20EMA)
Targets:-
T1: ₹1300 (Partial booking) (expected timeline 1-2 weeks)
T2: ₹1350 (Extended move) (expected timeline 2-3 weeks)
RR ≈ 1:1.8 → Favourable setup
Note: This analysis is shared purely for educational and informational purposes based on chart patterns and publicly available data. It should not be considered as investment advice. Please do your own research or consult a financial advisor before making trading decisions.
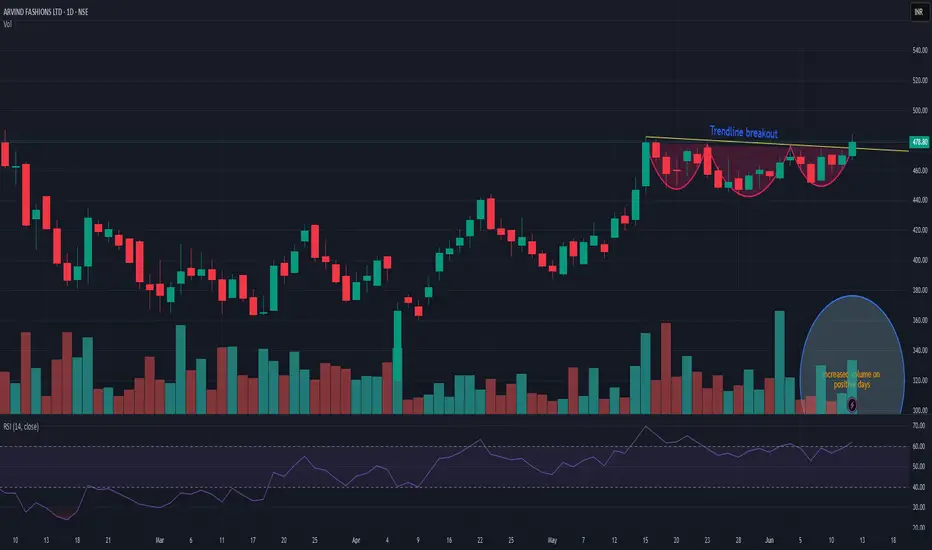
ARVINDFASNARVINDFASN showing very good strength on this negative days as well and currently trying to coming out of consolidation. As long as it is closing above 440 then dips are good to accumulate. Positive momentum may fetch the stock up to 600 in near term. And next trigger level can b above 485. Wait for the perfect entry point.
Nifty Mid_Select IndexHello & welcome to this analysis
From July 2022 to Sep 2024 it appears to have completed an impulse 5 waves up structure forming a Primary Wave 1
From Sep 2024 to Apr 2025 is a corrective ABC wave that has done a 38 Fibonacci retracement.
While it is too early to suggest whether that zigzag fall was a Primary Wave 2 or Wave A of B. The unfolding in the daily time frame suggest the probability of the former and start of a Primary Wave 3.
A weekly close above 13250 would increase the conviction of an impulse wave for probable levels where it could make swing highs along its path at approx 14300, 15000, 18000 & 20000.
Keep in mind where I have plotted Intermediate Wave 3 could also be an expanded Wave B. Therefore, keep an alternate count in hand till it gives more and more confirmation for bullishness.
I am going with the probability of this being a bullish structure as of now
All the best

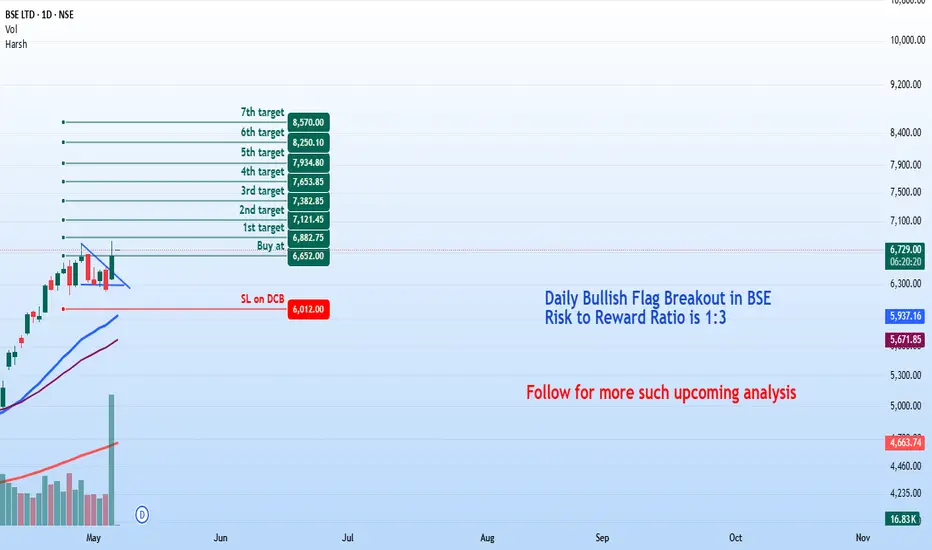
BSE Ltd - Bullish Breakout Setup (Daily Timeframe)Stock: BSE Limited ( NSE:BSE )
Trend: Strong Bullish Momentum 🚀
Risk-Reward Ratio: 1:3 (Favorable)
Trade Parameters
🎯 Entry Zone: ₹6,650 (Breakout Confirmation)
🛑 Stop Loss: ₹6,012 (Daily Closing Basis) (~9.6% Risk)
🎯 Target Levels:
₹6,882.75
₹7,121.45
₹7,382.85
₹7,653.85
₹7,934.80
₹8,250.10
₹8,570 (Final Target)
Technical Justification
✅ Bullish Flag Breakout - Price has broken out from a consolidation pattern, indicating continuation of uptrend
✅ Strong Momentum - Daily & Weekly RSI >60 (Bullish zone)
✅ Volume Confirmation - Breakout volume 10.8M vs previous day's 2.51M (4.3x surge!)
✅ Fundamental Catalyst - Very good quarterly results supporting bullish sentiment
Key Observations
• The breakout comes with exceptionally high volume, validating strength
• Multiple targets allow for progressive profit booking
• Risk-reward ratio of 1:3 makes this an attractive setup
Trade Management Tips
• Consider partial profit booking at each target level
• Move stop loss to breakeven after Target 1 is achieved
• Trail stop loss to protect profits as price progresses
Disclaimer 📢
This analysis is for educational purposes only and does not constitute financial advice. Trading in equities involves substantial risk of loss and is not suitable for every investor. Past performance is not indicative of future results. Always conduct your own research and consider your risk tolerance before making any investment decisions. The author assumes no responsibility for any trading losses that may occur from using this information.
Medium term trading opportunity in KIMS for >20% upsideHi,
NSE:KIMS has given a Bullish Flag Breakout on Weekly charts with very good volume.
MACD is also on the bullish side on Weekly time frames. RSI is also on the bullish side on daily, weekly and monthly time frames.
In the current market scenario, I am expecting that the bullish momentum will continue.
Complete price projection like entry, stop loss and targets mentioned on the charts for educational purpose.
Don't Forget to Follow me to get all the updates.
Please share your feedback or any queries on the study.
Disclaimer: Please consult your financial advisor before making any investment decision.

Bullish Flag Breakout in Marico. A Potential Upside OpportunityStock: Marico Ltd. (NSE: MARICO)
CMP: ₹715
Buy Above: ₹715
Stop Loss: ₹678
Target Levels: ₹729.50, ₹745.20, ₹761.25, ₹777.60, ₹794.30, and ₹810 (Final Target)
Time Frame: Short to Medium Term
🏢 About the Company: Marico Ltd.
Marico Limited is one of India's leading consumer goods companies operating in the beauty and wellness space. With well-known brands like Parachute, Saffola, Hair & Care, Set Wet, and Livon, Marico has a strong domestic presence and a growing international footprint across emerging markets in Asia and Africa. The company is known for consistent performance, strong cash flows, and product innovation in the fast-moving consumer goods (FMCG) sector.
Sector: FMCG
Market Cap: Approx. ₹91,000 Cr (as of April 2025)
Headquarters: Mumbai, Maharashtra
NSE/BSE Code: MARICO
🔍 Technical Analysis
A bullish flag breakout has been observed on the daily chart, indicating a potential continuation of the uptrend. Key observations:
Strong volume spike confirms buyer interest at breakout levels.
The price broke above the flag pattern with a decisive close above the resistance trendline.
Moving averages are aligned in a bullish formation (price > 20 EMA > 50 EMA).
RSI near 62 and rising, without being overbought, supports further upside.
This setup aligns with classic flag pattern breakout behavior, offering an excellent risk-reward ratio.
📊 Trade Setup
Entry Stop Loss Target 1 Target 2 Target 3 Target 4 Target 5 Final Target
₹715 ₹678 ₹729.50 ₹745.20 ₹761.25 ₹777.60 ₹794.30 ₹810
⚠️ Disclaimer
This analysis is for educational and informational purposes only.
I am not a SEBI-registered advisor. All trading and investment decisions should be made based on your own research or consultation with a qualified financial advisor. Stock markets involve risks, and past performance is not indicative of future results. Please use proper risk management and position sizing strategies when trading.
Don't forget to Follow for more such Ideas

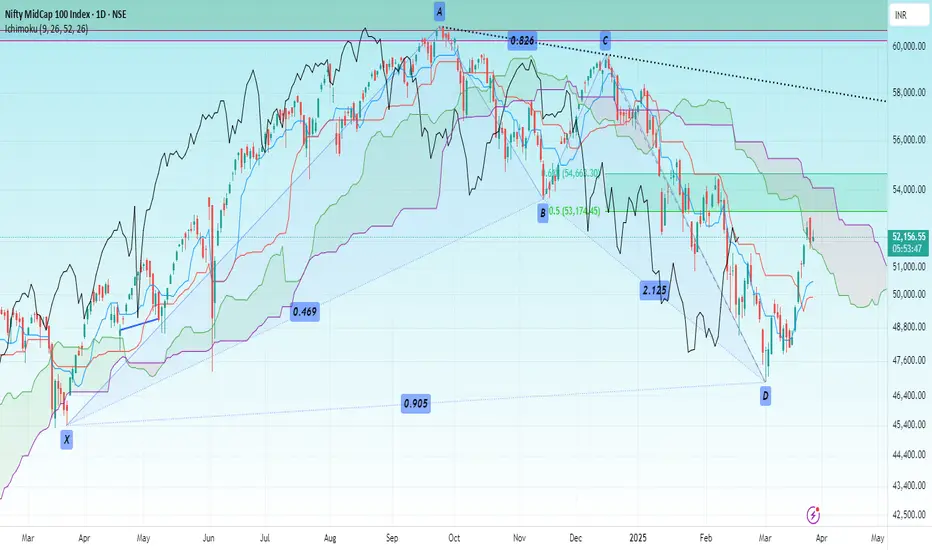
MIDCAP INDEXHello & welcome to this analysis
The index after a steep decline formed a bullish Harmonic Bat reversal pattern.
At the 50% retracement level it has formed a three candlestick bullish signal - Upside Tasuki Gap suggesting further upside.
As long as it sustains above 51500 it could continue its up move till 54500 that is the 62% retracement and above that 57500 that coincides with the trend line resistance.
All the best
CAPLIPOINTCAPLIPOINT giving resistance breakout. Its a clear base setup with decent volume. Get ready for the next ride. I built 1st position nr 1550 level and not its trading nr 2600.

NIACLNIACL giving resistance breakout with increased market participation. I have observed strong momentum in insurance sector. It seems momentum may continue. Keep it on radar

Trading Opportunity: Kabra Extrusiontechnik (Daily Flag BreakoutStock: NSE:KABRAEXTRU
Pattern: Flag Breakout (Daily Chart)
Type: Short to Medium-Term Trade
Trade Details
Buy Level: ₹513
Stop-Loss: ₹485
Targets:
₹527
₹543.35
₹555.60
₹570.05
₹584.35
Final Target: ₹597.50
Risk-to-Reward Ratio: 1:3
Analysis and Rationale
Kabra Extrusiontechnik has formed a classic flag breakout pattern on the daily chart, signifying a strong continuation of the ongoing uptrend.
Entry Level: ₹513 aligns with the breakout confirmation.
Stop-Loss: ₹485 protects against invalidation of the setup.
Targets: Derived based on measured moves and prior resistance levels.
Key Observation s
Trend Continuation: The flag breakout indicates bullish momentum.
Risk Management: Attractive risk-to-reward ratio of 1:3 enhances trade viability.
Scaling Out: Partial profit-booking at intermediate targets is advised.
Disclaimer
This analysis is for educational purposes only. Trading involves risk; consult a financial advisor before making investment decisions. Always trade within your risk tolerance.

Trading Opportunity: Salzer Electronics (On-Neck Breakout)Stock: NSE:SALZERELEC
Pattern: On-Neck Breakout (Weekly Chart)
Type: Medium-Term Trade Opportunity
Trade Details
Entry Point: Buy at ₹1411
Stop-Loss: ₹1257
Targets:
₹1486.45
₹1561.90
₹1649.90
Final Target: ₹1739
Risk-to-Reward Ratio: 1:2
Analysis and Rationale
The stock of Salzer Electronics has shown an on-neck breakout on the weekly chart, indicating a continuation of bullish momentum. This breakout is backed by strong price action, suggesting a favorable medium-term opportunity for traders.
Entry Level Justification: ₹1411 is a key level of confirmation where the breakout appears sustainable.
Stop-Loss Positioning: ₹1257 serves as a strategic stop to protect capital while allowing the trade room to develop.
Target Projections: The targets are calculated based on historical resistance levels and measured moves post-breakout.
Key Observations
Bullish Momentum : The on-neck breakout signifies buyer strength, hinting at further upside potential.
Volume Confirmation: Monitor trading volume, as increasing volume can further validate the breakout.
Medium-Term Horizon: The trade is structured for medium-term gains, ideal for positional traders.
Trade Plan
Risk Management: Maintain discipline by adhering to the stop-loss to ensure controlled risk.
Scaling Out: Consider partial profit-booking at intermediate targets to lock in gains.
Monitoring: Regularly track the stock’s performance to adjust levels if market conditions change.

VARUN BEVERAGE GONNA FIZZ UPBased on Technical parameters believe that Varun beverages has bullish biasness due to triangle breakout in a ascending channel
Stop Loss and Targets are marked in the chart
Once can follow the same pattern and enjoy the gains.
Dont forget to Trail your Stop Loss

MIDCAP100I see MIDACAP100 index very strong. In my opinion it is heading towards previous high.
1. Crossed previous top
2. RSI also showing positive compared to previous high RSI. Infact its above all high since July.
3. FII turning towards buy though in small numbers.
4. Taken a strong support nr 200 DMA
My view might be changed if it closes below 57600.

Bajaj Housing Bullish BiasBased on Technical parameters believe that Bajaj Housing has bullish biasness in the counter supported with a W pattern breakout
Stop Loss and Targets are marked in the chart
Once can follow the same pattern and enjoy the gains.
Dont forget to Trail your Stop Loss

Supriya Lifescience Ltd. (SUPRIYA): Flag Breakout OpportunityKey Points:
Pattern : Clear Bullish Flag breakout on daily chart.
Entry : Ideal buy point at ₹804 after breakout confirmation.
Stoploss : Set at ₹745 to protect against downside.
Targets:
833 INR
862 INR
891 INR
922 INR
948 INR
977 INR
Risk-Reward : Offers a potential reward up to 173 INR with a risk of 59 INR.
Considerations: Volume spike on breakout necessary for validation. Always review market conditions and company fundamentals.

KIRIINDUS (Kiri Industries Ltd.): Bullish Flag BreakoutSetup:
Pattern: Kiri Industries has formed a Bullish Flag on the daily chart, signaling a potential continuation of the prior uptrend.
Breakout: The stock has recently broken out of its consolidation phase, confirming the flag pattern.
Entry Strategy:
Buy at: 613 INR. Wait for a confirmation close above the flag's resistance for entry.
Risk Management:
Stoploss: Set at 554 INR, positioned below the flag's lower trendline.
Profit Targets:
1st Target: 644 INR
2nd Target: 670 INR
3rd Target: 702 INR
4th Target: 729 INR
5th Target: 760 INR
6th Target: 788 INR
Risk/Reward:
Risk : 59 INR (Entry - Stoploss)
Rewards: Ranging from 31 INR to 175 INR, offering a strong risk-reward profile.
Notes:
Volume Confirmation: Ensure the breakout volume is higher than average to validate the setup.
Market Context: Consider the sector and broader market trends for added confidence.
Fundamentals: For long-term holds, review company fundamentals.
This setup provides traders with a clear plan for entering, managing risk, and aiming for multiple profit levels. However, always adapt your strategy to real-time market conditions.

KOTHARI PETRO By KRS Charts31st Oct 2024 / 10:13 AM
Why KOTHARIPETRO❓
1. Fundamentally Good Company with Good Durability and at Good Valuations. ✅
2. Technically, All Time Bullish Stock. 📈
3. In August, Broke Resistance and Now again giving opportunity to Buy at same Price while Retesting same Resistance Zone.
4. Though Better Entry would be around 206 to 209 Rs range.
5. Further Bullish sign, Bullish Continues Divergence is visible with MACD, means Sellers are Exhaust and Failed to Make New High. 💪
Target is Marked in Chart SL will be Flexible Either staying above 100 EMA or Staying above Resistance Zone any.

Positive RSI Divergence As it can be seen on the Daily Time frame chart
The price has moved down from 55165 to 53833 (-1332 points)
during the time period of 25/10/24 to 13/11/24
While during the same time period the RSI has moved
upwards from 28.99 to 30.66
It is a 13 bar divergence
If the RSI crosses and sustains the level of 40 on Daily time frame ,
we could expect an upmove towards 55230 / 56500 levels respectively.

MIDCP nifty making Head and shoulder and near support dailyMidcap nifty index MIDCP making head and shouler pattern in daily timeframe also at crucial trendline support breaking below create more panic till 11850,11600,11380.

Medium term opportunity in Refex Industries for V.good upsideHi,
NSE:REFEX has given a Bullish Flag Breakout on Weekly charts with very good volume.
MACD is also on the bullish side on Weekly time frames. RSI is also on the bullish side on daily, weekly and monthly time frames.
In the current market scenario, I am expecting that the bullish momentum will continue.
Complete price projection like entry, stop loss and targets mentioned on the charts for educational purpose.
Don't Forget to Follow me to get all the updates.
Please share your feedback or any queries on the study.
Disclaimer: Please consult your financial advisor before making any investment decision.
