Volatility–Momentum–Trend (VMT) Model🔎 Intro / Overview
Three-indicator confirmation using Bollinger Bands (BB) , MACD , and RSI to align trend and price action.
BB often detects the move first (least lag), MACD follows the BB trend (mid reaction), and RSI confirms last (most lag).
This staged confirmation helps reduce false signals and keeps entries disciplined.
___________________________________________________________
📔 Concept
• Bollinger Bands (BB) → Early detector at volatility extremes.
– Buy : Price first moves outside the lower band , then a candle closes back above lower band → early bullish alert.
– Sell : Price first moves outside the upper band , then a candle closes back below upper band → early bearish alert.
• MACD → Momentum confirmer.
– Buy : MACD crossover above its signal line supports the bullish shift.
– Sell : MACD crossunder below its signal line supports the bearish shift.
• RSI → Final confirmation (filters traps).
– Buy : RSI crosses above its moving average, confirming bullish momentum.
– Sell : RSI crosses below its moving average, confirming bearish momentum.
✅ Only when BB + MACD + RSI all align in the same direction is the signal confirmed.
Notes:
- BB often reacts first (fastest, but prone to false starts).
- MACD provides mid-reaction confirmation.
- RSI lags but acts as the strongest filter against false trades.
Notes: Sometimes BB reacts immediately; MACD/RSI can prevent traps. At times BB+MACD demand a trade but RSI rejects (good filter); other times RSI demands but BB+MACD filter it.
___________________________________________________________
📌 How to Use
🔴 Sell Signal
1) BB: Price first extends outside upper band in an up-move, then a candle closes back under the upper band → BB sell signal.
2) MACD: Crossunder of MACD line below signal line.
3) RSI: RSI crosses below its moving average → final confirmation.
✅ All three aligned = Valid Sell.
🟢 Buy Signal
1) BB: Price first extends outside lower band in a down-move, then a candle closes back above the lower band → BB buy signal.
2) MACD: Crossover of MACD line above signal line.
3) RSI: RSI crosses above its moving average → final confirmation.
✅ All three aligned = Valid Buy.
___________________________________________________________
🎯 Trading Plan
• Entry → Only when all three confirm in the same direction.
• Stop Loss → - Stop-Loss → Near the structure swing that formed when BB first detected the signal (e.g., recent swing high for shorts / swing low for longs).
• Target → At least 1R ; scale/exit remainder using ATR, Fibonacci levels, or box trailing to ride trend.
___________________________________________________________
📊 Chart Explanation
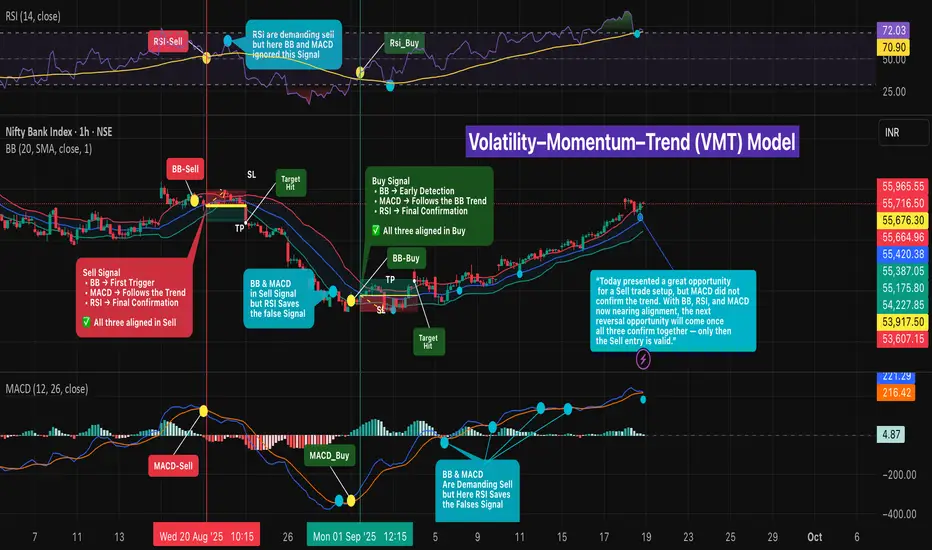
Symbol/TF: BANKNIFTY · 1H
1) 20 Aug · 10:15 — SELL
• BB detected first, MACD mid-reaction (after ~2 candles), RSI confirmed last → Entry @ 55,676.30
• Target @ 55,387.05
• Stop-loss @ 55,965.55
• 🎯 Target hit on 22 Aug · 09:15 .
• Remaining lots can be trailed using ATR , Fibonacci levels , or Box Trailing to ride the extended trend
2) 29 Aug · 10:15 — FILTERED SELL
• BB and MACD demanded sell, but RSI did not confirm → No trade; RSI saved a false signal.
• 🦋 “The aqua dots represent false signals. At times, BB detects early entries but RSI and MACD do not confirm. Sometimes BB and MACD align, but RSI rejects the move. Other times BB and RSI confirm, yet MACD signals false. ✅ Only when all three align together is the signal valid.”
3) 01 Sep · 13:12 — BUY
• All three aligned long
• Entry @ 53,917.05
• Target @ 54,121.50
• Stop-loss @ 53,712.60
• 🎯 Target hit.
• Remaining lots can be trailed using ATR , Fibonacci levels , or Box Trailing to ride the extended trend
👉🏼 “A Sell setup looked promising today, but MACD did not confirm the trend ❌. With BB, RSI, and MACD now nearing alignment, the next reversal opportunity will be valid only when all three confirm together ✅.”
___________________________________________________________
👀 Observation
• BB provides the earliest cue; MACD validates momentum shift; RSI filters late-stage traps.
• Most reliable signals occur near key structure (support/resistance) with confluence.
• Not all alignments are equal—strength improves with decisive closes and supportive volume.
___________________________________________________________
❗ Why It Matters?
•A rule-based, three-step confirmation reduces noise and emotions.
•It clarifies when to enter , when to skip , and how to manage risk consistently across changing market conditions.
___________________________________________________________
🎯 Conclusion
BB → detect , MACD → follow , RSI → confirm .
When all three align, entries are clearer and risk is defined.
🔥 Patterns don’t predict. Rules protect. 🚀
___________________________________________________________
⚠️ Disclaimer
📘 For educational purposes only.
🙅 Not SEBI registered.
❌ Not a buy/sell recommendation.
🧠 Purely a learning resource.
📊 Not Financial Advice.
Momentum Indicator (MOM)
PEAD in Inventurus Knowledge (IKS)EQUITY SWING SETUP 📊
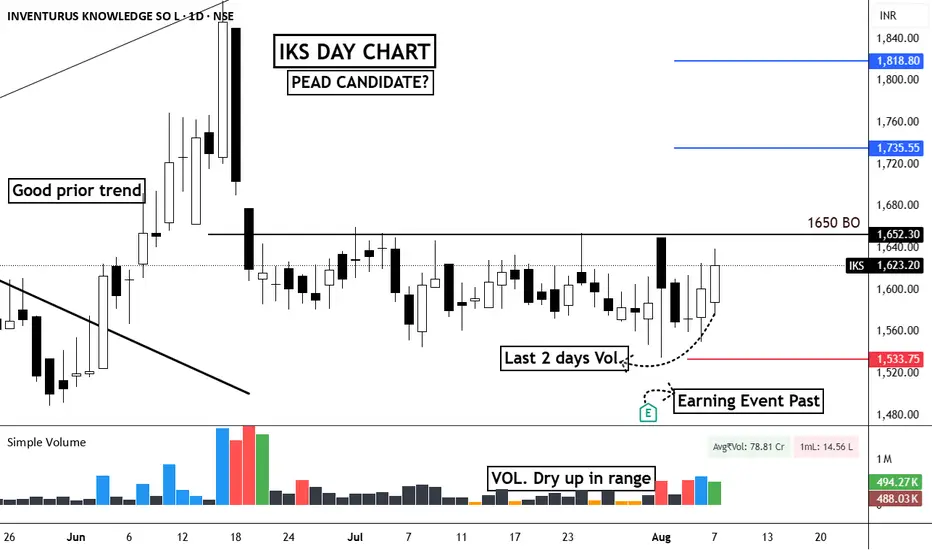
#IKS | Daily Chart Analysis
🔹Structure:-
Price is forming a rounded bottom inside a range, showing Volume Dry-Up during the consolidation phase.
Earnings event is past, reducing uncertainty, and the last two days show pickup in volume, hinting at accumulation.
Key breakout level is ₹1650, above which momentum can accelerate — possible PEAD (Post-Earnings Announcement Drift) candidate.
🟢ENTRY:
Buy above ₹1655 with strong volume confirmation.
♦️RISK:-
Stop Loss: ₹1533 (below recent swing low & support zone)
🎯TARGETS:-
1st Target: ₹1735
2nd Target: ₹1818
📌Detailed Analysis:
Volume dried up significantly during the range, a classic sign of weak hands exiting.
The base is tight, indicating strong hands holding.
Breakout above ₹1650 could trigger a quick momentum burst, especially given the post-earnings context.
Watch for strong volume on breakout day to confirm institutional participation.
📈Mark the levels on your chart and track price behavior near the breakout zone.
PARADEEP : Momentum Pick#PARADEEP #swingtrade #trendingstock #momentumtrade
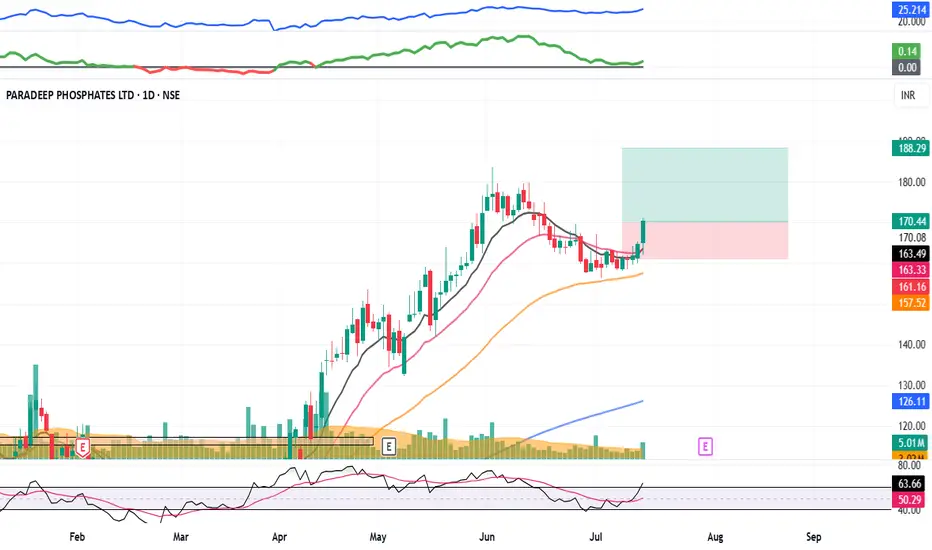
PARADEEP : Swing Trade
>> Low PE Stock
>> Good Retracement and consoldation
>> Stock Ready for next leg of Rally
>> Good Strength & Volume
>> Risk Reward Favourable
Swing Traders can lock profit at 10% and keep Trailing
Please Boost, comment and follow us for more Learnings
Disc : Charts shared are for learning purpose only, not a Trade recommendation. Do your own research and consult your financial advisor before taking any position.
DIVISLAB - CHANNEL CONSOLIDATION -WILL IT BREAKOUT OR NOTDivi's Laboratories Ltd. is an interesting chart with following
1. RSI on all time frames (i.e. D/W/M) above 60
2. Narrowing Bollinger Bands on daily chart with price walking on upper band
3. Two month's long consolidation of price in rectangular range of 5675 to 6300 levels and once price breaks out of this range, momentum will increase
4. ABCD pattern under formation on weekly chart
5. Major price supports at 5930 i.e. 20 Day SMA and 5750 i.e. 50 EMA respectively
Breakout of 6300 + levels on closing basis can fetch 6700 + and 6980 levels as per Fibonacci projection tool
Lets see How it evolves
Disclaimer: NOT A BUY / SELL RECOMMENDATION I am not an expert I just share interesting charts here for educational purpose and not to be taken as buy/sell recommendation. Please seek expert opinion before investing and trading as trading/ investing in market is subject to market risks. I do not hold any position in the stock as on date but I may look to take some position with my own Risk Reward matrix.

Mphasis still look good in heavy bearish market (Long term)“Hello everyone, Mphasis stock look good Despite the heavy market fall, it is performing well.
After a cup n handle break has occurred.
The volume is also great in this stock, and the relative strength is above 60.
It seems like the stock can maintain long-term momentum.”
Above all, given information is only for educational purpose, Before trade do your own analysis.


SAREGAMA - Stock with 50% upside potential - Here's Why!1. Price is showing strength
2. Stock have broken 2022 (2.5 yrs) level.
3. Previous week high is broken.
4. RSI & EMAs are indicating bullish momentum.
5. Price are bouncing from weekly demand

BALMLAWRIE BREAKOUT (6 year range breakout)Balmer Lawrie & Company Ltd is extremely bullish with rising volume as visible form the chart .
The financials of the company are pretty solid as well :
1. Rising PE
2. Increasing sales
3. increasing net profit
4. rising EPS
Along with all this the company also gives pretty solid dividend as well.
It is the stock to watch out for🚀🚀.

Confidence Petroleum : Momentum Stock#confipet #breakoutstock #momentumtrade #swingtrade #stockmarket
Confipet : 1-3 Month Trade
>> Institutional Buying Visible
>> Momentum Stock / Trending Stock
>> Good Strength & Heavy Volumes in Stock
>> Low Risk High Reward Trade
Swing Traders can lock 10% profit & keep trailing
Please give a Boost or comment if u r Liking the analysis & Learning from it. Keep showing ur Love by following
Disclaimer : This is not a Trade Recommendations & Charts/ stocks Mentioned are for Learning/Educational Purpose. Do your Own Analysis before Taking positions.


Lowe's Companies Inc LongI am a strong believer of technical analysis, It simplifies the process of dicition making.
Building a new long position in Lowe's Companies Inc.
:)

MasterCard Incorporated Long I am a strong believer of technical analysis, It simplifies the process of dicition making.
Building a new long position in Mastercard Incorporated .
:)

Thermo Fisher scientific Inc LongI am a strong believer of technical analysis, It simplifies the process of dicition making.
Building a new long position in Thermo Fisher scientific inc.
:)

Indiabulls Real Estate strong Breakout Indiabulls Real Estate Ltd (INRL) strong Breakout with high volume with price increase in daily chart.good momentum formed. Time to accumulate INRL. If it crosses yesterday high go for long. Next target 87. Thank you.
ILong

MANAPPURAM FINANCE TRADE SETUP FOR TOMORROWAs we already told you in the previous charts, once it break 170 level.
.
We can see the upward momentum, so the stock has given breakout.
.
You can make a position in MANAPPURAM FINANCE above 174.
.
Our short term target is 185-190.
.
What's your view on this comment below in the box.

MOMENTUM TRADE IN RELIANCEMOMENTUM TRADE IN RELIANCE
BUY@1620
STOP@1606
TARGET@1633
!!please note trade with caution!!
!!manage your risk!!
!!trade-wise!!
!!please adjust for future rates!!

Deepak nitrate new bottom at 300-320A must have in portfolio.
Buy at small risk around 300-320 with 10% stop loss.
Target will be around 1000 in 1 year.
Momentum stoc

MOMENTUM TRADE IN HDFC BANK !!(DEC FUT)!!MOMENTUM TRADE IN HDFC BANK !!(DEC FUT)!!
VIEW
-HOLDING ONTO ITS RANGE
-21-EMA SUPPORT
-SUPPORT @1250
TRADE VIEW
DEC FUT
BUY@1275
STOP@1265
TARGET 1@1287
TARGET 2@1297
LOT:250
QTY:2

INDIA CEMENTS WEEKLY MOMENTUM BUILDING UPHOURLY HAS BROKEN THE WEEKLY TRENDLINE RESISTANCE -
NOW FALLING DOWN TO TEST THE SUPPORT
ANY UTURN IN THIS MONTH CAN GIVE HUGE RETURNS....
WAIT FOR THE RIGHT ENTRY

BTST IN BANK OF INDIA OCT FUTURESBTST IN BANK OF INDIA
OCT FUTURES
BUY@79.5
STOP@76.5
TARGET@84.5
LOT:6000
QTY:1

CLong


