Momentum & Trend Following Strategies in TradingUnderstanding Momentum in Trading
Momentum refers to the rate at which the price of a financial instrument moves in a particular direction. Traders who adopt momentum strategies aim to buy assets showing upward momentum and sell assets showing downward momentum. The underlying assumption is that price trends, once established, tend to persist due to behavioral biases and institutional flows.
Key Concepts in Momentum Trading
Relative Strength: Momentum traders often compare the performance of an asset against its historical performance or a benchmark. Assets outperforming the market are considered candidates for buying, while underperforming assets may be sold or shorted.
Price Rate of Change (ROC): This measures the percentage change in an asset’s price over a specified period, helping traders identify accelerating trends.
Moving Averages & Crossovers: Traders use short-term and long-term moving averages to spot momentum. For instance, if a 20-day moving average crosses above a 50-day moving average, it signals upward momentum.
Breakouts: Momentum traders look for price breakouts from key resistance or support levels, often indicating the start of a strong directional move.
Volume Confirmation: A momentum move accompanied by higher trading volume suggests conviction and increases the probability of trend continuation.
Behavioral Rationale
Momentum is strongly linked to investor psychology. Behavioral biases such as herding, overconfidence, and delayed reaction to news contribute to the persistence of price trends. Market participants tend to chase rising assets, amplifying momentum, while undervalued or declining assets continue to fall as pessimism dominates sentiment.
Momentum Indicators
Several technical indicators are widely used in momentum trading:
Relative Strength Index (RSI): Measures the speed and change of price movements; helps identify overbought or oversold conditions.
Moving Average Convergence Divergence (MACD): Identifies trend direction and momentum strength.
Stochastic Oscillator: Compares a security’s closing price to its price range over a period, indicating momentum shifts.
Rate of Change (ROC): Quantifies the percentage change in price over a specified time frame.
Momentum strategies are typically short-to-medium-term, ranging from a few days to several months, depending on market conditions and the trader’s time horizon.
Understanding Trend Following
Trend following is a broader trading approach based on identifying and riding long-term directional movements in the market. Unlike momentum trading, which focuses on relative performance and price acceleration, trend following emphasizes sustained price movements regardless of speed. Trend followers aim to enter trades in the direction of the prevailing trend and exit when trends reverse.
Core Principles of Trend Following
Markets Trend More Often Than They Mean-Revert: Trend followers operate on the principle that markets, over medium to long-term periods, exhibit trends in response to macroeconomic factors, sentiment shifts, or institutional positioning.
Trading with the Market: Trend following is inherently reactive. Traders wait for clear signals from price movements rather than predicting reversals or tops and bottoms.
Risk Management and Position Sizing: Since trends can reverse unexpectedly, risk management is critical. Trend followers use stop losses, trailing stops, and controlled position sizes to protect capital.
Time Horizon: Trend-following strategies typically have longer holding periods than momentum strategies, ranging from weeks to months or even years in certain markets, such as commodities or forex.
Trend Following Indicators
Trend-following strategies rely heavily on technical indicators to identify the direction and strength of trends:
Moving Averages: Simple Moving Average (SMA) or Exponential Moving Average (EMA) crossovers are common trend signals. For example, a trader may buy when a shorter-term EMA crosses above a longer-term EMA.
Average Directional Index (ADX): Measures the strength of a trend regardless of direction; values above 25 often indicate a strong trend.
Bollinger Bands: Trend followers use bands to confirm price breakouts or sustained trends.
Parabolic SAR: Identifies potential trend reversals and helps with trailing stops.
Practical Implementation
Step 1: Market Selection
Both momentum and trend-following strategies can be applied across multiple markets, including:
Equities: Individual stocks or stock indices.
Forex: Currency pairs exhibiting strong directional movements.
Commodities: Metals, oil, and agricultural products.
Cryptocurrencies: Digital assets with high volatility and clear trends.
Step 2: Identifying Trends or Momentum
For momentum trading, rank assets based on recent performance, RSI, or ROC indicators.
For trend-following, analyze price charts for moving average crossovers, trendlines, or ADX confirmation.
Step 3: Entry and Exit Rules
Momentum Entry: Buy assets showing positive momentum or breaking above resistance; sell or short assets showing negative momentum.
Trend-Following Entry: Enter positions in the direction of the prevailing trend after confirmation from moving averages or trendlines.
Exit Rules: Use stop losses, trailing stops, or reversal signals to exit positions. Trend followers often ride trends until technical indicators signal a reversal.
Step 4: Risk Management
Risk management is critical for both strategies:
Position Sizing: Determine trade size based on account equity and risk tolerance (e.g., risking 1–2% per trade).
Diversification: Spread risk across multiple assets to reduce exposure to a single market.
Stop Losses: Protect capital from unexpected reversals.
Volatility Adjustment: Higher volatility assets may require tighter risk controls or smaller position sizes.
Advanced Strategy Variations
Dual Momentum: Combines relative and absolute momentum. Traders invest in assets with the strongest performance relative to others while ensuring they are positive in absolute terms.
Trend-Momentum Hybrid: Uses momentum indicators for entry and trend-following techniques for position management. For example, enter on RSI breakout but use moving averages to exit.
Sector Rotation: Momentum traders may rotate capital between sectors or asset classes based on relative performance trends.
Algorithmic and Systematic Approaches: Many hedge funds implement algorithmic momentum and trend-following strategies using quantitative models, high-frequency data, and machine learning for signal optimization.
Performance and Market Conditions
Momentum and trend-following strategies tend to perform differently depending on market conditions:
Trending Markets: Both strategies excel in strong, directional trends. Trend followers benefit from sustained moves, while momentum traders profit from short bursts of strong performance.
Choppy or Sideways Markets: Momentum strategies may generate false signals, while trend-following strategies may suffer from whipsaw losses.
Volatile Markets: Momentum strategies can capture rapid gains, but risk management is crucial to avoid large drawdowns.
Empirical studies have shown that momentum strategies often produce short-term outperformance in equities and commodities, while trend-following strategies are particularly effective in commodity, forex, and futures markets over the long term.
Behavioral and Psychological Considerations
Both momentum and trend-following strategies exploit behavioral biases:
Herding: Investors tend to follow recent winners, reinforcing momentum.
Anchoring: Market participants anchor to past prices, creating delayed reactions that trend followers can exploit.
Overreaction: Short-term overreactions create opportunities for momentum trades.
Discipline Requirement: Traders must overcome fear and greed, sticking to systematic rules rather than attempting to time reversals.
Examples of Momentum & Trend Following
Equities: Buying technology stocks outperforming the S&P 500 for the past 3–6 months (momentum) or holding positions until a 50-day moving average crossover signals a reversal (trend-following).
Forex: Trading EUR/USD when it breaks above a recent high with increasing volume (momentum) or following a long-term uptrend using EMA crossovers (trend-following).
Commodities: Entering oil futures when prices break out from a support/resistance zone (momentum) or riding a multi-month trend using ADX to gauge trend strength (trend-following).
Advantages and Limitations
Advantages
Simplicity: Rules-based approach allows systematic trading.
Adaptability: Works across multiple markets and timeframes.
Behavioral Edge: Exploits common psychological biases in trading.
Scalability: Can be applied to both retail and institutional portfolios.
Limitations
False Signals: Particularly in range-bound markets, leading to potential losses.
Drawdowns: Both strategies can experience significant losses during trend reversals.
Market Sensitivity: Performance may degrade in markets with low liquidity or sudden news shocks.
Discipline Required: Traders must follow strict rules, avoiding emotional decision-making.
Conclusion
Momentum and trend-following strategies are pillars of modern trading methodology. While momentum strategies capitalize on short-term price accelerations, trend-following strategies aim to capture long-term directional moves. Both approaches are grounded in behavioral finance principles, technical analysis, and empirical research, making them effective tools for traders seeking systematic, disciplined approaches.
The success of these strategies depends on rigorous market analysis, sound risk management, and psychological discipline. While they are not immune to losses, their adaptability across markets, scalability, and historical efficacy make them indispensable in both retail and institutional trading.
By combining these strategies intelligently, traders can create robust portfolios capable of profiting in multiple market conditions, harnessing both short-term momentum surges and long-term trends for sustained success.
Momentumstrategy
Momentum Trading Secrets: Unlocking the Market’s Hidden Energy1. The Science of Momentum
Momentum trading is rooted in behavioral finance and market psychology. It leverages the tendency of investors to underreact or overreact to new information, creating sustained price moves. The basic scientific principle can be summarized as:
“Assets that have performed well recently are likely to continue performing well in the near future, and vice versa.”
Key aspects include:
Trend Identification: Momentum traders look for assets with strong directional movement.
Rate of Change (ROC): Calculating how fast an asset’s price is changing helps determine momentum strength.
Volume Confirmation: High trading volume validates the sustainability of a trend.
Behavioral Patterns: Fear and greed amplify trends, making momentum strategies more predictable.
2. Tools and Indicators in Momentum Trading
Momentum traders rely heavily on technical indicators to gauge the strength of a move. Some of the most effective tools include:
Relative Strength Index (RSI): Measures overbought or oversold conditions to anticipate potential trend continuations or reversals.
Moving Average Convergence Divergence (MACD): Helps identify trend direction and momentum shifts.
Stochastic Oscillator: Useful for spotting trend reversals or continuation signals in volatile markets.
Volume Weighted Average Price (VWAP): Indicates the average price weighted by volume, often used by institutional traders to confirm momentum.
Rate of Change (ROC): Measures the percentage change in price over a specific period, signaling momentum strength.
The secret lies in combining indicators rather than relying on one. For example, using RSI for trend strength and MACD for entry timing often produces higher-probability trades.
3. Secrets to Identifying True Momentum
Not all price movements represent genuine momentum. The following secrets help distinguish real trends from false signals:
Look Beyond the Noise: Small price fluctuations are often misleading. True momentum comes with consistent directional moves and high volume.
Time Frame Alignment: Momentum should be confirmed across multiple time frames. A short-term uptrend in a long-term downtrend can be risky.
Sector and Market Context: Stocks often move in sync with sectors. Identifying sector momentum can increase trade success.
Catalyst Awareness: Earnings reports, news events, and macroeconomic data often trigger strong momentum moves.
Volume Patterns: Sudden spikes in volume often precede sharp moves, indicating institutional participation.
4. Entry and Exit Strategies
Mastering momentum trading requires precise timing. Secrets in execution include:
Breakout Trading: Enter trades when price breaks key resistance or support levels with high momentum.
Pullback Entries: Waiting for minor retracements during a trend allows for safer entries at lower risk levels.
Trailing Stop Losses: Using dynamic stops that follow the trend ensures profits are locked in while letting winners run.
Scaling Positions: Incrementally increasing positions as momentum strengthens reduces risk exposure.
The critical secret: never fight the trend. Momentum trading is about riding the wave, not predicting reversals.
5. Risk Management Secrets
Momentum trading can be extremely profitable but also highly risky if not managed properly. Successful traders use:
Position Sizing: Limiting exposure to a small percentage of the trading account prevents catastrophic losses.
Stop Loss Discipline: Predefined exit points are crucial, as momentum can reverse quickly.
Diversification: Trading across multiple assets or sectors spreads risk while capturing diverse momentum opportunities.
Volatility Assessment: Understanding the volatility of the instrument ensures proper risk-reward alignment.
The secret is balancing aggressive profit potential with controlled risk, turning a volatile strategy into a sustainable one.
6. Psychological Edge in Momentum Trading
Momentum trading is as much about mindset as strategy. The key psychological secrets include:
Emotion Control: Fear and greed can destroy momentum trades. Sticking to rules and systems is vital.
Patience and Discipline: Waiting for the right setup rather than chasing price is a hallmark of successful traders.
Adaptability: Market conditions change. Momentum traders must adjust strategies to new trends, not rely on past performance.
Confidence vs. Overconfidence: Understanding the difference ensures consistent execution without reckless risk-taking.
7. Advanced Momentum Trading Techniques
Seasoned traders often leverage advanced techniques to amplify profits:
Sector Rotation Strategy: Moving capital into sectors showing strongest momentum while exiting weak sectors.
Pairs Trading with Momentum: Trading correlated assets by buying the stronger momentum asset and shorting the weaker.
Algorithmic Momentum Strategies: Using quantitative models to scan multiple instruments and automatically execute trades.
Options for Momentum Leverage: Using call and put options to magnify returns while managing capital efficiently.
These techniques reveal the “hidden secrets” of institutional-level momentum trading, making it more than just buying high and selling higher.
8. Common Mistakes to Avoid
Even experienced traders stumble when ignoring momentum trading rules. Common pitfalls include:
Chasing Trends Too Late: Entering after most of the move is over reduces profit potential.
Ignoring Volume: Low-volume momentum often reverses unexpectedly.
Over-Leveraging: Excessive leverage can wipe out accounts during sudden reversals.
Neglecting Market Context: Ignoring broader market trends can lead to false signals.
Awareness of these mistakes is a secret weapon in protecting both capital and confidence.
9. Case Studies of Momentum Trading Success
Momentum trading has produced legendary gains for traders who mastered its secrets. For instance:
Tech Stock Surges: Riding early momentum in high-growth tech companies during earnings announcements.
Commodity Moves: Capturing sharp momentum in oil or gold during geopolitical events.
Cryptocurrency Trends: Exploiting rapid price swings with disciplined momentum strategies.
These examples highlight that momentum trading is applicable across markets and time frames, provided the rules are followed.
10. The Future of Momentum Trading
With advancements in technology, momentum trading is evolving:
AI and Machine Learning: Algorithms can detect momentum patterns faster than human traders.
Social Sentiment Analysis: Platforms now measure crowd psychology and predict momentum based on social chatter.
High-Frequency Trading (HFT): Institutional traders use speed and algorithms to exploit tiny momentum shifts.
Traders who understand these trends and adapt their strategies will maintain a competitive edge in the future markets.
Conclusion
Momentum trading is an art backed by science. Its secrets lie not just in indicators or charts, but in understanding market psychology, managing risk, and executing trades with discipline. By mastering trend identification, entry and exit timing, and psychological control, traders can transform momentum strategies into consistent profit engines.
While momentum trading can seem risky, applying these secrets systematically turns volatility into opportunity. In today’s fast-moving markets, momentum trading remains one of the most powerful tools for traders willing to combine technical skill with strategic insight.
HYUNDAI : Breakout stock (Swing pick)#HYUNDAI #swingtrade #momentumtrade #breakoutstock #trendingstock
HYUNDAI : Swing trade
>> Breakout with Volume
>> Trending Stock
>> Momentum Trade
>> Volatility contraction seen
>> Good Strength in Stock
Swing Traders can lock profit at 10% and keep Trailing
Please Boost, comment and follow us for more Learnings.
Disc : Charts shared are for learning purpose only, not a Trade recommendation. Do your own research and consult your financial advisor before taking any position.

GMDC Breakout GMDC BREAKOUT on 45 min and 1 hrs. Gmdc is in good Momentum. It's can give another 4 -5% movement easily. It can be achieve 580 tgt easily. It's already moved good.
Now keep trial SL and Enjoy Journey.
Buy was given near 426.
Tgt 580 - 600
Consult your financial advisor before making any position in stock market. My all views are for educational purposes only.
Visit my profile for more information

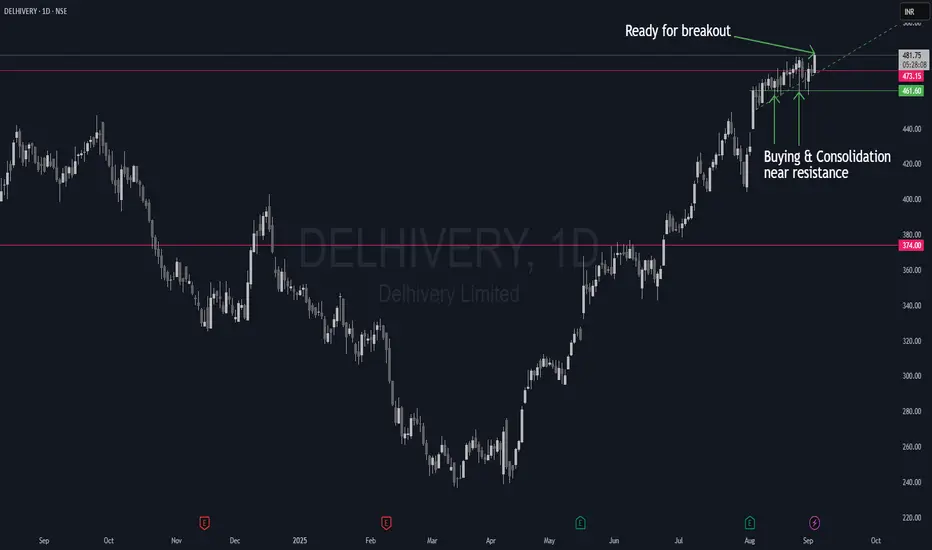
NSE:DELHIVERY - Breakout in progressAfter consolidating at the resistance for over three weeks, the stock is finally ready to launch and break above the resistance.
Entry: Break & Retest of resistance OR pullback to 9EMA/21EMA
SL: 448 (below the consolidation)
Target-1: 510
Target-2: 550
Disclaimer: The idea is for educational purposes only and must not be construed as advice to buy or sell. Consult your investment advisor before making the decision. Investments are subject to market risks.
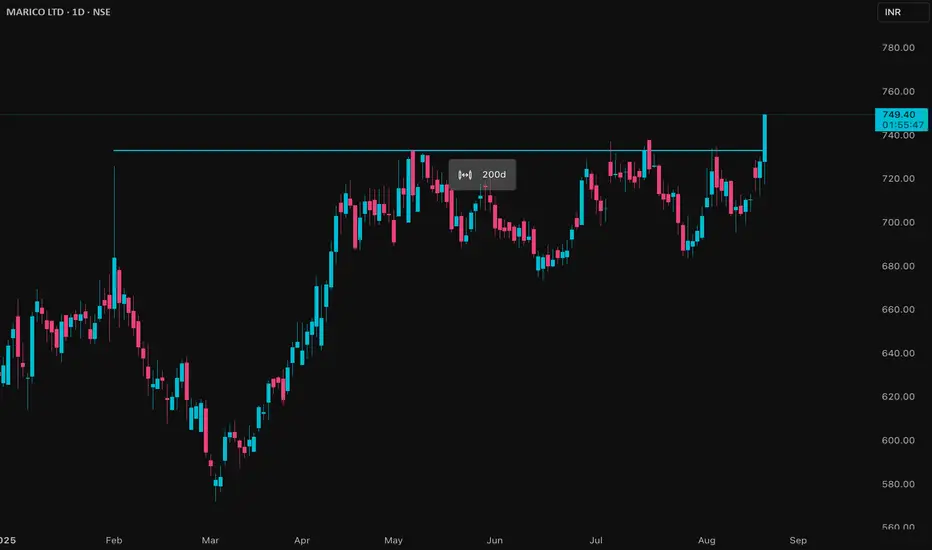
MARICO Price ActionMarico, as of August 2025, continues to showcase strong performance and consistent growth across its key financial metrics:
- **Revenue Growth:** Marico recorded ₹10,831 crore in annual revenue for FY25, an increase from ₹9,653 crore the previous year. June 2025 quarterly revenue was ₹3,259 crore, reflecting a sharp uptick from previous quarters.
- **Profitability:** Net profit for FY25 stands at ₹1,658 crore. The June 2025 quarter alone delivered a net profit of ₹513 crore, its highest in the recent five quarters. Earnings per share (EPS) have steadily risen to ₹12.59.
- **Margins and Return Ratios:** The company maintains healthy profit margins, with FY25 gross profit margin at 21.66%, operating margin at 20.02%, and net profit margin at 15.3%. Return ratios are robust, as seen in a return on net worth/equity of 40.99% and return on assets at 19.53%.
- **Balance Sheet Health:** Marico’s financial structure remains strong, with a debt-to-equity ratio of 0.10, indicating low leverage. The company also boasts a high interest coverage and strong cash flows from operating activities.
- **Segment Performance:** The food business continues to outperform with rapid growth, and premium personal care lines also show resilience. Domestic volume growth improved sequentially, driven by recovery in key brands and ongoing initiatives in pricing and innovation. International business delivered double-digit constant currency growth.
- **Shareholder Value:** The share price hit an all-time high of around ₹748, with a healthy dividend payout increasing to ₹10.5 per share in FY25.
- **Operational Efficiency:** Marico exhibits efficient working capital management, visible in its consistently high inventory and asset turnover ratios.
- **Outlook:** The company is optimistic about margin expansion in the coming quarters due to expected moderation in input costs. Its core categories are expected to sustain or accelerate volume growth, aided by premiumisation, innovation, and expansion in foods and personal care.
In summary, Marico is financially strong, profitable, and remains well-positioned for further growth, benefiting from a broad portfolio, strong brands, prudent financial management, and resilient demand both in India and internationally.
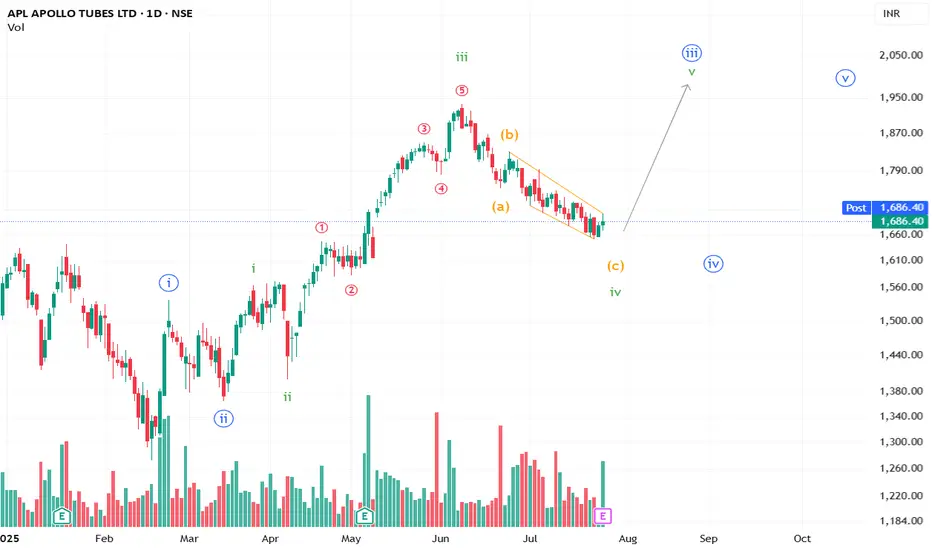
APL Apollo Tubes Limited Set to Surge?A well-formed ABC correction to the downside appears to be losing steam, and an upward move may take shape.
**This is an educational market outlook, not investment advice. Please consult a SEBI-registered advisor before taking any investment decisions.**
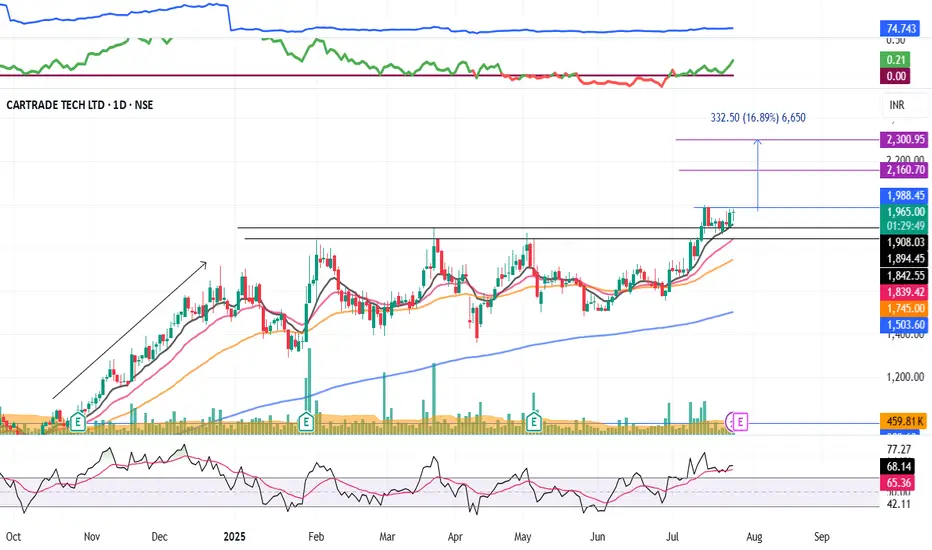
CARTRADE : Momentum pick#CARTRADE #swingtrade #momentumstock #breakoutstock #basingpattern
CARTRADE : Swing Trade
>> Good Base formation
>> Breakout + Retest done
>> Good Strength & Volume dried up
>> Trending setup
Swing Traders can lock profit at 10% and keep trailing
Pls boost, comment and follow us for more such analysis
Disc : Charts shared are for Learning purpose and not a Trade recommendation. consult a SEBI Registered Advisor before taking position in it.
Relaxo Footware looking interestingNSE:RELAXO
After a long consolidation for about 4 months, now the stock is trying to breakout.
Stock Volume and Delivery surged by 2.4 times and 3.4 times respectively indicating good interest.
Market cap of the footwear sector is increased by 1.2% in last trading session
RS crossing above zero indicates the outperformance
RSI going above 70 indicates great momentum
Closed above 100 DEMA. Next resistance is the 200 DEMA around 540.

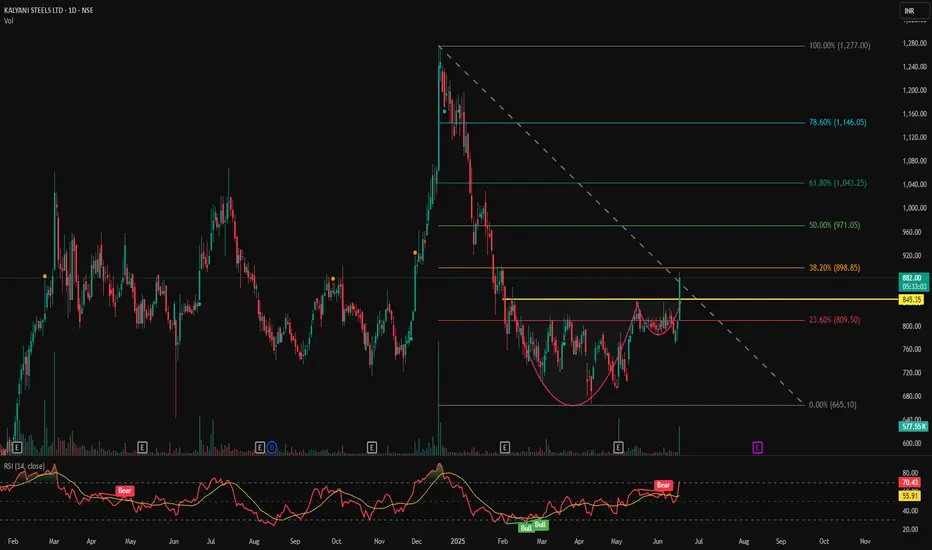
KSL - Strong Cup & Handle Breakout | Volume & RSI Confirmation📊 KALYANI STEELS LTD (KSL) – Strong Cup & Handle Breakout | Volume & RSI Confirmation | Daily Chart
📅 Chart Date: June 17, 2025
📈 CMP: ₹891.00 (+10.33%)
📍 Ticker: NSE:KSL
🔍 Technical Chart Breakdown
☕ Cup & Handle Pattern Breakout
KSL has decisively broken above the neckline resistance around ₹845 after forming a classic Cup & Handle pattern — a strong bullish continuation setup. This breakout has been accompanied by a solid volume spike (458.32K), which adds further confirmation.
💹 RSI Analysis
RSI is currently at 71.61, indicating strong bullish momentum.
RSI crossover confirms entry into the overbought zone, signaling strength but also requiring caution for late entries.
🕯️ Volume Action
Noticeable volume surge on the breakout candle suggests institutional participation.
Previous volume build-up near the handle zone indicates accumulation.
📍 Key Price Levels
✅ Breakout Zone: ₹845.35
🚀 Potential Upside Targets:
₹920 – Minor resistance
₹990–₹1,040 – Short to medium-term swing targets
₹1,150+ – Based on measured pattern height
🛡️ Support Zones:
₹845 – breakout retest level
₹800 – psychological support
₹765 – handle base and invalidation zone
🛠️ Trading Strategy Idea
Entry: Either breakout close above ₹845 or on retest of breakout zone
Stop Loss: Below ₹800
Targets: ₹920 → ₹1,000 → ₹1,150
Risk-Reward: >1:2 on first target with strong technical validation
ADANIGREENADANIGREEN has given resistance breakout with decent volume. Resistance on upper side is around 1250 and support is nr 980-90. Today traction in ADANI group has been observed and this may push fresh momentum in upcoming days. Keep it on radar

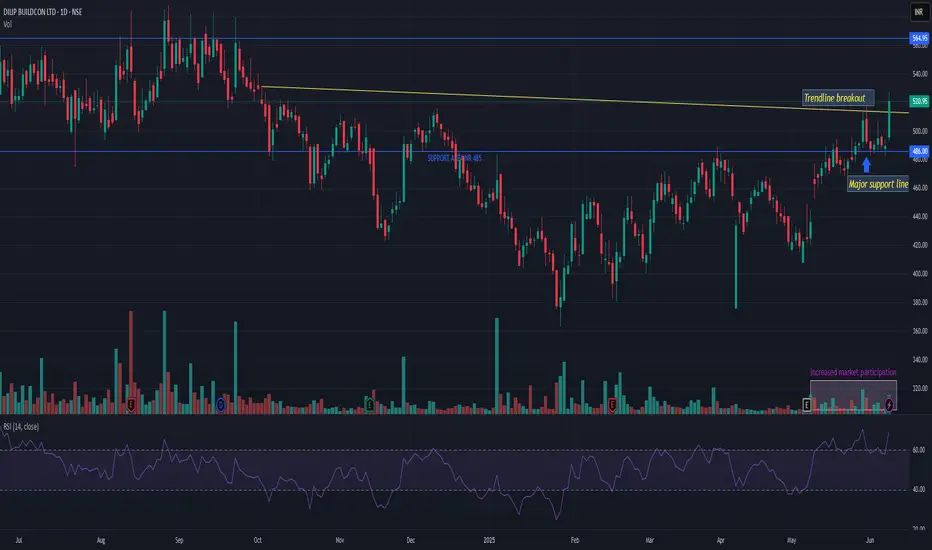
DBLDBL showing strength after so long. Now fresh volume may push it towards all time breakout. Near 560 level it may face resistance but if in case it successfully sustains above that then it has a potential to do wonder in span of 6-12 months. It can go up to 775 to ATH even. Fundamentally too showing good strength in recent quarters. All the factors are currently supporting. My view will be changed if it breaks 480 and closes below it. Track it closely.
ICICIGIICICIGI has given triangle breakout with very decent volume. In recent time traction in insurance sector has been observed. At current level 2000-10 there is resistance. But if it crosses and closes above this resistance level then it may do wonder! On lower side 1860 is very strong support. And upper end momentum can be played up to 2210 level. But strong upside play is possible only above 2010 closing

SAMHI HOTELS LTD - 1.5 Years consolidation BreakoutSAMHI HOTELS LTD
1) 1.5 Years of consolidation in a channel has been broken out from the long term channel's resistance.
2) The potential next resistance would be at the price 237.85 (Previous All Time High) & Move further if the momentum kicks in.

LLOYDSME - VCP BreakoutLLOYDSME
1) Time Frame - Daily.
2) A Volatility Contraction Pattern Breakout after a good consolidation.
3) The stock may find it's next resistance at the price 1478 (All Time High) & Move further if the momentum kicks in.
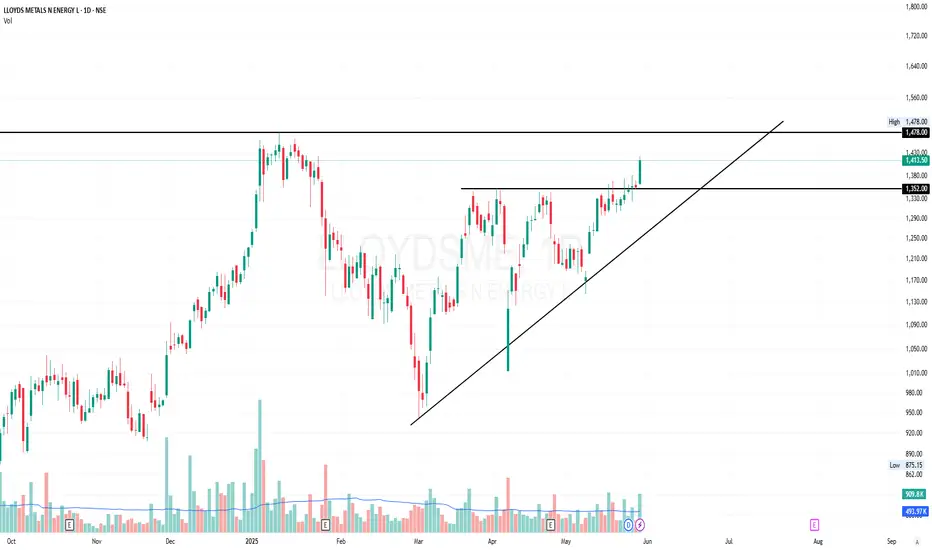
Long base setup A good long base consolidation and breakout and then price taking support at 21 EMA can be considered for swing with SL 1353
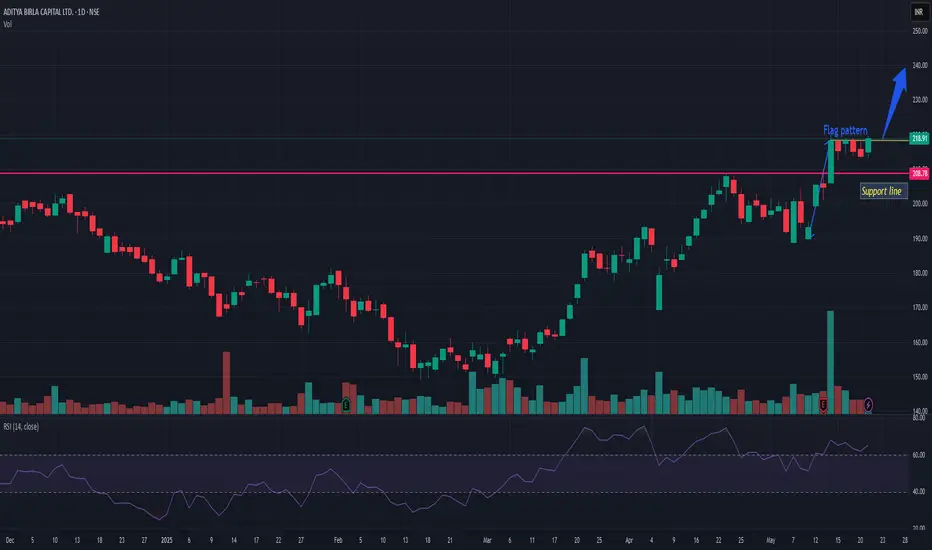
ABCAPITALABCAPITAL is getting stronger and giving short term flag pattern breakout. Only thing which is lacking is enough market participation. If it gets market participation than average then it can do wonders in short term. I would keep a closer look if it sustain above 220.
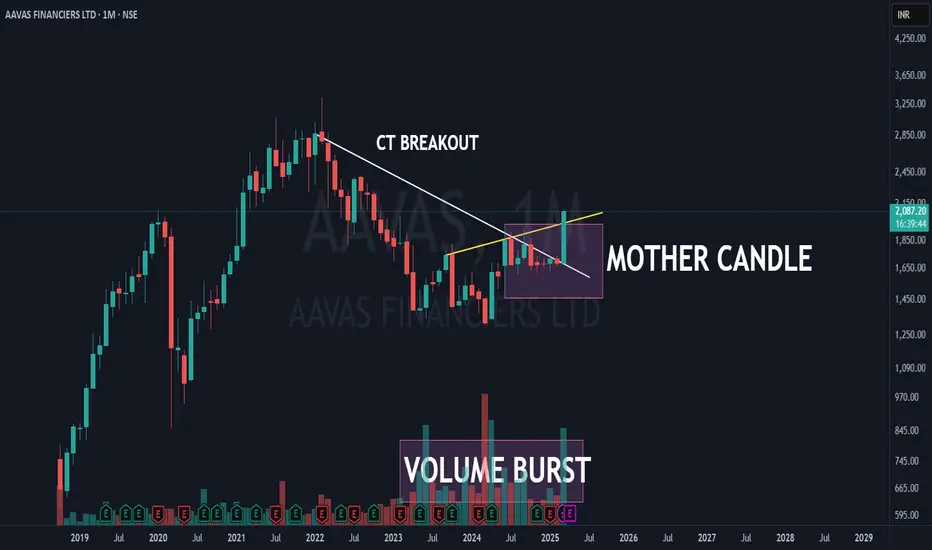
aavas financiers ltd | major monthly breakout! AAVAS is showing a strong bullish breakout on the monthly timeframe (MTF) with powerful confluence signals! Let’s break it down:
🔹 Counter Trendline (CT) Breakout ✅
Price has successfully broken the descending trendline, signaling a major trend shift.
🔹 Mother Candle Breakout ✅
The price has broken out of the mother candle's range, confirming strength.
🔹 Hidden Resistance Breach ✅
The yellow line marks a key resistance zone.
🔹 Volume Burst ✅
A significant volume spike confirms the breakout’s validity.
High participation = Strong conviction!
This is a highly bullish setup—will AAVAS continue its momentum? 📈👀
ALIVUS - Breakout in Daily timeframeALIVUS (Alivus Life Sciences Limited, formerly Glenmark Life Sciences) - Breakout
Breakout observed in daily timeframe of Alivus, the company has a very good chart pattern and is in a good uptrend and recently broke out with good volumes. The breakout has also been retested and sustained. There could be a good upside in this stock. The company also has good fundamentals as written below.
Fundamentals.
MCap 14,299Cr
Stock P/E 32.4
Industry P/E 31.6
ROCE 28.1%
ROE 21.1%
NPM 20.6%
PEG Ratio 1.69
Debt 16Cr
Reserves 2,514Cr
EPS 36.05
Promoter holding 75%
API contribution 9MFY24
Chronic : 69%
Acute : 31%
Key Therapeutic areas contribution 9MFY24
Diabetes : 4%
CVS : 41%
CNS : 17%
Pain Management : 6%
Others : 32%
Business segments
The company has two key segments - Generics and Complex APIs (92% of FY23 revenue) and Contract Development and Manufacturing Operations (CDMO) (8% of FY23 revenue)

VOLTAS a Flag under formation will it breakout ?
NSE:VOLTAS Ltd. is an interesting chart to keep on radar with following
1. RSI on all time frames above or almost at 60
2. Flag Pattern under formation at weekly chart
3. Price earlier was forming lower highs and lower lows; However after 16th December it started forming higher high and higher lows
4. ABCD pattern under formation on weekly chart
5. Weekly green candle on close of week with higher volume
6. Consumer Durable index is also forming similar bullish structure on charts
Will it breakout or continue its consolidation ?
Lets See How it Evolves.
Disclaimer: NOT A BUY / SELL RECOMMENDATION I am not an expert I just share interesting charts here for educational purpose and not to be taken as buy/sell recommendation. Please seek expert opinion before investing and trading as trading/ investing in market is subject to market risks. I do not hold any position in the stock as on date but I may look to take some position with my own Risk Reward matrix.

HEUBACHINDHEUBACHIND is trying to come out of long consolidation zone of almost a quarter with decent volume. Already above R-1 around 555 and trying to go above R-2 around 573. If successfully close above R-2 then there is v high probability that it can do wonder! Keep it in yr watchlist.

02 Jan 25 - Direct stance change from bearish to bullish---
Nifty Stance Bullish ⬆
In the last post mortem report, I did indicate the change of stance if Nifty goes above 24177. Nifty has a close of 24188 (weighted average) and 24167 (traded value) - so I cannot say with a 100% guarantee if we got a real close above 24177 or not. The 445 pts ~ 1.88% move today gives nifty a direct stance change from bearish to bullish (no neutral stance).
We are up 409pts ~ 1.72% of which 445pts came today, which also means that the stance was bearish till the 2nd of Jan 2025. What happened today is beyond comprehension, I am almost sure that none of the traders were ready for the move like this.
Nifty has moved 728pts intra week of which 445pts came today.
The USDINR chart is also relevant here, especially the mega move once we got a governor change. I think this is an inflection point and a weakening rupee (no firefighting by the RBI) is good for inflows.
Returning to the Nifty report, a fall below 23931 will shift my stance back to bearish so it is pretty important that Nifty holds the level today. If we continue to go up the crucial resistance levels would be 24348 and 24547. I hope we do not go above 24650 for the current expiry.
---
The change in regulations is hitting professional traders more than the entry level retail ones. SEBI's new set of rules was implemented to turn off the small traders and since most of them do the options buying, the impact is not that much. The professional traders on the other hand are really going crazy as the new margin requirements are not at all helping.
When you take out the professional traders from the equation, they would prefer to trade on forex, crypto or the US options than the Indian counterpart. It is just a matter of time before we see the intellectual migration to the mother market. The whine and the roar on X is proof that influencers have started talking about alternate trading options. Personally, I feel if most of them get access to a stable market - they would not hesitate to migrate.

Riding Momentum with Precision – CRISIL Up 24%!Momentum is the lifeblood of profitable trades. My strategy identifies high-momentum Stage 2 stocks that are ready to outperform, combined with a time-tested exit mechanism to cap drawdowns.
Take CRISIL , for example. Entry was triggered perfectly, and we’re already up 24%!
This is not about chasing every move in the market—it’s about betting on individual high-performance stocks that move irrespective of market conditions. The strategy thrives even in sideways markets because momentum is always king.
What You Get:
Simple buy/sell signals.
Automatic entries and exits with defined risk.
Focus on high-conviction stocks (max 10-stock portfolio).
