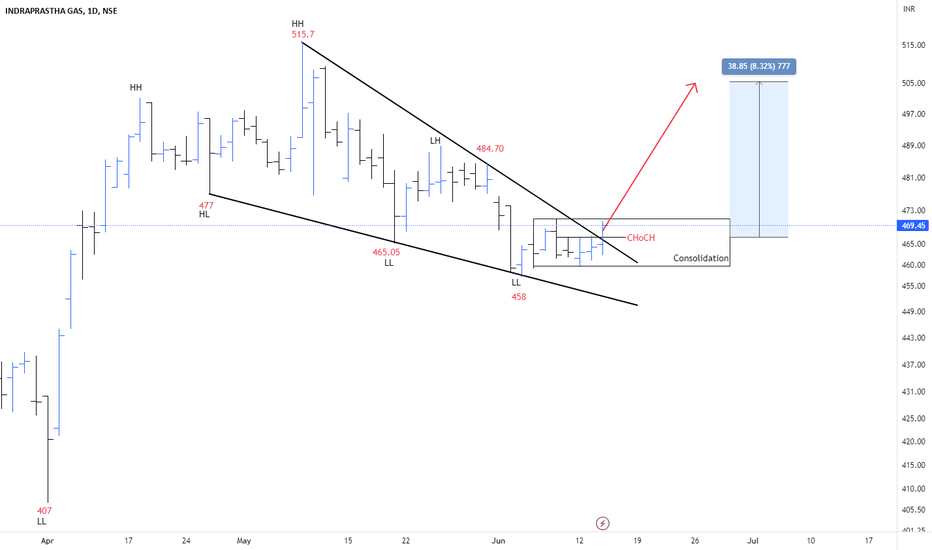
IGL: Bullish Falling Wedge Pattern IGL has constructed a falling wedge on the 1-day chart in which it has made continuous lower lows and lower highs.
The trend can change from bearish to bullish after the breakout of the resistance trendline. Buyers can expect a bullish move with the following targets: 483 & 504 . IGL Is Bearish below 458 .
Buyers have to break and stay above 504 to increase demand pressure.
Note: Do your own research / discuss it with your advisor
Moneydictators
Can We See A Bearish Trend In ASIANPAINTS?Hello traders,
It is a quick update about Asian paints. Security has made a downward channel. After the rectangle breakout, it made another rectangle pattern.
The 3033 level is an essential support level to keep an eye on. A breakout will intensify the bearish atmosphere. We can expect a new low based on the price action of the second rectangle pattern If support is breached. Bulls can't enter without a clear breakout of the downward channel. You will be notified when it reaches my level.
@Money_Dictators

