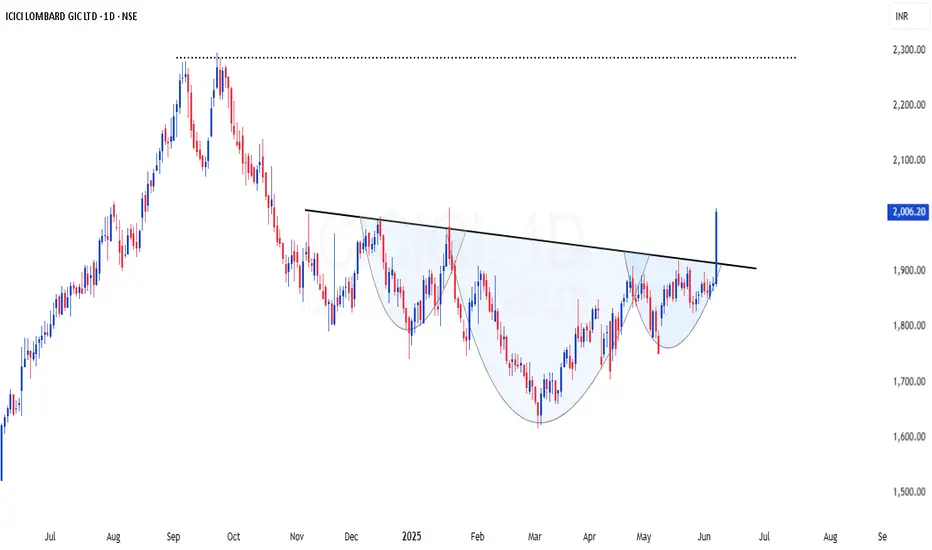
ICICIGI | High probable INHS setup - Looks good for 20-40%ICICIGI | High probable INHS setup - Looks good for 20-40%
CMP : 2006 (Dip : 1930)
SL : 1800
The stock has confirmed a classic inverted Head & Shoulders pattern on the daily chart, signaling a strong trend reversal.
✅ Breakout above neckline with decent volume, adding conviction to the move.
🎯 Immediate Target: 2300
🎯 Second Target (as per Fibonacci extension): 2700
📉 Pattern: Inverted H&S
📈 Volume: Supporting the breakout
📊 Bias: Bullish
This could be an excellent area of value for swing traders looking to ride the trend. A retest of the neckline could offer a second entry opportunity with a good risk-reward ratio.
Movingavarage
EXSIMHB - SIDEWAYS with potential UPSIDE BIAS ?EXSIMHB - CURRENT PRICE : RM0.340
In long term the uptrend is still intact as the share price is above 200-day EMA.
For short and medium term is in SIDEWAYS.
The stock had consolidated since JUNE 2024 (almost 8 months).
The nearest resistance for this stock is RM0.355. If the share price penetrates this level, it has potential of continue to move upside. As such, I considered this as a pending breakout stock.
ENTRY PRICE : RM0.360 - RM0.370
TARGET : RM0.400 , RM0.440 (52 Week High)
STOP LOSS : RM0.320
TAYOR !

Stock Analysis: #ZOMATO – The Ride Seems to Have Ended (For Now)Hello, Traders! 👋
#ZOMATO is showing signs of weakness after facing rejection at its all-time high (ATH). Here’s the technical breakdown:
📉 Technical Overview:
🔹 The stock is trading below its long-term 150-day EMA, a bearish signal.
🔹 Critical moving averages are sloping downward, further confirming the negative trend.
🔹 Rejection at ATH suggests the bullish momentum has paused or reversed for the time being.
💡 My View:
I was holding this stock, but given the current setup, it seems the ride has ended for now. I’ll be watching for stabilization or signs of a reversal before reconsidering any position.
⚠️ Disclaimer:
🔹 I am not a SEBI-registered advisor.
🔹 This analysis reflects my personal views and is not a recommendation to buy or sell.
🔹 Shared for learning purposes only—please do your own research or consult a professional.
What’s your take on #ZOMATO? Let’s discuss!
#TradingView #StockAnalysis #MomentumTrading #ZOMATO

Ascending Parallel channel in JSW NSE:JINDALSAW An ascending parallel channel has been formed in weekly & daily channels out of which a current daily bullish candle confirms the reversal of the falling stocks
A confirmed buying can be when it crosses the parallel channel at 310 or risk-takers can accumulate at current levels.
Another bullish signal is the crossing of the EMA 200

BEL Trying for a Reversal NSE:BEL is Trying to make a Reversal on the Daily Chart with today's heavy inflow as it's now gonna be part of the Nifty 50 which will attract more passive funds chasing it, although a breakaway gap is yet to be filled below the accumulation zone let's see if bulls can defend it a close above 315-317 Levels will confirm that they defended it and further upside can be seen.
Check out my other stock ideas below until this trade gets activated, I would love your feedback.
Disclaimer: This analysis is intended solely for informational and educational purposes and should not be interpreted as financial advice. It is advisable to consult a qualified financial advisor or conduct thorough research before making investment decisions.

Aditya Birla Capital (ABCapital), one simple line setup-Posted great growth results 🚀
-overall sector strong
-Young stock, came out from long base breakout
-Tightness on daily n weekly timeframe too. (3WTC)
-Good shakeout (50 ema)
-Volumes good too

Electrosteel Castings another water theme related stockElectrosteel Castings (Electcast)
-from Strong Sector
-Clean setup
-Vol kickin in, clearly Grenn vol > Red vol
-Signal candle
-Good shakeout

PRECWIRE - 9 Months Consolidation Breakout / All Time HighPrecision Wires India Ltd
1) Time Frame - Weekly.
2) The Stock has been Consolidating since (September, 2023). Now It has given a Consolidation breakout & Closed at it's Life Time High with good volume & good bullish momentum candle in weekly Time Frame.
3) The stock may find it's next resistance around the price (200 - 26.45% from the price 158.16).
4) Recommendation - Strong Buy.

BSE, will it breach this AVWAP?Lets learn new thing:
AVWAP (stands for Anchored Volume Weighted Average Price): the average Price of a stock weighted by Volume from an Anchored point (swing low or swing high are good anchor points). Think like moving average but volume also include (not entirely true but to keep easy you can think like that) so it become more powerful as it involves both price and volume.
Now come to BSE, check white AVWAP how it was major resistance and gave fake breakout too. But when it breaches, it gave good Breakout (BO).
Again new blue AVWAP acting as good resistance, now have to check how it acted when it breach this line.
If it will give good breakout, add this powerful tool to your charts.
To learn more about this tool, DM me.
No sell/buy recommendations

Crude Oil buyers brace for a bumpy road ahead, focus on $79.50WTI Crude Oil picks up bids to reverse the previous day’s retreat from a seven-week-old falling resistance line, close to $78.65 by the press time. In doing so, the black gold recovers from a 50% Fibonacci retracement of December 2023 to April 2024 upside, near $77.70. Given the bullish MACD signals and upbeat RSI conditions underpinning the commodity’s rebound, the buyers are likely to overcome the immediate trend line resistance surrounding $78.65. However, a convergence of the 100-SMA and the 200-SMA, around $79.50 at the latest, appears a tough nut to crack for the energy bulls. Also acting as an upside filter are the $80.00 threshold and late May swing high of $80.60. It should be noted, however, that the quote’s successful trading past $80.60 enables the optimists to aim for the support-turned-resistance line stretched from late 2023, near $83.50 as we write.
On the contrary, a daily closing beneath the 50% Fibonacci ratio of $77.70 could quickly fetch the WTI crude oil prices to the previous monthly low of around $76.20. If the black gold remains bearish past $76.20, the monthly bottom of around $72.40 and the $70.00 psychological magnet will lure the sellers. It’s worth observing that the energy benchmark’s sustained weakness past $70.00 could make it vulnerable to a slump toward the previous yearly low of around $63.60.
Overall, WTI Crude Oil appears all set to post the biggest weekly gain since early April but a daily closing past $79.50 will be crucial for bulls to retake control.

NIFTY DAILY - 5/6/2024Nifty opens gap up and bulls were struggle to survive into the markets and made days low 21791 level.
Afterwards bulls came back into action and made days high which is 22670 with 735 points up which is almost 3.36% up.
Nifty has formed a big bullish candle on daily chart with long lower shadow which indicates participants were buying from day’s low.
Candle is trading below 19 Days Moving Average Line.
Further levels for nifty can be 22794 level which is resistance and support will be 22400 level.
Bank Nifty levels
Support – 48568
Resistance – 49334
Today’s Advance Decline ratio of NIFTY50
Advance - 48
Decline - 2
FII Sell – 5656.26 crores
DII Buy + 4555.08 crores.
⚠️ Important: Always maintain your Risk & Reward Ratio.
✅Like and follow to never miss a new idea!✅
Disclaimer: I am not SEBI Registered Advisor. My posts are purely for training and educational purposes.
Eat🍜 Sleep😴 TradingView📈 Repeat 🔁
Happy learning with trading. Cheers!🥂

NIFTY DAILY - 30/5/2024Fifth winning streak of bears with huge gap down.
Bears were aggressive from starting of the day and made day’s low which is 22417 level with almost 270 points.
Nifty has formed big body bearish candle with upper and lower shadow on daily chart.
Candle is trading below 9 Days Simple Moving Average line on daily chart.
22313 will work as support level with resistance of 22586 level.
Bank Nifty levels
Support – 48276
Resistance – 48832
Today’s Advance Decline ratio of NIFTY50
Advance - 10
Decline - 40
FII Sell – 3050.15 crores
DII Buy + 3432.92 crores.
⚠️ Important: Always maintain your Risk & Reward Ratio.
✅Like and follow to never miss a new idea!✅
Disclaimer: I am not SEBI Registered Advisor. My posts are purely for training and educational purposes.
Eat🍜 Sleep😴 TradingView📈 Repeat 🔁
Happy learning with trading. Cheers!🥂

Descending Triangle Pattern formation in IGL These two patterns indicate a new strong trend is about to begin.
Keep this stock in watchlist.
Disclaimer: This is my pre market analysis and my trading journal. Not a suggestion to buy or sell.

ITC, Weekly Review | Trend Positive | Strength MediumThe nature and degree of separation in both bands indicates the price could resume its uptrend. On the upside the range of 10% could be tested. And on the down side the range is 9%. For a positional trade the level of 416 can be used as a stop loss and for target the level is 480.
Disclaimer: This is my pre market analysis and my trading journal. Not a suggestion to buy or sell.

NIFTY DAILY - 15/5/2024Nifty opens gap up and mad days high which is 22297 level but didn’t survive upper level and bear drag the nifty down to the 22151 points, after that index was in a consolidation and gave flat to bearish closing which is -17 points.
Index has formed red body candle with upper and lower shadow.
Candle is crossing 9 Days Moving Average Line on daily chart.
Nifty is able to hold 22200 level so, further resistance can be 22273 with support of 22166 level.
Bank Nifty levels
Support – 47305 Resistance – 48110
Today’s Advance Decline ratio of NIFTY50
Advance - 23
Decline - 27
FII Sell – 2832.83 crores
DII Buy + 3788.38 crores.
⚠️ Important: Always maintain your Risk & Reward Ratio.
✅Like and follow to never miss a new idea!✅
Disclaimer: I am not SEBI Registered Advisor. My posts are purely for training and educational purposes.
Eat🍜 Sleep😴 TradingView📈 Repeat 🔁
Happy learning with trading. Cheers!🥂

NIFTY DAILY - 28/3/2024Another gap up opening of Index and highly volatile session, Index has made days high that is 22516 level, there was profit booking in last hours of trading.
Third green body shaven bottom candle is formed on daily chart, which indicates todays open and low are same and buyers were buying from starting of the day.
Formation of last three candles are higher highs higher lows.
MACD is on an urge of Crossover. Candle is above 9 days Moving Average line on daily chart.
Today’s closing was below 22381 level so this will work as resistance with support of 22145 level.
Today’s Advance Decline ratio of NIFTY50
Advance - 45
Decline - 5
FII Buy + 188.31 crore
DII Buy + 2619.52 crore.
⚠️ Important: Always maintain your Risk & Reward Ratio.
✅Like and follow to never miss a new idea!✅
Disclaimer: I am not SEBI Registered Advisor. My posts are purely for training and educational purposes.
Eat🍜 Sleep😴 TradingView📈 Repeat 🔁
Happy learning with trading. Cheers!🥂

NIFTY DAILY - 22/3/2024Second winning strike of bulls and took control over market and made days high that is 22180 level.
Nifty has formed big green body candle with upper and lower shadow.
Candle is taking support of 50 days Moving Average line.
Nifty is able to hold above on 22000 level so that next hurdle level can be 22115 and weakness could be seen towards 21831 level.
Today’s Advance Decline ratio of NIFTY50
Advance - 38
Decline - 12
FII Sell – 3309.76 crore
DII Buy + 3764.87 crore.
⚠️ Important: Always maintain your Risk & Reward Ratio.
✅Like and follow to never miss a new idea!✅
Disclaimer: I am not SEBI Registered Advisor. My posts are purely for training and educational purposes.
Eat🍜 Sleep😴 TradingView📈 Repeat 🔁
Happy learning with trading. Cheers!🥂

NIFTY DAILY - 21/3/2024Gap up opening of Nifty with Positive note and made days high that is 22080.
Into second half bears were back into action and took Nifty down to the low of the day that is 21941 level.
Index has formed small green body candle with upper and lower shadows.
Nifty has taken support of 50 days Simple Moving Average line on daily chart.
Nifty is able to hold above on 22000 level so that next hurdle level can be 22115 and weakness could be seen towards 21831 level.
Today’s Advance Decline ratio of NIFTY50
Advance - 40
Decline - 10
FII Sell – 1826.97 crore
DII Buy + 3208.87 crore.
⚠️ Important: Always maintain your Risk & Reward Ratio.
✅Like and follow to never miss a new idea!✅
Disclaimer: I am not SEBI Registered Advisor. My posts are purely for training and educational purposes.
Eat🍜 Sleep😴 TradingView📈 Repeat 🔁
Happy learning with trading. Cheers!🥂

ALKYLAMINE Falling Wedge BreakoutAlkyl Amines breaks out from Falling Wedge Pattern with higher volumes. It is trading above its 200EMA and other key moving averages.

Resistance Trendline Breakout : MPHASISIn Mphasis, there is a resistance trendline broken so good candidate for opening a long position.
PFB the key levels
EN - 2427, TP - 2552, SL - 2326

Weekly Chart Breakout in BPCL @398.00Breakout in BPCL @398.00 Weekly Chart basis.
:: Data Point ::
Breakout Level: @398.00
1st Target: @420.00
2nd Target: @470.00
Stoploss Level: @372.00
Note: BPCL traded above 200 EMA as well as Good Volume showing its Breakout poteintiality.

ABFRL BULLISH TRENDThe Stock in Breakout Range and Strong closed above MA 200
Expected Target 275
Educational Purpose Only
