ATH Resistance to Support in NETWEB3000 level has been acting as resistance in 2024. Later it was broken in 2025 and now we see retest of the same level.
There is good buying interest seen at this level making it Low risk entry.
Also this support is near weekly 20sma which makes it high probability trade.
SL targets on chart. Note that holding time can be 8 to 20 weeks.
Moving Averages

Maruti Suzuki - A Solid OpportunityMaruti Suzuki has entered into short term bearish mode.
It is down nearly 7% from the top in last 2 weeks, confirming a strong downside momentum.
Structure: Playing Wave C, of 4 in short term.
Trend: Bearish
Also a clear divergence in RSI indicator at the top
Trade Setup: Short
Target: 15270/-
StopLoss: 16500/-
Notes
This is a classic Elliot wave pattern. Wave C generally moves fast.
⚠️ Disclaimer: Not financial advice. Manage risk properly.

NIFTY Faces Pressure: Can 24,300 Hold?NIFTY has turned weak after falling around 2.5% on the weekly chart. The index has made a double top near 26,250, which usually means the market is finding it hard to move higher from that area.
On the weekly chart, the candles look bearish. NIFTY is currently holding near an important support around 25,000 (50 EMA). If this level breaks, the market may move lower towards 24,300 and even 23,900.
On the daily chart, NIFTY is trading below all major moving averages (20, 50, 100 & 200 EMA). In the past, whenever NIFTY stayed below these averages, it usually corrected further. Right now, there is no strong support before 24,600.
On the monthly chart, a double top is visible again, showing weakness at higher levels. However, there is decent support near 24,300–24,240, which is also close to the monthly 20 EMA.
Momentum is also weakening. RSI is showing bearish divergence on weekly and monthly charts, which suggests upside strength is fading.
Resistance Levels :- 25,200 – 25,300, 25,500, 26,250
Support Levels :- 24,987, 24,600, 24,300 – 24,240, 23,900
Overall View
As long as NIFTY stays below 25,500, the trend remains weak. Market direction will become clearer near the 24,300 support zone.

Evaluating Trend and Momentum Alignment with EMA & RSI🔎 Intro / Overview
This idea presents an EMA + RSI Alignment Framework designed to help traders understand market conditions rather than chase price movements.
Often, traders feel they have “missed the move”.
In most cases, this happens not because of late entries, but because market context was not clearly defined beforehand.
This framework focuses on evaluating trend direction and momentum quality first, so traders can better understand when conditions were supportive, unclear, or weakening.
⸻
📔 Concept
Indicators are frequently misused when applied in isolation.
This framework assigns clear and specific roles to each tool:
• EMA defines trend bias, not support or resistance.
• RSI measures momentum quality, not overbought or oversold levels.
A market environment is considered valid only when EMA and RSI are aligned.
When alignment is missing, price movement alone is treated as low-quality information.
This shifts focus away from prediction and toward environment assessment.
⸻
📌 How to Use
The framework is applied through three structured steps:
1. Identify Trend Bias (EMA)
• Price holding above EMA → bullish environment
• Price holding below EMA → bearish environment
• Price frequently crossing EMA → unstable environment
2. Assess Momentum Quality (RSI)
• RSI holding above 40 → supportive bullish momentum
• RSI holding below 60 → supportive bearish momentum
• RSI fluctuating around 50 → momentum instability
3. Confirm Alignment
• EMA + RSI aligned → valid market environment
• EMA + RSI misaligned → low-quality environment
This framework is used strictly for evaluation and learning, not execution.
⸻
📊 Chart Explanation
• Bullish Alignment Zone
Price holds above EMA while RSI confirms stable bullish momentum.
• No Alignment Zone
EMA flattens and RSI becomes unstable, indicating a low-quality environment.
• Bearish Alignment Zone
Price holds below EMA while RSI confirms bearish momentum.
The RSI panel is used only for confirmation, never for signal generation.
⸻
👀 Observation
Many traders feel they missed a move only after alignment has already occurred.
This framework helps visualize:
• When alignment was present
• When conditions became unclear
• When momentum weakened
Understanding this sequence helps traders learn from price behavior instead of reacting emotionally to it.
⸻
❗ Why It Matters?
Market movement alone does not equal opportunity.
By learning to recognize alignment vs misalignment, traders can:
• Avoid chasing price after moves are over
• Stay out of choppy or unstable conditions
• Build patience and contextual awareness
Context is often the difference between consistency and frustration.
⸻
🎯 Conclusion
The EMA + RSI Alignment Framework is a context-first approach to understanding market behavior.
It does not attempt to forecast future price moves.
Instead, it explains why certain environments supported movement and why others did not.
This makes it a valuable educational tool for developing disciplined, structured market understanding.
⸻
⚠️ Disclaimer
📘 For educational purposes only.
🙅 Not SEBI registered.
❌ Not a buy/sell recommendation.
🧠 Purely a learning resource.
📊 Not financial advice.

Bccl on 1 hr tf 21 janBharat coke on 1 hr, time frame.
Though has broken listing day low and it is not in FNO so we can not short.
Looking for long position here.
Once it breaks the draw line above 40.75 it can give 5-7% move towards 43.
Let's wait and watch.

LTIM — Corrective Rally Exhaustion, 3-Wave Decline in FocusThe advance in LTI Mindtree Ltd (LTIM) from 3,802 is interpreted as a corrective ABC structure , rather than the start of a fresh impulsive trend.
Wave A advanced to 5,554.50
Wave B corrected lower within a falling channel , ending near 4,939.50
Wave C unfolded in five waves and terminated at 6,429.50, accompanied by bearish RSI divergence , signaling momentum exhaustion
Price has now closed below the 50-DMA , indicating weakening bullish momentum. However, Wave (a) is still evolving , and its completion needs to be confirmed through price action.
A probable corrective path ahead:
Completion of Wave (a) on the downside
A Wave (b) bounce potentially initiating from the 100-DMA , if price stabilizes near that zone
Followed by a Wave (c) continuation lower , with downside risk toward the 5,555 zone
As always, price action will dictate the structure , and the wave count will be updated as the move evolves .
Disclaimer: This analysis is for educational purposes only and does not constitute investment advice. Please do your own research (DYOR) before making any trading decisions.

Cdsl breakdown 20 jan, support at 1248 and 1040#cdsl
Brutal downfall seen on charts and level of support at 1248 and 1050.
Hope this level will see a huge support and spike.

Nifty at 200 dema and at make and break level 20 janNifty broke the previous support and fallen down again.
Now it also touched 200 dema, looking at global factors it can breach further and seek support at 25049.
If that is broken too then no mercy...
#nifty

Bccl ipo day high 45 is next level of rally Today bccl made a debut and gave nearabout 90-100% of returns to there lucky investors.
Stock price made a high of 45 and then shown profit booking towards 40 rs level.
Now 45 is a good resistance, once that is taken out we may see more upside.
But looking at today's move after listing more profit booking and consolidation is anticipated.
Also looking at fundamentals stock is now trading near to 8-9 pe multiple which is close to it's parent coal India so doubling and all is not expected.
#BCCL

L&T: Wave 5 Exhaustion Signals a Corrective PhaseA clear 5-wave impulse has played out, with Wave 3 showing classic overbought RSI behavior while still respecting Elliott Wave rules.
Wave 5 ended with RSI divergence , signaling exhaustion near the highs.
Price has now slipped below the 100-DMA , reinforcing the view that the advance has likely stalled and a corrective phase is underway. The decline should unfold in at least a 3-wave structure . Importantly, Wave (a) may not be complete yet . Despite RSI reaching oversold levels, there is no decisive reversal signal so far. Any near-term bounce could turn out to be a dead-cat bounce , potentially forming Wave (b) rather than a trend reversal.
The previous accumulation zone , which also aligns with the 50% Fibonacci retracement , remains a key area to monitor. Until the corrective structure is fully resolved, bounces are best treated as counter-trend moves , not fresh longs.
Disclaimer: This analysis is for educational purposes only and does not constitute investment advice. Please do your own research (DYOR) before making any trading decisions

Nifty analysis 19 jan on 4 hr time frame#nifty
As plotted in charts nifty can give a breakout and breakdown on break of respective support and resistance.
Either side a rally of 440 point is anticipated.
This can be played with a adeqaute sl via etf or options or fut as per risk capacity...

NaturalGas ShortGo with short as Natural Gas conditions are not favor to it. Check the entry and exit point for the NatGas.
It's just our analysis we're not responsible for your losses or gains. you must do strong analysis.

CAMS - Descending triangle + Head and Shoulders PatternA clear Head and Shoulders structure has formed over the recent months. The price has just breached the neckline support (horizontal dotted teal line) around the ₹720–₹730 zone.
The recent price action shows a breakdown below the neckline with a red candle, suggesting that the bearish momentum is gaining traction.
Also stock is trading below 200 EMA, which is a strong downward movement signal.
Traders should watch for a potential "retest" of the neckline before the continuation of the downward move.
Target: 630/-

SILVER Triangle BreakoutSilver has given a breakout after forming a triangle pattern on 1h & 4h timeframe. Silver is also trading above 200 EMA on both the timeframes.

Dr reddy short idea
Short Trade Setup Description
This setup is based on a clean break of the prior pivot low around the level ₹1,246.61, confirming bearish momentum. Defined short entry zone just below ₹1,241.09, aligning with a weekly supply zone from the higher timeframe.
The zone confluences with a weekly 50 EMA also.
• 🔻 Entry: Short on retracement into the supply zone
• 🛡️ Stop Loss: Above the zone with a buffer of 15% DATR
• 🎯 Target: 1:3 Risk-Reward, aiming toward the ₹1,200 region
• ⚠️ Caution: Profit booking advised near the weekly demand zone and the orange-shaded caution area
This trade respects multi-timeframe confluence and risk management principles.

Market View & Trade PlanBased on current structure, NIFTY is trading inside a rising channel on both 5-minute and 15-minute timeframes, with short-term price action forming a potential bullish cup-and-handle pattern on the 5-minute chart. Momentum indicators and price behavior suggest a bias toward the upside as long as the index holds above the channel support zone. A buy-on-breakout can be considered above 26,175–26,185, with an initial stop loss below 26,110 (below the handle low and channel support). On confirmation, the upside potential lies toward 26,240 / 26,300, while a failure to hold the channel could open a downside move back toward 26,080–26,040.
Risk Note & Probability View
The bullish scenario remains valid only if price sustains above VWAP and the short-term EMA cluster; rejection from the upper channel or a breakdown below support will invalidate the setup and shift the bias to neutral-to-bearish. This is a probability-based trade, not a prediction — execution discipline and risk control matter more than direction.
Disclaimer: I am not a SEBI-registered research analyst. This view is for educational and informational purposes only and should not be considered investment advice. Please consult a qualified financial advisor before taking any trade decisions.

Coforge bearish viewWith Coforge on a downtrend and a 21/50 DEMA cross over confirming the same, a retracement to the supply zone formed on 1765 levels can be a opportunity for short trade.
The zone forming on a 21/ and 50 DEMA, adds added advantage for the short idea

Voltas Bullish viewThe 3% move created by Voltas, has changed the trend of the stock.
The demand zone at 1390 level and a trap zone at 1365 levels considered can be a bullish opportunity with the stock beginning to make up-move and at low range on higher time frame.
The move created has broken a prior pivot too.
Also the demand zone created lies on an area of 21 and 50 DEMA.

Torrent Power Ltd Bullish viewTorrent Power has created a 5%+ move followed by change in trend.
The stock has closed above EMA21/50 marking it as a bullish sign.
With such change in trend there can be 2 scenarios which can exist.
Scenarios1: The stock retraces to the demand zome formed at 1318 levels. In such a retracement going long would be a opportunity.
Scenario 2: A small daily inside candle if formed on the daily ( inside candle meaning a smaller range candle which has a high low with the range of previous candle), can be an opportunity for break out.

LTIMThis analysis is for educational purposes only. LTIMindtree (LTIM) stock trades within a defined channel, recently finding support at the lower boundary and reversing upward, now positioned above key moving averages including the 50-150-200. It also holds above the channel's support level, signaling a bullish trend with potential for further upside; always use a stop-loss to mitigate risk

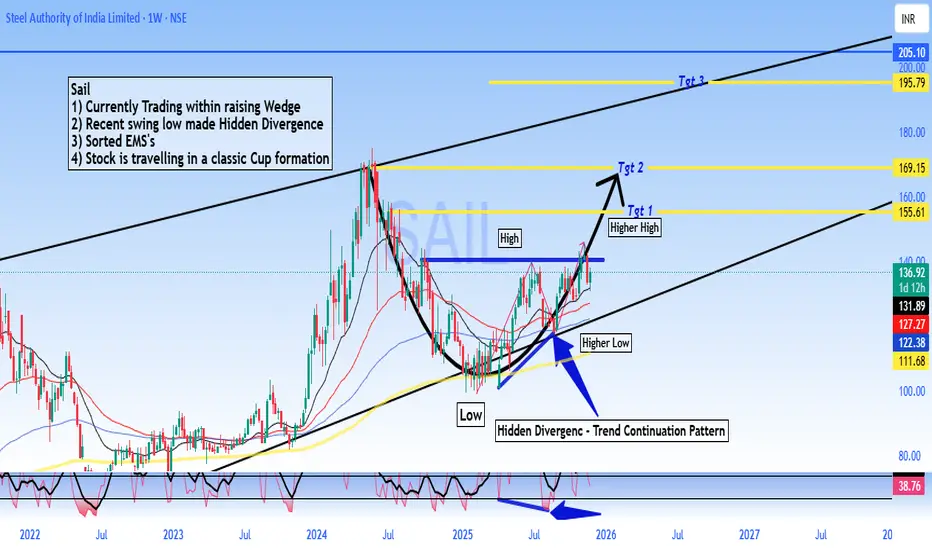
SAIL - Buy - Technical Analysis# Steel Authority of India Limited (SAIL) - Technical Analysis Report
Current Price: 136.92
Timeframe: Weekly Chart Analysis
Technical Setup Overview
SAIL is presenting a compelling technical picture with multiple bullish indicators aligning for a potential significant upward move. The stock is currently trading within a well-defined rising wedge pattern and has recently formed a **Hidden Divergence** on the weekly chart - a classic trend continuation signal.
Key Technical Observations
Rising Wedge Pattern:
The stock is trading within a rising wedge formation, which typically indicates consolidation before a breakout. The current price action suggests the stock is in the later stages of this pattern.
Hidden Divergence - Bullish Continuation Signal:
A **Hidden Divergence** has formed on the weekly timeframe.
- This pattern typically signals trend continuation and suggests the uptrend is likely to resume with strength
Sorted EMA Structure:
The Exponential Moving Averages are properly aligned, indicating a healthy bullish trend structure with multiple moving averages providing dynamic support.
Cup Formation in Progress:
The stock appears to be carving out a **classic Cup pattern**, which is a well-known bullish continuation formation. This pattern suggests accumulation and potential for a significant breakout move.
Price Targets & Projections
Based on the technical structure, here are the potential price targets:
Target 1: 155.61 (Higher High breakout level)
Target 2: 169.15
Target 3: 195.79
These targets are derived from the pattern structure and represent key resistance zones where profit-taking may occur.
Trading Strategy Considerations
For Swing Traders:
- Current levels offer a potential entry opportunity for medium to long-term positions
- A move above ₹140 could confirm the continuation pattern
- Stop loss can be placed below the recent higher low at 122 for risk management
Risk Factors to Monitor
- Failure to hold above ₹122 would invalidate the bullish hidden divergence
- Breakdown below the rising wedge support would change the outlook
- Sector performance and broader market conditions should be monitored
- Steel industry fundamentals and commodity price trends
🔔 Conclusion
SAIL is exhibiting strong technical characteristics with the Hidden Divergence pattern, sorted EMA structure, and cup formation all pointing toward potential upside. The current price action within the rising wedge presents an interesting risk-reward setup for traders and investors with appropriate risk management.
DISCLAIMER
This analysis is for educational and informational purposes only and should NOT be considered as investment advice or a recommendation to buy, sell, or hold any securities. - I am not a SEBI registered analyst or investment advisor - This is purely a technical analysis based on chart patterns and indicators - Past performance and technical patterns do not guarantee future results - Trading and investing in stocks involves substantial risk of loss - Always conduct your own research and due diligence before making any investment decisions - Consult with a qualified financial advisor before taking any investment positions - The author holds no responsibility for any profits or losses incurred based on this analysis - Risk management and position sizing are crucial - never invest more than you can afford to lose
**Trade/Invest at your own risk. Do your own analysis.**
#SAIL #SteelAuthorityOfIndia #StockMarket #TechnicalAnalysis #NSE #IndianStocks #ChartAnalysis #TradingView #StockTrading #HiddenDivergence #CupPattern #PriceAction #SwingTrading #Investing #MarketAnalysis #SteelSector #Commodities #TradingStrategy #ChartPatterns #TechnicalIndicators
NMDC Positional Trading IdeaParallel channel:
The asset is currently trading within a defined parallel channel .
Selling pressure at resistance:
A high-volume bearish engulfing candle has formed at the channel's upper boundary, indicating significant selling pressure.
Two potential setups:
Price action is being monitored for two distinct trading opportunities.
Long entry:
A decisive breakout and close above the 84 price level would trigger a long position entry
Retracement opportunity:
Alternatively, a retracement to the 78 price level is being anticipated
High-probability buy zone:
The 78 level offers confluence with the 20-period Exponential Moving Average (EMA) on the daily timeframe, creating a high-probability buy zone

Solana Technical Reversal: MA Compression Resolves to the UpsideSolana is trading around 126 levels and there is a support which is being respected around 125 levels.
For last few weeks, no considerate candle is there. Only doji are being formed which shows the sideways moment in the charts.
If the market cycle changes, turning bullish, an entry can be made above 127 levels expecting a 10-11% movement in the crypto.
Major trend is bearish, Minor trend sideways.
The major support is around 100-110 level zone and there is not much of fall to capture as it has fallen 50% since Sept 2025.
On the hourly charts, there is a liquidity grab, taking out the bullish positions created on previous occassions.
A moving averages gate is also being created on the hourly charts as all the four EMAs (20, 50, 100 & 200) are moving in small range.
Now as per my view the market is trading in a range and it is also respecting a falling resistance line. A good R:R trade is there on the bullish side.
As per the plan, bullish position can be created in the assest once it crosses 127 levels.
Stop Loss :- 122.5
Target :- 144
R:R = 1:4
Multiple confluence there to enter the trade on the bullish side. Wait for the price action near the levels before entering the trade.
