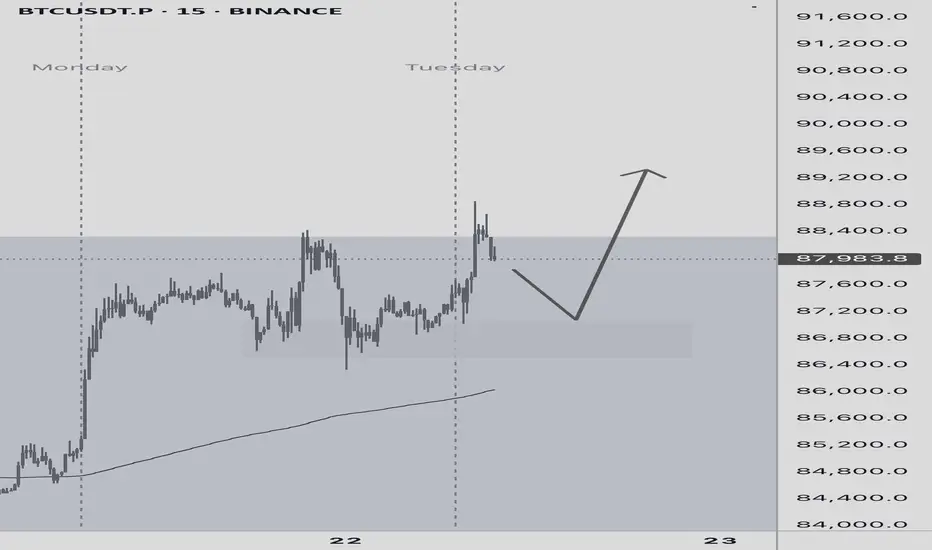
BTC on the 15-minute chart looks beautiful this Monday, doesn’t ✅ BTC on the 15-minute chart looks beautiful this Monday, doesn’t it guys?
Let’s watch for a pullback to the 87k zone — if there’s a rejection candle, smash that Long and ride it up!
Moving Averages
TVSMOTORS RANGE BREAKOUTTVSMotors breaking a range weely basis
with good volume last few weeks
bullish rsi,trading above all key ema
after 2750 may reach to 2950
NO BUY/SELL RECOMENDATION

ICICIBANK RANGE BREAKOUT WEEKLYICICIBank breaking a range weekly basis
with good volume building last few weeks
trading at new ATH,RSI bullish
trading above all key ema
sizzling q4 result
#niftybank trading at ATH
NEAR #target 1470
EDUCATIONAL IDEA

HDFCBANK RESISTANCE TRENDLINE BREAKOUTHdfcbank breaking #resistance trendline weekly basis
good volume building up last few week
trading at new ATH,RSI bullish
trading above all key ema
#q4results are good
#niftybank trading at ATH
soon can touch #target 2000

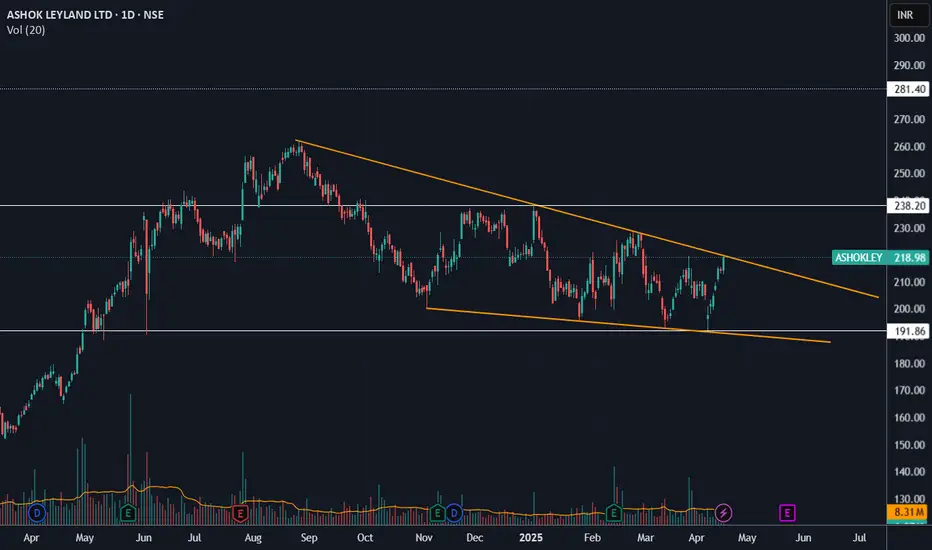
ASHOK LEYLAND perfect watchlist scriptFor the last nine months, Ashok Leyland has developed a falling wedge pattern. With the stock currently testing the upper trendline, a close above it would likely confirm a bullish breakout. It can reach 280 levels, as indicated by the pattern.
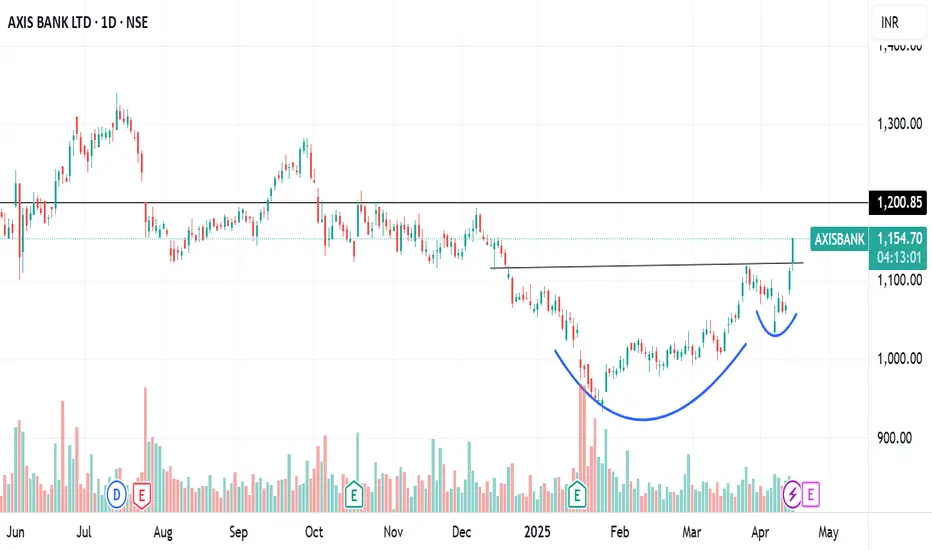
AXISBANK C&H BREAKOUTAxisbank breaking c&hpattern with good volume
macd croosover done,rsi bullish
trading above all imp key ema
breaking 1200 will give more upmove
NO BUY/SELL RECOMENDATION
Britannia Sustains Strength in Upward ChannelTopic Statement:
Britannia is maintaining its upward momentum as the stock continues to trade within a bullish up-trending channel.
Key Points:
- Price is moving in an up-trending channel, making it suitable for channel-based trading strategies.
- The stock recently retraced to the 38.2% Fibonacci level at 4800 and received strong buying support at that level.
- The 180-day EMA acts as a strong support zone for the stock.

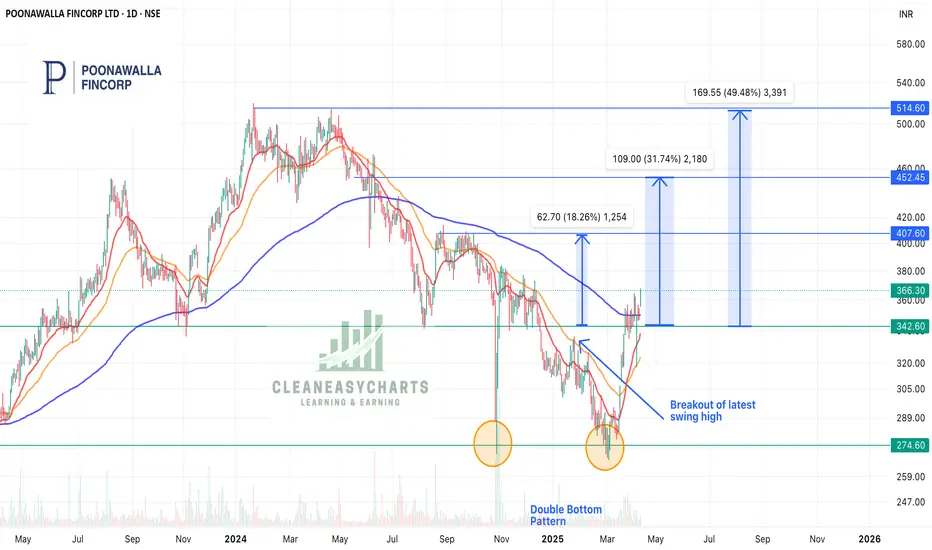
Poonawala Fincorp - Double Bottom PatternPoonawala Fincorp is a NBFC and is making a double bottom pattern. This stock is heading to ATH again. Other factors:
1. Sign of bullish momentum:
- Double Bottom pattern
- Breakout of recent high
- 20 EMA ready to cross 200EMA
2. 5 year growth plan
- Assets worth $17billion
- Raising 10000 cr funding
- Increasing offices from 100 to 400
- Already expanded to education loan, personal loan and commercial vehicle loans
Post rate cut by RBI, NFC sector is ready to roar!!
Keep this stock in your radar!!
Keep following @Cleaneasycharts as we provide Right Stocks at Right Time at Right Price.
Cheers!!
BTC getting ready for the fall. Small pullback is completed.Hi , BTC has completed its small pull back from from 74500 to 86k. It is forming a red candle at the 50sma. If any further pull back will be till 87350 which is nothing but 200sma. But there all longs should be closed and wait or furhter price action. Even now a red candle if completed by today then we are heading down to 53k.

Eicher Motors Unshaken in Bullish UptrendTopic Statement:
Eicher Motors is in a strong bullish momentum and has remained unaffected by the recent market correction.
Key Points:
- Price is moving within a bullish up-trending channel, indicating strength.
- The stock mostly trades above the 180-day EMA, reinforcing its bullish trend.
- Stock can be accumulated near the lower band of the channel using the channel trading method.

Maruti Remains Strong Within Up-Trending ChannelTopic Statement:
Maruti has maintained its bullish momentum despite the broader market correction, supported by its strong up-trending channel.
Key Points:
- Price is moving within a well-defined up-trending channel, making channel trading favourable.
- The stock is taking support at the 23.6% Fibonacci retracement level at ₹11,300.
- Price is currently close to the 180-day EMA, providing additional support.

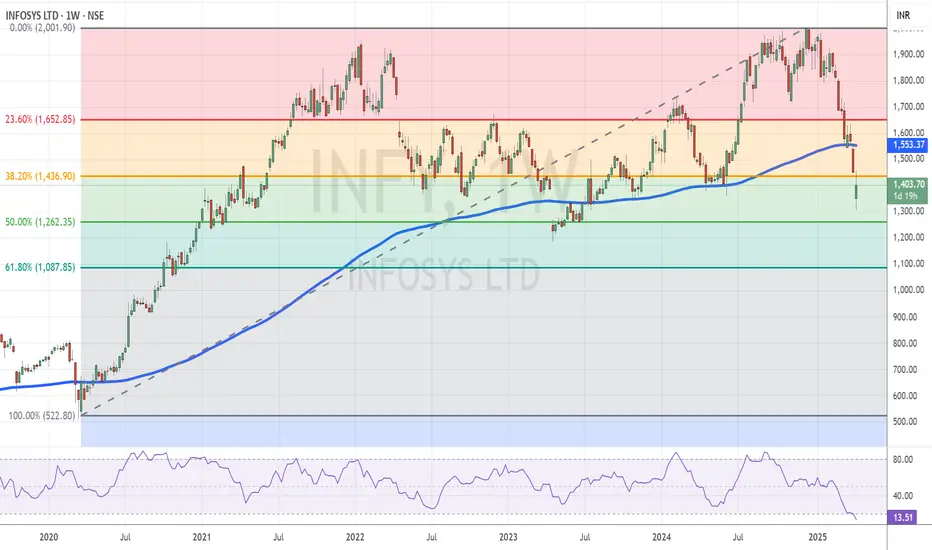
Infosys Turns Extremely Oversold After Deep CorrectionTopic Statement:
Infosys has witnessed a deep correction and is currently trading in an extremely oversold zone, indicating a possible pause or reversal in the downtrend.
Key Points:
- Price is attempting to hold above the 38.2% Fibonacci retracement level at ₹1436.
- Trading below the 180-day EMA signals an oversold condition.
- Weekly Money Flow Index (MFI) is at 13.5, highlighting that the stock is extremely oversold.
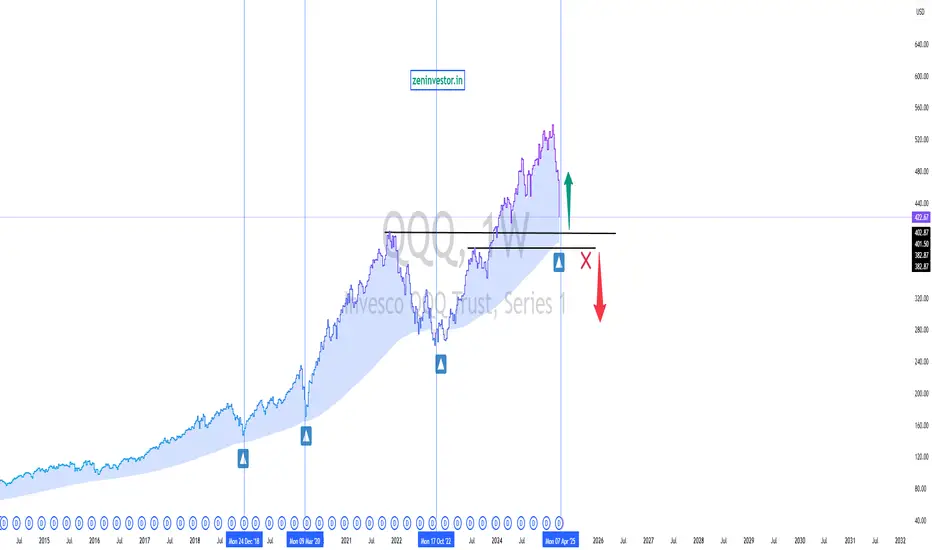
QQQ approaching a long term support area. Will it reverse?NASDAQ:QQQ approaching a long term support area. Will it reverse from here? from 2018 this support zone in weekly is the majour reversal point for bulls. Will history repeat?
Breaking this zone going to be more painful and long term bearish sentiment will emerge.
This is purely a price action educational chart and not a buy or sell reco.
OFSS Breaks Trend, Enters Oversold ZoneTopic Statement:
OFSS has undergone a major correction in line with the broad market downturn after breaking down from its uptrending channel.
Key points:
- The breakdown from the uptrending channel triggered selling pressure and a sharp correction.
- The price has taken strong support at 7,000.
- The stock is trading below the 180-day EMA, making it oversold.

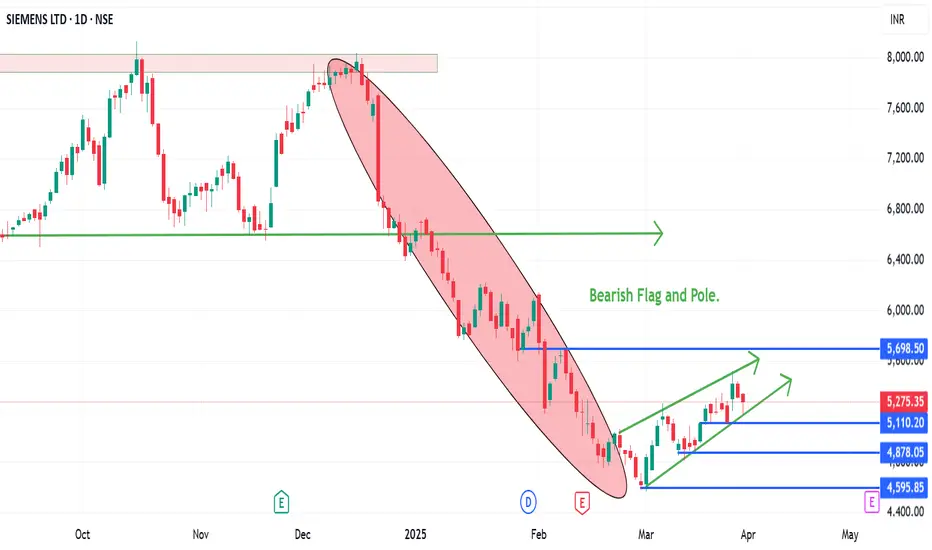
Siemen forming a Flag and Pole pattern on the bearish side.A bearish Flag and pole pattern in Siemens.
The stock has fell from 8000 to 4600 and recovered back to 5300. If there is a break down of the parallel channel, it can retest the recent low of 4600.
It is trading below 100 and 200 EMA on the daily charts. There will be resistance from the levels.
Wait for the break down and let stock price test the recent low.
Enter only once the stock has given a break down, else avoid entering the short trade.
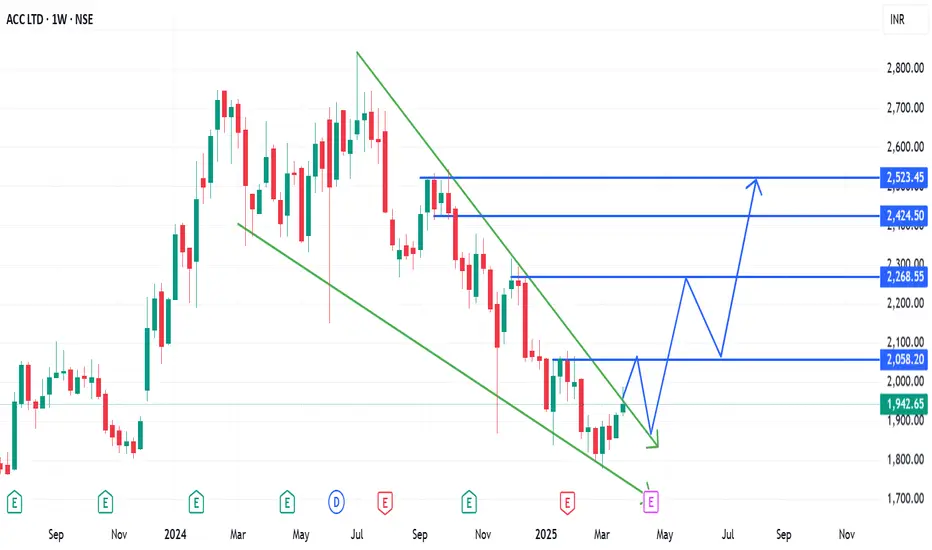
A possible trend reversal in ACC. (01/04/2025)ACC Ltd is trading in a narrow range and is in a downtrend. There are chance of a trend reversal as the indicators are predicting and the price action too seems to follow with them.
The channel break out in the stock can confirm the trend reversal. If the stock give a break out and retest, stock can be bought in cash or in F&O segment too.
Good targets can be captured in the stock as the break out after a year will be there.
Stop loss and Targets should be as per the risk to reward appetite.
Wait for the price action and trade accordingly. Patience will help in capturing the most profitable trades, otherwise losses will be eating away the capital.
BankNIFTY’s Resilience Faces a Trend ShiftTopic Statement:
BankNIFTY has shown resilience compared to NIFTY during the market correction but has entered a mildly downtrending channel after breaching its long-term uptrend line.
Key points:
- The breach of the long-term uptrend line indicates the end of the bullish pattern.
- BankNIFTY is moving in a mildly downtrending channel.
- A breakout on the upper side of the channel will shift the trend back to bullish.
- The price remains far above the 180-day moving average, making BankNIFTY overbought and expensive.

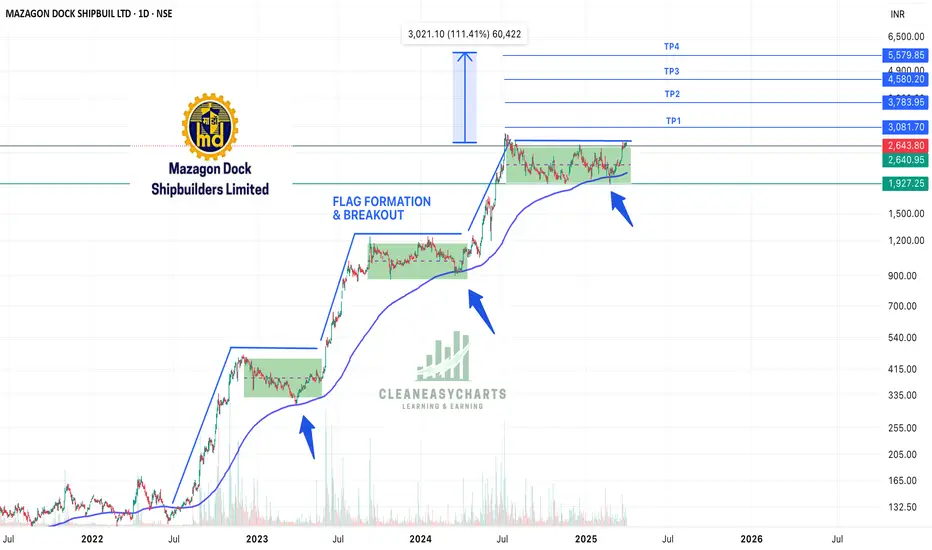
Mazagon Dock - Flag Pattern!!!Mazagon Dock is looking super good both on Fundamental & Technical pattern on account of following:
1. Consistent profitability from 2o years + dividend and no debt
2. Only Shipyard to be conferred Navratna Status
3. Capex planned for next 4-5 years - INR 5000 crores
4. World class infra - Capacity of building 11 Submarines & 10 War Ships concurrently
5. Technically, it is making flag pattern and then giving a breakout. It take support on 200EMA.
6. It is consolidating from last 9 months and a breakout will result in breakout from flag pattern to take price to new heights.
Keep following @Cleaneasycharts as we provide right stocks at right time at right price.
Cheers!!!
I Learned Something From This Chart !Hello fellow traders I hope you all are doing well so as we can see the market is not supporting any long position at the moment but the chart of Bajaj Finserv looks very attractive however I am not creating any trading position in it because the company is going to give it's financial figures tomorrow and it can be harmful for my trading position so all of you please also read this idea only for learning.
So through this chart we can learn that when price breaks 200 moving average, then a good fall or a good upside move comes. One pattern is formed which we call double bottom in which price after going above the swing low again comes near the old swing low and forms a double bottom and from where the price has come back is called the pattern neckline. Apart from this I have plotted a resistance zone where price took support for the first few days and later it became a resistance zone. This thing reminded me again about the theory of support and resistance.
So as I have told you, I will not create any trading position because tomorrow its financial result is due and that can harm my long position. But even if a long position is created after this resistance zone breakout then I will keep my target on the old swing high or all time low which was recently created by the stock a few days ago which was around 2000 keep that as my target and will keep my stop loss below the moving average of 200 days. If we look at the risk to reward then it is 1:2 risk reward ratio which is fine considering the current market perspective. I will not give any update for this idea because I am sharing this idea only for learning purpose. It does not seem to be a proper educational publication therefore i am not adding educational flag but adding long flag beacuse that is my current view.
I hope you like my work, Thanks in advance.
Best regards- Amit.

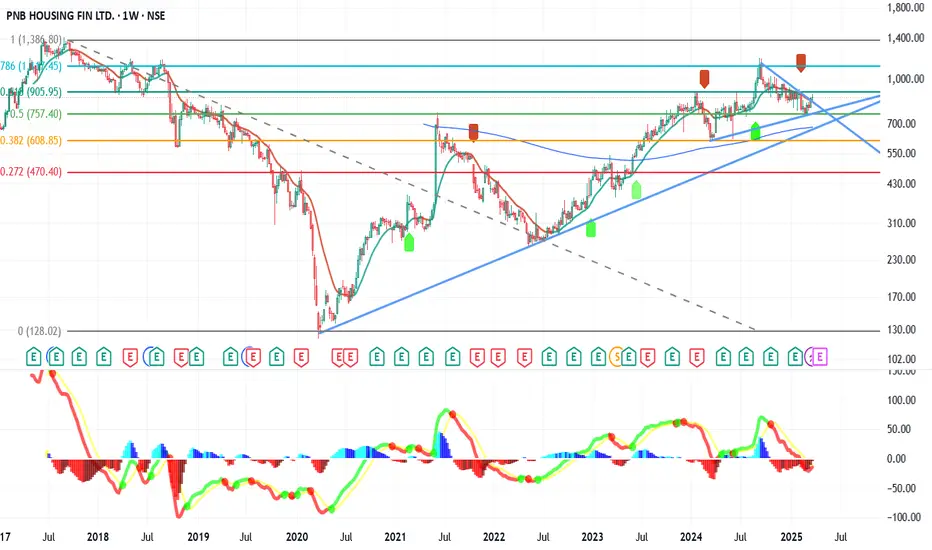
Classic breakout ?After quite a volatile journey, this stock is sending positive signal with crossing a downtrend line & its 233 EMA, with MACD sending an uptrend since 6th March.
With RBI creating liquidity which is positive for NBFC and HFCs and increasing the limit of priority sector lending eligibility for housing finance, this stock needs to be reviewed positively.
Disclaimer - Its not recommendation to BUY or Sell, only for education purpose
Kotak Mahindra Bank exploding after the results.Kotak Mahindra Bank has given good results and reacted gaining 9.21% today.
A good support from 200 EMA on the weekly charts and now its trading around a minor resistance zone.
For a long time the stock is trading in a range, now the stock has reacted to the news. Either it will take a pause on continue to test the upper resistance around 2000 and 2160.
This is the third time the stock is testing the resistance zone. If the resistance is gone chances of test the ATH will be higher.
Daily supports are around 1800-1840 levels. Gap filling can be done but not so early.
It has also cleared the Moving averages gates of all the four EMAs. Bullishness is there in the stock.
Wait for the price action near the levels before entering the trade.

ZEEL : Breakout Candidate#zeel #trendline #breakout #patterntrading #chartpattern #cupandhandlepattern #momentumtrade #swingtrade
Zeel : Swing Trade
>> Trendline Concept
>> Cup & Handle chart pattern visible
>> Moving Avg Concept also suggests Breakout of 50 EMA
>> Breakout point of Trendline / Chart Pattern & Moving Avg concept are all in confluence at same point. (Refer both charts)
>> Hence its a Breakout candidate, probability is higher
>> Upside potential is of 20-25% & Downside Potenial is 9-10%
>> So a good 1:2 Risk Reward Trade
Swing Traders can lock profit at 10% and keep Trailing
Please Boost, comment and follow us for more Learnings.
Note : Markets are still Tricky and can go either ways so don't be over aggressive while choosing & planning your Trades, Calculate your Position sizing as per the Risk Reward you see and most importantly don't go all in
Disc : Charts shared are for learning purpose only, not a Trade recommendation. Do your own research and consult your financial advisor before taking any position.

LAURUS LAB LONG TERM CHANNEL 30% UPTRENDThe Channel is being respected for more than 19 months.
With a steady rise. Low downside potential
Taking Good Support for 200 EMA and channel.
BONUS... Entire Sector is hitting the uptrend.
