Smallcap 100: No trades yetNIFTY SMALLCAP
➡️My customised indicator telling me to wait. This is one of the tools I use to decide the market breadth.
➡️When the index is above the channel, the chances of getting trades right and extremely rewarding are higher.
➡️Below it, it’s not the most conducive trading environment especially in smallcap.
➡️Not jumping onto new positional trades as of now.
Moving Averages

LTIM Trades Sideways After Market Correction Topic Statement:
LTIM has corrected along with the broad market correction and is currently trading in a sideways range, with key support and resistance levels defining its movement.
Key points:
- The stock is moving in a sideways range between 4000 and 6000.
- Price has received heavy support at the 50% retracement level previously and is currently at this level.
- The stock is trading below the 180-day exponential moving average, making it oversold.
- The weekly MFI is at 17.8, indicating that the stock is highly oversold.

KOTAK BANK NEAR FLAG BReakoutKotakBank is nearly Flag Breakout on Monthly Candle (Wait more 7 days to Finish MOnthly Candle with Big Bull Breakout)
Wait for Proper Breakout beacuse its 4 time where Chart is going to test same Trendline.
Flag Pattern Start from 2020- After 5 years its will going to break
If we see fulll chart Stock taking support over 2013 Trendline before two months so there is more more possibility to give breakout
if we see RSI chart its also show Breakout over MOnthly RSI trendline..
## THis is my Just View, take position after all confromations and research by yourself##
also see weekly chart - weekly showing strong big bull canle ( 1more Weekly Candle Require for final conformations)

NASDAQ Trendline and 50EMA BreakdownNASDAQ long term 2 year Trendline is breaking down and this week price is closing below 50EMA as well. Waiting to see if it will bounce back.

CGPOWER INVERSE H&S REVERSAL PATTERNCgpower is breaking inverse h&s reversal pattern
breaking 200 ema also
with good volume,bullish rsi
breakoing and holding 690 can take it 750-800
NO BUY/SELL RECOMENDATION

IndusInd Bank Plunges on Accounting ConcernsTopic Statement:
IndusInd Bank has faced a massive selloff following accounting discrepancies in its derivatives portfolio, pushing the stock into oversold territory.
Key points:
- Stock has broken the 61.8% retracement level, indicating the selling pressure may continue until a full 100% retracement towards Rs 243.
- Price has overextended below the 180-day EMA, making the stock oversold.
- MFI on the weekly chart is at 20, denoting highly oversold conditions.

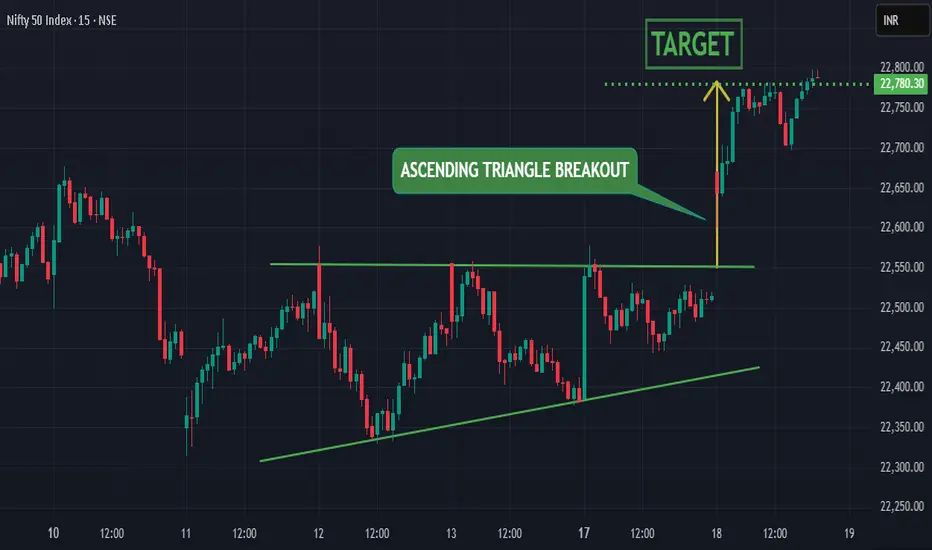
Nifty broke out of Ascending Triangle pattern
ASCENDING TRIANGLE BREAKOUT -
nifty had recently broken out of strong ascending triangle pattern indicating strong upward potential for the index
50D & 100D SMA CROSSOVER -
50D sma had recently crossed over 100D sma and took multiple support on 50D sma repeatedly indicating strong potential of upward momentum for the index
Nifty weekly analysis for 17/03/2025Nifty is trading between 100 EMA (weekly) and 20 EMA (daily). A good support from the weekly moving average is there and resistance on the daily charts.
A continuous support from 22300 level is there as the market has remained in a range whole week.
If the market tried to breach the support level, the support of weekly 100 EMA can be the other support around 22030 else it will take support around 21800.
In case the market starts to recover from the bottom and creates a higher high higher low formation it has to take out the resistance of 22650 and 22758.
Major levels are plotted in the charts. Just wait for the price action to confirm the entry into a trade else another sideways market can be seen.
Inside candle formation on the daily charts is also there and break out/down can be traded accordingly. Different trading approaches can help in capturing a good trade.
Wait for the price action near the levels before entering the market.

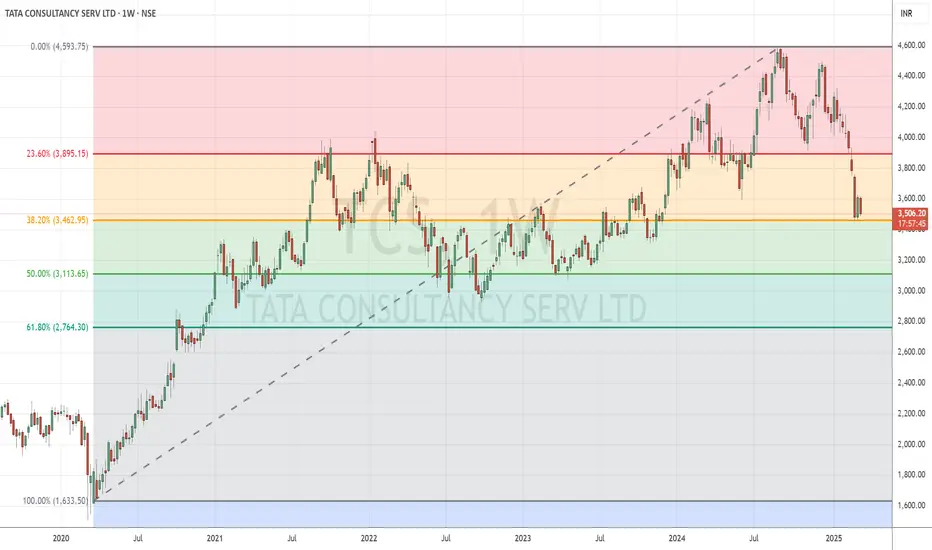
TCS Approaches Strong Support Amid Severe CorrectionTopic Statement:
TCS has seen a sharp correction in recent months, with the stock finding support at the 3500 level while trading below the 180-day EMA, indicating oversold conditions, further confirmed by a highly oversold weekly MFI.
Key points:
- Stock takes support at the 38.2% retracement level
- Price is below the 180-day EMA, marking it as oversold
- Weekly MFI is at 18, indicating the stock is highly oversold
Death Crossover Strategy Explained with 50-EMA & 200-EMA line.Hello Traders! In today's post, we’ll explore the Death Crossover Strategy , a highly effective technique used by traders to identify potential trend reversals. This strategy involves the 50-EMA (Exponential Moving Average) crossing below the 200-EMA , which is considered a bearish signal.
In this chart of IndusInd Bank Ltd., we can clearly see the Death Crossover in action. The 50-EMA (green line) has crossed below the 200-EMA (red line), signaling a potential downtrend.
Key Insights:
Death Crossover : Occurs when the short-term moving average ( 50-EMA ) crosses below the long-term moving average ( 200-EMA ), suggesting the beginning of a downtrend.
Volume Confirmation : A sudden increase in volume after the crossover confirms the strength of the signal. In this case, the volume spike at the crossover indicates a strong bearish momentum.
Target Areas : After a Death Crossover , look for potential support levels to target as the price moves lower. In the chart, we can see how the price retraced and then continued its downward journey.
Price Action Post-Crossover:
In this example, the stock dropped by approximately -38.12% after the Death Crossover , highlighting how powerful this signal can be in catching major trend reversals.
Risk Management :
Stop Loss : To protect your capital, always use a stop-loss order just above the 50-EMA (green line) when entering a short trade after the crossover.
Position Sizing : Keep your position sizes small in trending markets to manage risk and ensure a favorable risk-to-reward ratio.
Note: We have used this chart just for teaching the strategy and its potential impact.
This is a great strategy to catch long-term downtrends, but as always, remember to use it alongside other technical indicators and fundamental analysis to increase your chances of success.
Happy Trading!

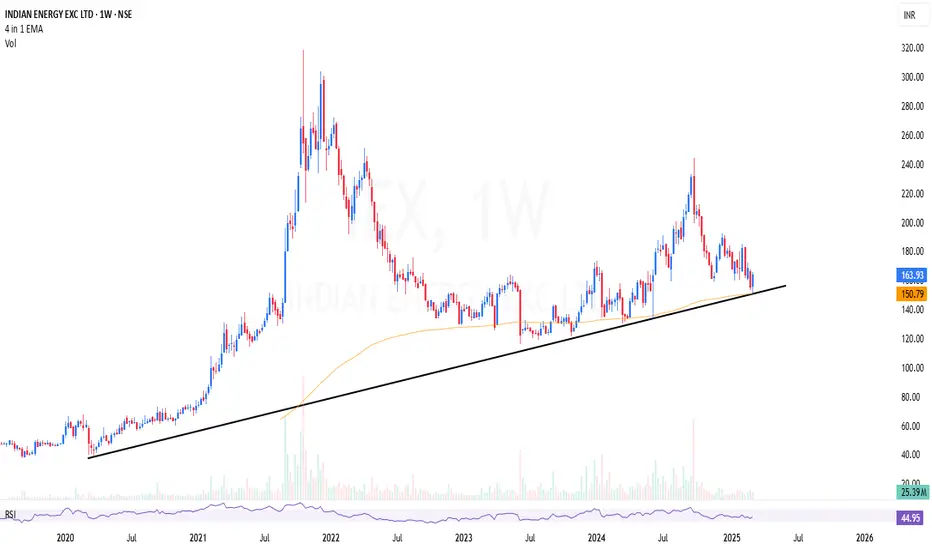
IEX | Looks fully bottomed out and signaling for reversalIEX | Looks fully bottomed out and signaling for reversal
Weekly long time trendline support + 200 EMA support
CMP : 163
MRF Finds Strong Support After Severe Correction Topic statement:
MRF has experienced a sharp correction in recent months, with the stock finding strong support at the retracement level and indicators are giving an oversold opportunity.
Key points:
- Stock has corrected to the 61.8% retracement level at 1,08,000, providing strong support
- Strong support is also seen at the emotional level of 1,00,000
- Price is on the 180-day moving average
- Weekly MFI is at 28, indicating the stock is very oversold

LTIM: Sideways Consolidation Continues After Strong 2021 RallyLTIM has been trading in a well-defined range since its 2021 bull run, with strong support and resistance levels dictating its movement, between 4000 and 7000.
Key points:
1. The stock faces heavy resistance at 6800, as the 23.6% retracement level acts as a strong barrier.
2. Price consistently finds support at the 50% retracement level and has bounced back from this level multiple times.
3. The stock is currently near the 50% retracement level and trading below the 180-day exponential moving average, making it oversold.

SBIN: Holding Strong Amid Market Weakness but Facing Further DowTopic Statement:
SBIN has experienced a relatively minor correction compared to the broader market, but technical indicators suggest the possibility of further downside.
Key points:
1. The stock has corrected to the 23.6% retracement level and attempted to break below but has reverted to this level.
2. Price is near the 180-day moving average, signaling a crucial support zone.
3. Weekly RSI is at 38, indicating persistent selling pressure, with a potential decline to the 38.2% retracement level at 612.

Reliance: Leading the Market Correction & Nearing Strong SupportTopic Statement:
Reliance has undergone a sharp correction in recent months, significantly influencing the broader market downturn, but key technical levels suggest a potential stabilization.
Key points:
1. The stock has corrected to the 38.2% retracement level, receiving strong support.
2. Price is now below the 180-day exponential moving average, indicating oversold conditions.
3. Weekly RSI stands at 34, marking an oversold zone from a long-term perspective.

Monthly Breakout On RSI & TrendlinePlease check Monthly Trendline over RSI - From 2018 to 2025 RSI Trendline Breakout done Last month & Sustain in crusial month also
Second thing if we check Trendlines over Chart - Stock is taking regular support from 2014 to till date
if we check from 2021 to till date consolidation zone - Stock is going to breakout this zone (final conformation above 2080, for Safest Entry)
But as per current scenario and situation i thing kotakbank will be a good choice if market start upward direction

Bajaj Finance: Defying Market Correction with Potential BreakoutTopic Statement:
Bajaj Finance has remained strong despite the broader market correction, and a breakout above its key resistance level could trigger a new rally.
Key points:
1. The stock continues to move upward despite the market correction.
2. The price is approaching a critical resistance level at 8,200.
3. A breakout from this triple-top resistance could lead to further upside momentum.

Havells: Testing Key Support Levels Amid Market CorrectionTopic Statement:
Havells has corrected along with the broader market and is now approaching critical support levels that may determine its next move.
Key points:
1. The price is taking heavy support at the 38.2% retracement level at 1,476.
2. The stock is trading close to the 180-day moving average.
3. Weekly RSI is at 40, indicating the stock is nearing oversold territory.
4. If the support at 1,476 fails, the price may decline further to the 50% retracement level at 1,280.

MAX HEALTHCARE - Bearish after breaking down from Double Top
DOUBLE TOP PATTERN -
market has broken down from perfect double top pattern indicating potential downward fall for the stock
VOLUME SURGE -
market has shown sudden volume surge recently indicating downward fall is coupled with strong volume
NEARING 100D SMA -
market is hovering above 100D sma. In past, it had touched the 100D sma whenever it has come close to it indicating market may soon fall to touch this moving average
TARGET -
price may fall till the target of 1008

Angel One: Finding Support Amid Market Correction Topic Statement:
Angel One has declined along with the broad market correction but is receiving strong support at key technical levels, suggesting a potential stabilization.
Key points:
1. The price is receiving crucial support at the 50% retracement level, as it had previously.
2. The 2000 level aligns with the 50% retracement level, acting as a strong support zone.
3. The stock is currently trading below the 45-day moving average making the price oversold.

BPCL: Stabilizing After Market Correction Topic Statement:
BPCL has declined in line with the broad market correction but is finding support at key retracement levels, offering an accumulation opportunity for investors.
Key points:
1. The 50% retracement level is acting as a strong support.
2. The price is currently just above the 180-day moving average.
3. While the price may fall to the 61.8% level, investors can consider accumulating at the current 50% retracement level.

PNB Gilts Might CorrectPNB Gilts might correct in recent days to come. Here are the technical reason :
1)Trading below 20 EMA & 50 EMA on daily chart
2)Head & Shoulder Pattern formation on daily chart
3)On Monthly chart it's negative with 117.8 as last month low(August) which is an important support level.
(Note: Not responsible for anyone profit or loss, nor a sebi registered RA, this only for educational purpose. Please do your own due diligence before taking any trades.)

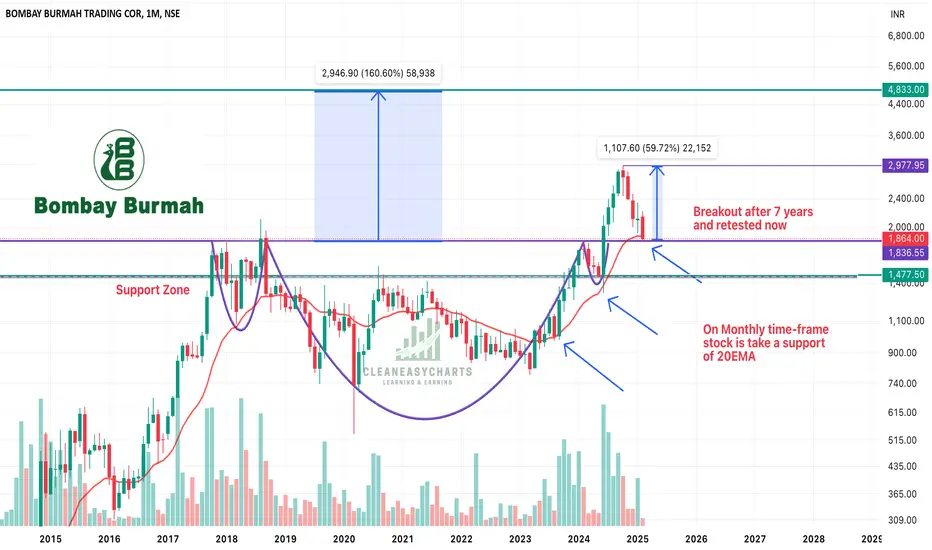
Bombay Burmah Trading Corp - Head & Shoulder Pattern & Retest!!Bombay Burmah had given breakout of Head & Shoulder pattern and now has entered retest zone on a monthly time frame. It is looking good and can move towards our targets as mentioned in the chart. Other factors:
1. Monthly Time frame set-up : Head & Shoulder Patter breakout and retest on a larger time frame is much stronger set-up. On a smaller time frame it can come down till support level given market conditions.
2. Stock price is taking EMA 20 as a support on MTF
3. Holds 50% in one of the largest FMCG Co. Britannia - FMCG sector should revive and should give tailwinds to this stock.
4. Hold many dimensional business and EPS is increasing on a YoY basis
Keep this stock in your radar!! Keep following @Cleaneasycharts as we provide Right Stock at Right Time at Right Price !!
Cheers!!!