FinNifty monthly expiry analysis for 30/01/24.After the first hour move FinNifty has consolidated and remained in a narrow range.
Tomorrow is it monthly expiry and chance are there will be a trending move as it has consolidated today.
Major Bullish targets :- 20720, 20925
It has closed around 61.8% level which around the closing of the index.
If there is a flat opening and a break out, fresh position either side can be initiated.
In case of a gap up there will be another bullish day for it, else there will be a halt candle.
Support levels :- 20230, 19950-20010
Wait for market to form a price action and trade accordingly.
Moving Averages

Nifty weekly analysis for 29/01/24.Nifty is looking strong on the weekly charts and the recovery on the last trading session is looking positive too.
It has closed around 38.2% fib level. If the market gap up there are chance of a W pattern above 21480, it can test 21550 levels.
Wait for a hourly candle close above or below the levels. As good intraday targets can be achieved in the trade.
Resistance levels :- 21480, 21550, 21700
If there is a gap down below 21230 level, it can trade upto the previous day low.
Bearish target/ support levels :- 21230, 21020-21000, 21860
The market will be volatile this week as there is a budget on wednesday. Option premium are high and there is much movement in the premiums.
SL should be trailed for capturing the move.
Wait for the price action near the levels before entering the market.

REC BREAKING A RANGEREC breaking a range box
with good volume
trading above all key ema
EDUCATIONAL IDEA

TATAMOTORS BREAKING F&PTatamotors breaking flag pattern
with good volume
trading above all key ema
#target can be 900
EDUCATIONAL IDEA

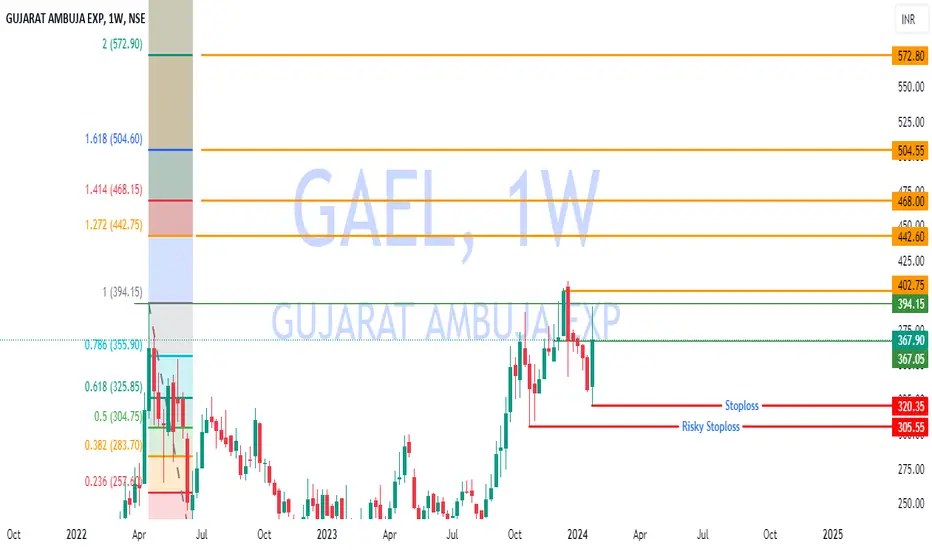
Gael Better Risk Reward#Gujarat Ambuja Exp is trendy at the moment and Making continuous Higher High and Higher Low,
At the Moment #stock is at Higher Low, followed by #Priceaction.
Buy with the Calculated SL and can Ride the trend.
Safe players can book 1:1.5.
Do your own Analysis before any trade.
#TradewithConviction
CSB Bank - Daily chart - BullishCSB Bank looks fundamentally strong and in good valuation too. At the same time, technically it is taking support and has probability to towards upside.


Nifty weekly analysis for 23/01/24.Nifty on weekly and daily time frame has formed a engulfing candle and chance are there of market going down if it breaks below 21500 level for intraday.
It has been taking support from the daily 20 moving average and rejection from 50% fibonacci level.
If market tries to move up side it will hit the resistance levels of 21800. In case the level is crossed and sustained, it can test 22000 level.
Up move targets :- 21800, 21970.
On the other hand, market can test the support levels of 21500 and 21350.
Even the hourly 200 ema will also act as a support i.e. 21430.
Support levels :- 21500, 21430. 21350
Chances are there that market can retest the support levels and if the last support levels of 21350 is breached, bearish trade targets can be 21020-21110.
Wait for opening of the market as much of the movement is decided after the price action.

Banknifty weekly analysis for 23/01/24.
Banknifty is taking support from the weekly 20 ema and has formed a bearish engulfing candle on the charts.
The movinga averages are being respected by the market, it is hovering between both 20 and 200 ema on daily charts.
A consolidation is there in between 50-61.8% fibonacci levels. It has been trading in a similar range for last 3 trading session and this week is only of 3 days.
In case, market starts moving up it will face resistance around the rejection levels of 46610 and 46900-47050.
Resistance :- 46230, 46610, 46900-47050.
The market is showing some negative sentiments and there are chances of it hitting below 45k levels once the support zone of 45500 is breached.
Bearish trades can be initiated once 45450 level is gone and market starts sustaining below it. There are buyers around this level and lower targets of 45000 and 44600 can be capture on the break down.
Support levels :- 45450-500, 44930, 44550(daily 200 ema).
Mark the no trading zone of 45450-46100 as the market is volatile in this range.
Wait for the price action and candle closing below or above the levels before initiating a trade.

Resistance to support in poonawalaAfter giving all time high of 335 levels
we have retest of the same level.
Its taking regular support at 50ma.
SL T1 T2 on chart

Huge selling in HDFC. How to trade it tomorrow.One side fall in the stock has impacted the indices too.
HDFC bank, is heavy weight in index, fell 140 point or 8.5% created a sell off.
It took a retest of 200 ema and has closed below both the averages. It may give another red candle tomorrow.
There stock has closed around a support zone and chance of testing 1500 levels are high.
Short position can be created below 1535 levels and targets can be trailed if the market remain in red.
Support levels:- 1505, 1470-80
The results are not that bad to make the stock fell so much. Some long term investors can accumulate some quantity.
Wait for a price action and enter only confirm trades.

KOTAKBANK Swing TradePrice getting Support at 50 Month Moving Average.
Doji followed by a Bullish Confirmation Candle.
Expecting a 1:3 Risk: Reward trade.
Not a recommendation.

FINOPB Long- Looking good for 300+FINOPB Long- Looking good for 300+.
10 SMA has crossed 20 SMA
MACD cross over happened.
and current price above 200 EMA with good volume.
With SL of 260. Hold stock for 300. T1 & 350 T2
I'm not a SEBI registered, this is for educational purpose, please do your own analysis and calculate your risk and enter taking positions.

IRFC cmp 34.95Trendline Getting Respected
Retest zone will be interesting to watch on DCB.
#Learning #Observation
Use Discretion !!!
Just for Educational purpose

IRB Infra Going Strong IRB Infra- Weekly Time Frame -
=> MACD Crossing Signal Line
=> MACD Crossing Central Line
=> Symmetrical Traingle Breakout
=> Volume Present

"Bank of Maharashtra" - A cheap Buy amid priciey stocks.📈 BSE:MAHABANK Technical Analysis (Jan 3, 2024) 📊
Current Price: ₹47.10 INR
Technical Observations:
1. Support Levels:
• Began the day above 0.50, a key support level. 🛡️
2. Fibonacci Levels:
• Surpassed the 0.618 Fibonacci level, suggesting upward momentum. 🚀
3. Parabolic SAR:
• Awaiting a bi-signal for a potential short-term bearish trend. 📉
4. RSI & Stochastic RSI:
• K value at 40.04 and D value at 27.90, indicating an oversold condition. 💰
5. MACD:
• Observing a potential crossover with MACD at 0.27 and 0.22. 🤑
6. EMA & MA Crossover:
• Anticipating a 50-day and 200-day EMA and MA crossover in the next two days. 🔮
Fundamental Analysis:
• Price to Earnings Ratio: At 9.14, indicating the stock is still potentially undervalued. 💼
• Income Statement Trends:
• Net margins showing a nearly flat yet improving trend. 📈
• Increasing net profit, supporting a positive outlook. 💹
Trade Strategy 📝:
• Entry Point: Entry recommended if stock opens at ₹0.614 or above on Jan 4, 2024. 🎯
• Target Prices:
• First Target: ₹48.85 🎉
• Second Target: ₹50.55 🌟
• Stop Loss: If price falls below ₹45.20. 🛑
Disclosures and Disclaimers:
• Analysis is a personal opinion, not financial advice.
• No financial advisor-client relationship established.
• Trading involves risk; assess your financial position.
• Information may contain errors; verify independently.
• No liability for reliance on this analysis.
• Past performance not indicative of future results.
• No conflict of interest declared.
Hashtags:
#BankOfMaharashtra #TechnicalAnalysis #TradingView #StockMarket #Finance #Investing StockAnalysis #Fundamentals #P/E #NetMargins #TradingStrategy

Jupiter Wagons Limited - A very Short term spike expectedNSE:JWL - Technical Analysis Update 🚀📈
Current Price: ₹339.50 (as of Jan 5, 2024, 11:47 AM)
Key Indicators:
Parabolic SAR: Buy signal triggered 🟢
Moving Averages: Crossover at ₹323.20
MACD: Histogram at 1.21 (positive), MACD at 0.46, Signal at -0.76
Stochastic RSI: K at 75.55, D at 53.11 (not overbought yet)
%R: -14.14, touching upper baseline
Fisher Transform: -0.01 (Fisher), -0.59 (Trigger)
Market Outlook:
The stock shows potential for upside 📈, especially with the recent big order win.
Short-term bullish trend starting, watch for the close above ₹341.20 (critical Fibonacci 0.618 level) for confirmation.
Trading Targets:
First Target: ₹350.90 🎯
Second Target: ₹363.20 🎯 (approx. 1.0 Fibonacci level)
Caution:
High volatility expected. Enter for short-term trades 🔍.
High P/E ratio above 50. Short-term positions advised.
Keep an eye on market opening movements for further clues.
Stop Loss: ₹ 327.15 (around the key Fibonacci Levels of 0.382 - ₹ 327.40) ⛔
Conclusion:
Jupiter Wagons Limited is a promising pick in the railway wagon sector. Ideal for short-term traders looking for growth opportunities. Stay alert and trade wisely! 🌟🛤️
Disclaimer:
General Information Only: This analysis is provided as general market commentary and does not constitute investment advice. It is provided for the information purpose only.
Not a Recommendation: The information provided does not take into account your individual investment objectives, financial situation, or specific needs. It should not be relied upon as a recommendation or an offer to buy/sell or as a solicitation of an offer to buy/sell any security or financial instrument.
Accuracy and Completeness: While care has been taken in gathering the data and preparing the analysis, there is no guarantee of its accuracy or completeness.
Market Risks: Investing in the stock market involves risks, including the potential loss of principal. The value of investments and the income from them can fall as well as rise.
Past Performance: Past performance is not indicative of future results.
Personal Responsibility: Investors are advised to conduct their own independent research into individual stocks before making a purchase decision. It is important to be aware of the risks involved in stock trading.
Professional Advice: Consult a qualified financial advisor before making any investment decisions.
No Liability: The author of this analysis assumes no responsibility for any losses or damages resulting from decisions made based on the information provided.
Regulatory Compliance: This post does not guarantee that the analysis adheres to all regulatory requirements in different jurisdictions.
Conflict of Interest Disclosure: The author declares no financial interest or benefit from the direct or indirect promotion of the stock mentioned.

Indian Bank Stock Analysis: Spordiac Buy Signal on short term📈 NSE:INDIANB - January 5, 2024, 12:52 PM
Current Trading Price: ₹435.10 🏷️
Opening & Key Levels:
Today's Opening: ₹432.40 (Above 0.618 Fibonacci Level) ✅
Near 50-Day Moving Average: Indicating Bullish Trend 📊
Technical Indicators:
EMA & MA: No crossover yet 🔄
MACD: Histogram at 0.48, MACD at 0.70, Signal at 0.22 (Positive Crossover) 📈
RSI: Currently at mid-range, K at 55.02, D at 37.62 (Viable Range) 🎯
%R: At -29.83 (Supportive of Bullish Trend) ⬆️
Fisher Indicator: Positive crossover, Fisher at 0.80, Trigger at 0.27 (Mid-Range) ✨
Parabolic SAR: Buy signal at ₹391.00 🟢
Target Prices & Stop Loss:
Target 1: ₹443.65 (0.786 Fibonacci Level) 🎯
Target 2: ₹458.00 (Level 1 of February Series) 🎯
Stop Loss: If falls below ₹424.50 (0.5 Fibonacci Level) ⛔️
Overall Outlook: Bullish in the short term, but confirmation needed from other indicators. Volatility noted. Investors are advised to monitor closely.
Disclaimer: This analysis is for informational purposes only and should not be construed as investment advice. Investment decisions should be based on individual research and risk appetite. 🚫
#IndianBank #StockAnalysis #TechnicalAnalysis #Investing #StockMarket #BullishTrend #TradingTargets #RiskManagement

CUMMINS BREAKING THE RANGECUMMINS breaking the range
with good RSI
macd crossover done
EDUCATIONAL IDEA

Nifty weekly expiry analysis for 18.01.24.A heavy sell off in the markets and a single stock down by more than 8% has brought nifty down.
The closing is ,below 20 SMA and EMA, around the day low.
MAJOR SUPPORT :- 21500
If the above support is gone nice 100 point first target can be achieved. To carry on with the bearish move trail SL for finally target around 21280.
Nifty is 2% down while banknifty is more than 4%.
Tomorrow is the weekly expiry keep targets and SL tight. VIX is up by 11% which means option premiums will be high.
Target levels :- 21365, 21280
Either it will go for another dip or it will halt in case of gap up opening (minimal chances). Avoid entering any bullish trade for intraday.
Price action is the key. Keep it in watch.

BIRLASOFT Strong Bullish ContenderBirlasoft is very strong at the moment. Breakout and have follow up candles.
In the recent fall, IT stocks are holding strong at the moment.
follow the levels for PriceAction.
Targets are in Charts

GBPUSD Short [4H Swing]GBPUSD is Weekly Bullish, but over extended with a reptracement due. Daily and 4H show signs of bearish price action. Price broke through the previous Weekly Key Price Area and retraced back to form a potential Lower High to continue the bearish momentum.

Huge selling in Banknifty. Analysis for 18/01/24.Single day fall of 2k points in banknifty is showing a bearish sentiments.
A break out of the consolidaiton box is confirmed. Now the market is standing at 46050 and a clear support of 46k can be seen.
If 46k levels is gone another day of selling may be there.
Major support :- 46000, 45650
Market closing below the 20 ema and near to day low. Watch market price action for 1 hour as after a huge selling overnight positions will be initiated and in the first 15 minutes there will be profit booking, in case of gap down opening.
Avoid bullish trades for tomorrow.
The banking sector is down because of the HDFC bank single handed fell 8%, almost 150 points lower.
Gap up will create confusion. In this case avoid trading.
Wait and watch price action.
