Skipper - Short term target 625/630
Technical :
=> Uptrend is intact
=> Trending above key moving averages
=> Based on the SMC analysis the short term target will be 625/630
=> Stop Loss is around 510
== EDUCATIONAL PURPOSE ONLY ==
Moving Averages

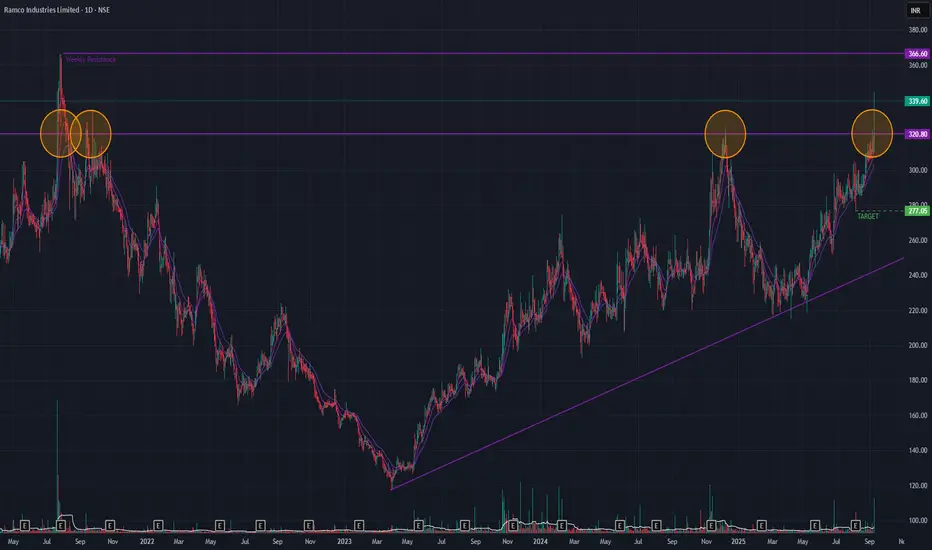
Ramco Ind (Daily Timeframe) - Is this a false BreakOut??Ramco BrokeOut of a multi-year resistance trendline (since 2000) today with huge volume and stock price zooming by 8.03%. The last time it BrokeOut of this trendline was in 2021 which did not sustain but the stock made a new ATH then. Short-term EMAs are in PCO state as well as EMAs & DMAs are in Golden Cross-over state.
On the upside the stock may reach 366 levels & on the downside the stock may reach 277 levels.
The price-action in the coming days will dictate how the stock moves. Keep monitoring.
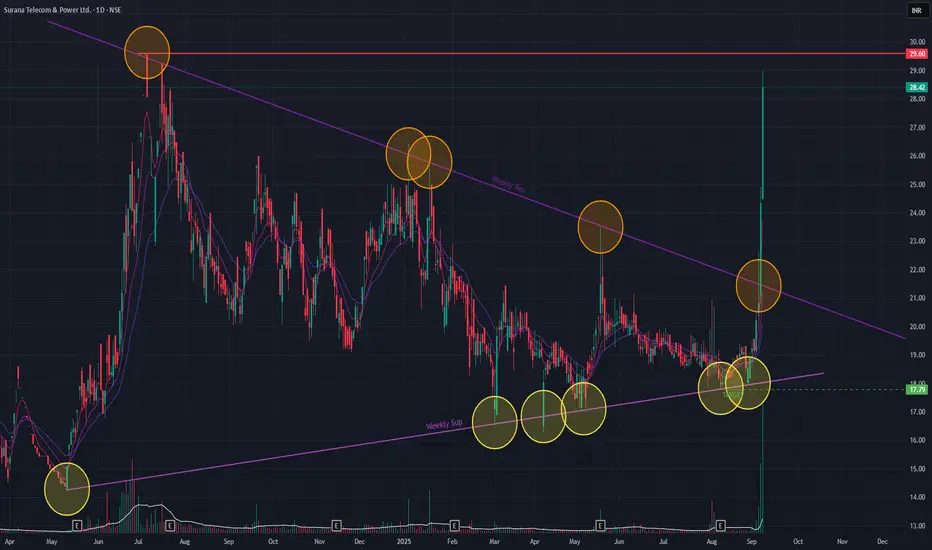
Surana T&P (Daily Timeframe) - Will it make new ATH?Surana has formed a Triangle formation which it Broke-Out last week confirming a bullish momentum. Short-term EMAs are in a PCO state. Today the stock opened Gap-up and formed a strong bullish candle (16.86%) with huge volume. A Golden Cross-over in both EMAs and DMAs may form in the coming days, which is a bullish signal, confirming the momentum.
On upside the stock may reach 37 levels if the momentum continues. If the stock is unable to sustain momentum, then we may see the levels of 17 on the downside.
Price-action is what we need to keep monitoring!!
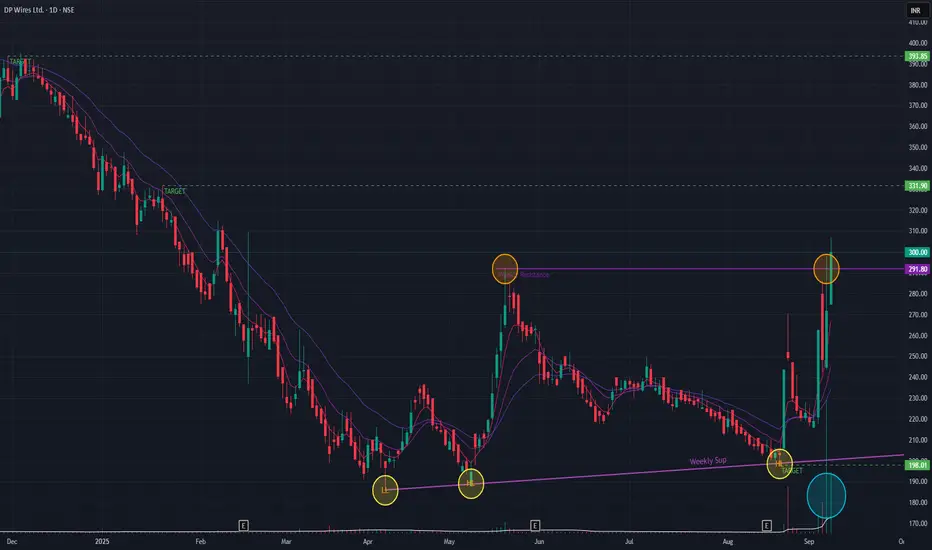
DP Wires (Daily Timeframe) - Can it sustain the momentum??DP Wires has been on a downtrend till Apr 2025 and ever since has been forming Higher Lows which is a bullish signal. Short-term EMAs are in PCO state. With today's bullish candle the stock has broken out of a key resistance trendline with huge volume spike.
The stock may reach 331 levels & thereafter 393 levels if the momentum continues on the upside. We could see levels of 198 if the stock reverses to the downside.
Keep monitoring the price-action!!
Reliance Moves Steadily in Mild Bullish Channel, Approaches Key Topic Statement:
Reliance is trading within a wide, mildly bullish uptrend, offering clear accumulation opportunities as it nears key moving average levels.
Key Points:
1. The stock is moving in a broad and mildly bullish up-trending channel, making it suitable for structured channel trading
2. A recent double top candlestick pattern has formed, indicating potential near-term resistance
3. The price is currently above the 50-day EMA, and dips below it has historically offered good investment entries
4. The stock is approaching the 200-day EMA, a level that often marks oversold territory and presents strong long-term buying opportunities

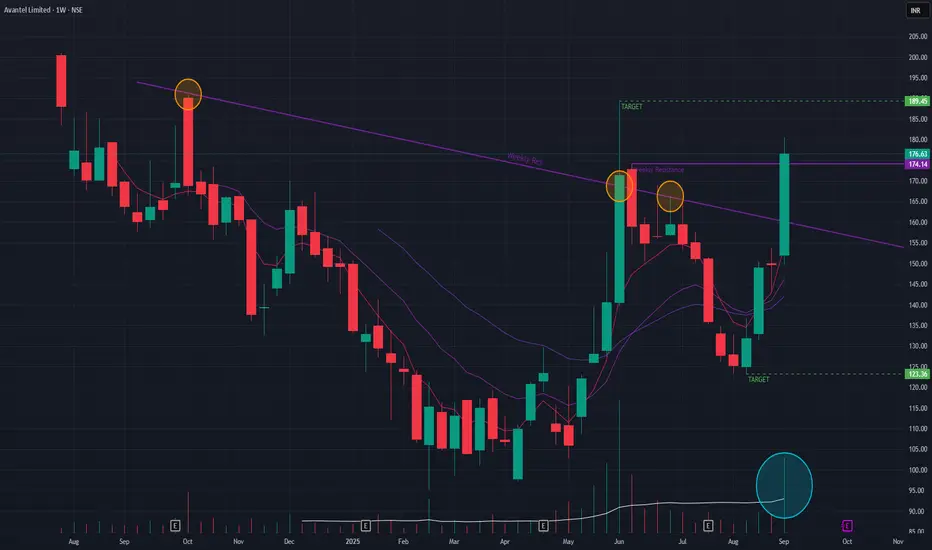
Avantel Ltd (Weekly Timeframe) - Can it sustain the BreakOut??Avantel has been on a downtrend since it's IPO. Since Apr 2025, the stock has been in an uptrend by forming Higher Lows. In the process the stock was able to BreakOut of a key angular resistance as well as a horizontal resistance with a 17.94% surge accompanied with exceptionally huge volume while the short-term EMAs are still in PCO state.
If the momentum continues with some good price-action during the coming week, we may see the stock reach 189 levels. On the downside, we may see the stock reach 123 levels.
Let's watch-out for the price-action during the coming week.
Carysil - Can it sustain the uptrend?Carysil BrokeOut of the horizontal resistance zone and also angular resistance zone with huge volume, last week. The stock surged by 11.59%. Short-term EMAs are still in PCO state which is showing a bullish trend.
With good quarterly earning, the stock may surge further and may reach 1048 levels & thereafter may make new ATHs if the price-action sustains. On the downside, we may see the levels of 768.
Watch-out for next week's price-action.

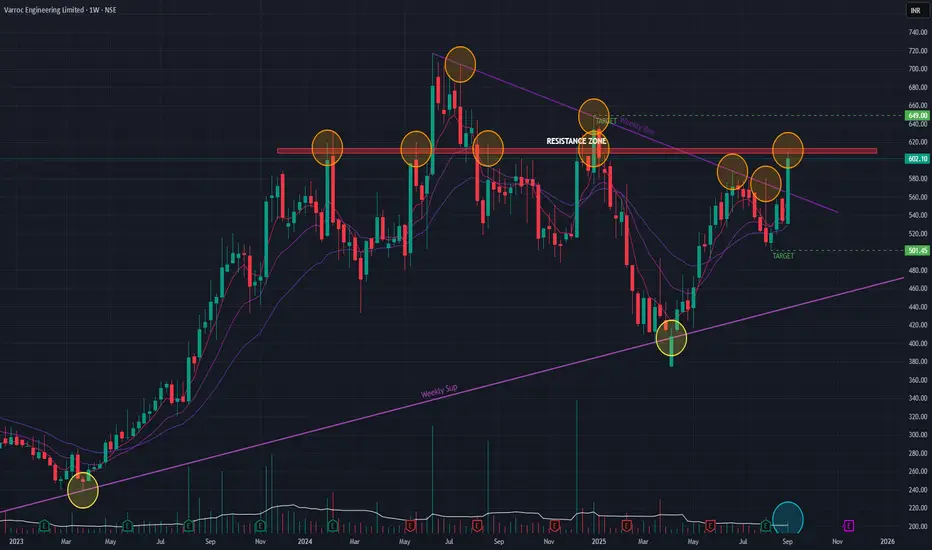
Varroc (Weekly Timeframe) - Potential BreakOut ??Varroc has been mostly in a sideways trend since Dec 2023. Key horizontal resistance zone was brokenout couple of times but that could not be sustained for long. Last week the stock surged by 12.68% with decent volume. With the surge it was able to breakout of a major angular resistance. Short-term EMAs are in PCO state as of last week.
If momentum continues, we may see the stock surge past the resistance zone and may reach 649 levels. On the downside, we may see the stock at 501 levels.
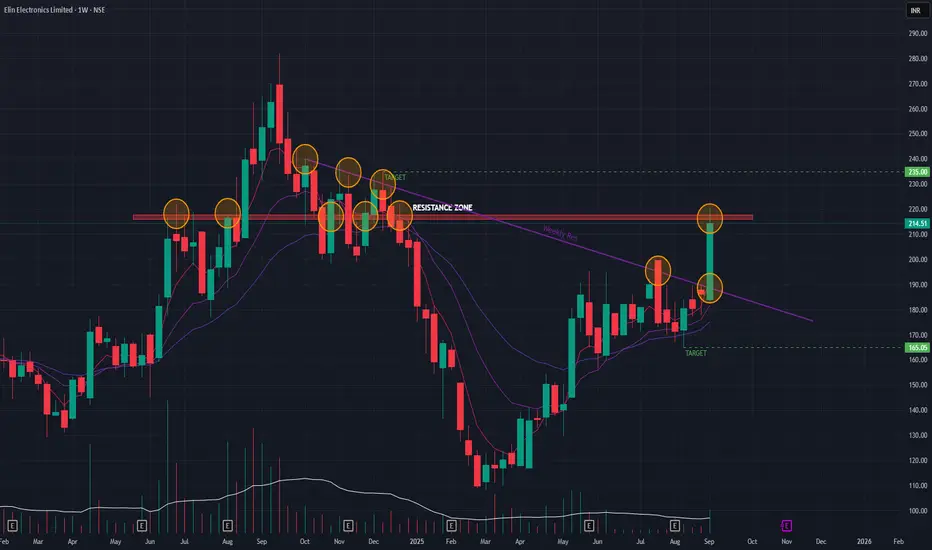
ELIN Electronics (Weekly Timeframe) - Potential BreakOut & ATH??ELIN was at an All-Time High (ATH) in Sept 2024, ever since it has been in a downtrend till Mar 2025. The stock has been on a bullish reversal since then and has broken out of a major angular resistance trendline after several attempts. Last week, it also BrokeOut of a major horizontal resistance zone. The stock surged by 15.19% with above-average volume. The Short-term EMAs are still in a Positive Cross-over state, signaling a bullish trend.
If the stock is able to sustain the uptrend during the coming week, then it may reach 235 levels & thereafter target new ATH. On the downside, it may reach 165 levels considering some profit booking.
Price-action is to be monitored!!!
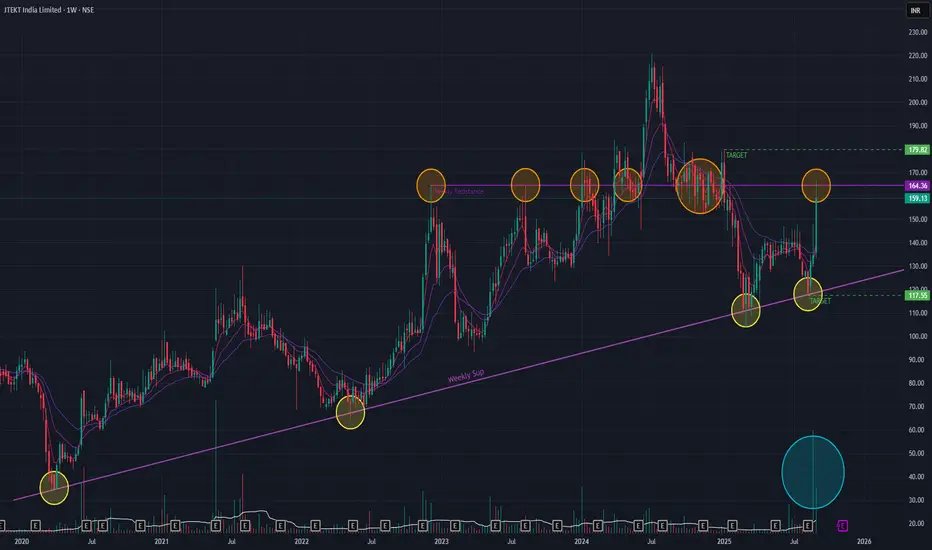
JTEKT India Ltd (Weekly Timeframe) - Potential ATH ??JTEKT is on an uptrend and have been respecting the support trendline as indicated. Since Dec 2022, the stock made several attempts to BreakOut of a major resistance zone and was successful once in Breaking Out and making an All Time High (ATH) in Jun 2024. As of last week the stock surged by 18+ % with huge volume. During this process the short-term EMAs did a positive cross-over. All of these are bullish signals.
During the coming week, if the stock is able to showcase bullish price-action then the stock may reach 179 levels. In a profit booking scenario, we may see the stock go down to 117 levels.
Keep watching for next week's price-action.
Motherson Sumi Wiring - Double Bottom & Head & Shoulder PatternMotherson Sumi Wiring is looking for a 50% jump from current price. Following are the factors:
Technical Analysis:
1. On weekly time frame, it is making a Double Bottom Pattern
2. On Weekly time frame it is making a Head & Shoulder Pattern
3. A confluence point along with strong weekly candle will take this price upwards
Fundamental Analysis:
1. Strong player in harness wiring
2. Supplying in top 10 automobile models - auto sector is in strong uptrend
3. New factories - Haryana, Pune and Gujarat - already clocked 200cr from these green field projects
A must in your portfolio.
Keep following @Cleaneasycharts as we provide "Right Stocks at Right Time at Right Price"
Cheers!!

How 21 EMA saves you from market correction?Green colour - 21 EMA
Blue colour - 50 EMA
The leaders during this time become choppy

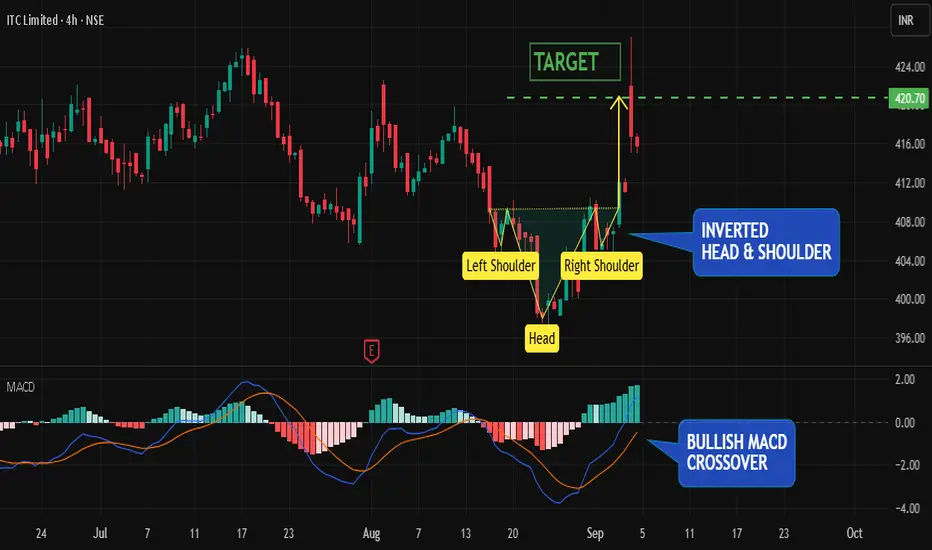
ITC Breaks Higher on Inverted Head & Shoulders Breakout-> Inverted Head & Shoulders Pattern -
ITC recently completed an Inverted Head & Shoulders formation , a strong bullish reversal pattern. The breakout above the neckline signaled renewed buying interest, and recent price action confirmed that momentum with a decisive upward move.
-> Bullish MACD Crossover -
Adding strength to the breakout, the MACD line crossed above the Signal line few days back, confirming a bullish crossover. This technical indicator reinforces the positive sentiment and indicates strong momentum building in favor of the bulls. The combination of pattern breakout and indicator alignment explains recent upward surge.
=> NOTE -
Bullish momentum of this pattern is over as target has been reached
Coal India – Breakout or Fakeout at Key Resistance?Chart Context
Coal India has been stuck inside a descending channel, completing what looks like a W–X–Y corrective structure. The recent surge has now brought price face-to-face with the MA100 and MA200 , both acting as strong resistances.
What the Chart Shows
MA100 & MA200: Price is testing these moving averages. Sustained strength above this zone is needed to confirm a real breakout.
Volume: A noticeable spike has supported the latest move, which adds credibility to the attempt.
RSI: Momentum has crossed above 50, shifting the bias, but confirmation requires follow-through.
Neutral Stance
At this stage, the setup can go either way. A clean breakout and hold above the MAs could mark the start of a fresh impulse. Failure to sustain would make this just another bounce inside the corrective structure.
Takeaway
It’s a wait-and-watch situation. Let the next few sessions decide whether this is the start of a new trend — or just a fake breakout.
Disclaimer: This analysis is for educational purposes only and does not constitute investment advice. Please do your own research (DYOR) before making any trading decisions.

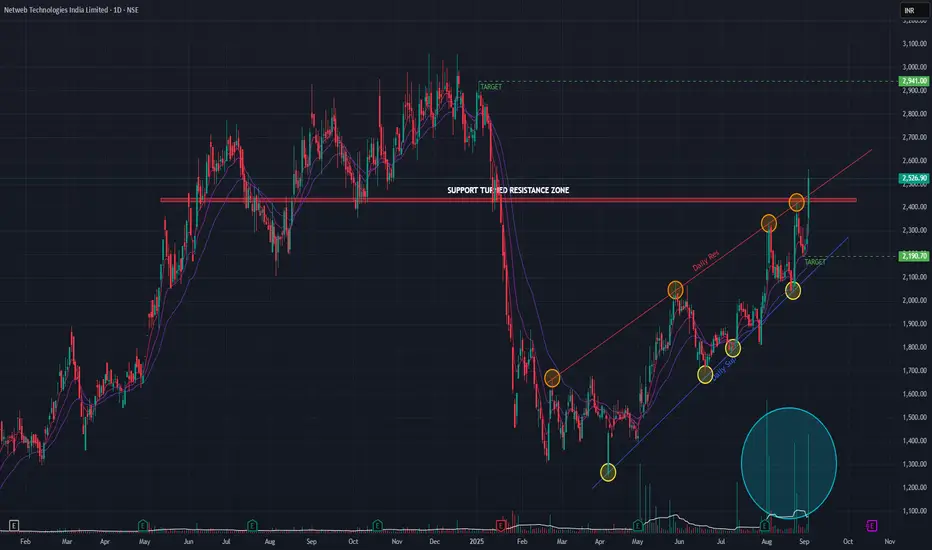
Netweb Tech (Daily Timeframe) - bullish signs ??Netweb has been on an uptrend since Feb 2025 and today it breached a key support turned resistance zone with huge volume. With a +11.48% gain combined with huge volume, the stock also breached the angular resistance trendline as indicated. Short-term EMAs are in positive cross-over state indicating bullish signs.
The recent quarter earnings are also positive for the stock.
If the uptrend momentum continues, then we may see the stock go upto 2940 range. On the downside it may go to 2190 range. The price action on the coming days would be key.
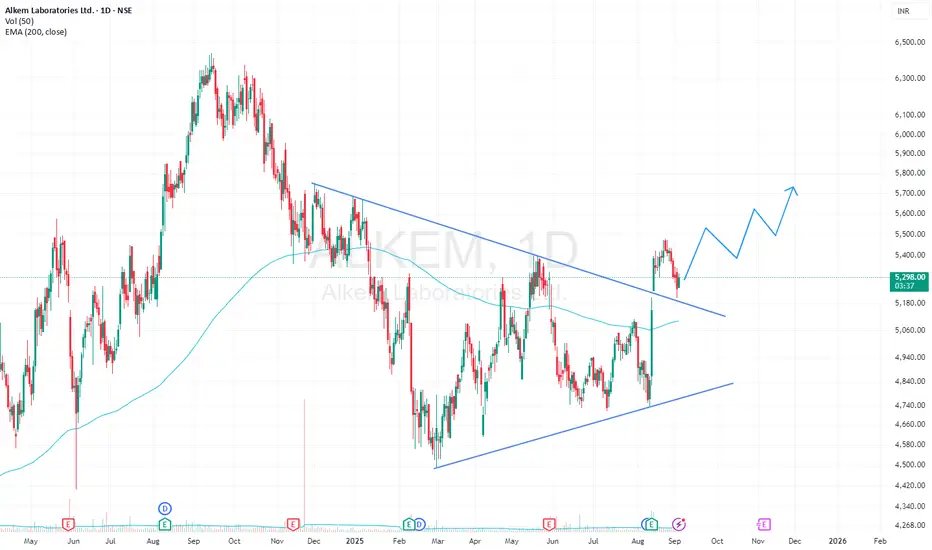
ALKEM Triangle BreakOutAlkem labs has given a breakout from Triangle pattern on 1D timeframe with high volumes. It is apparently retesting the resistance trendline. The stock is also trading above its 200 EMA.
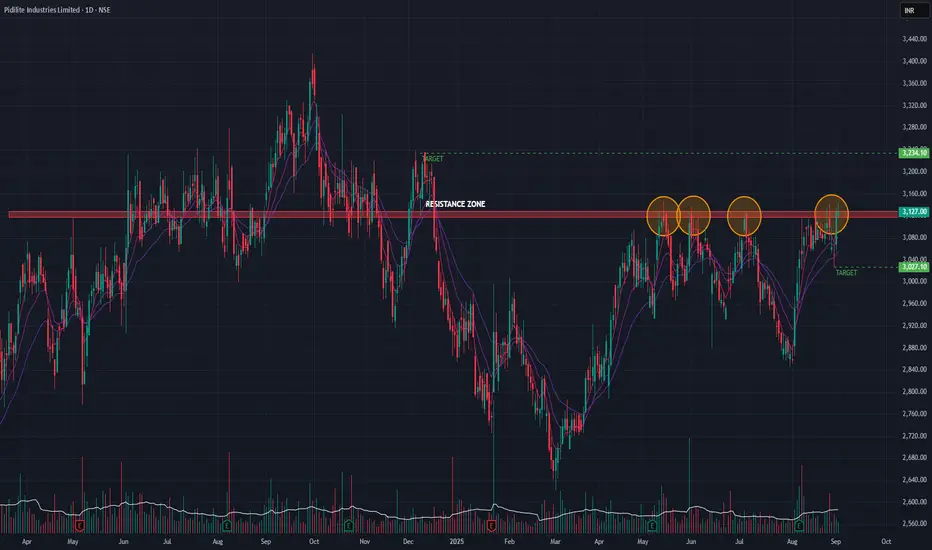
Pidilite Industries (Daily Timeframe) - Potential BreakOut??Pidilite, though with good earnings in the past quarter has not been able to BreakOut of the support turned resistance zone. Few attempts has been made but none of them were successful. The recent past, the stock has been making Equal Highs and Higher Lows. Volume has been decent though. Short-term EMAs are in Positive Cross-Over state.
On upside, the target may be around 3234 & on downside it may go upto 3027.
Monitor the price action in the coming days.
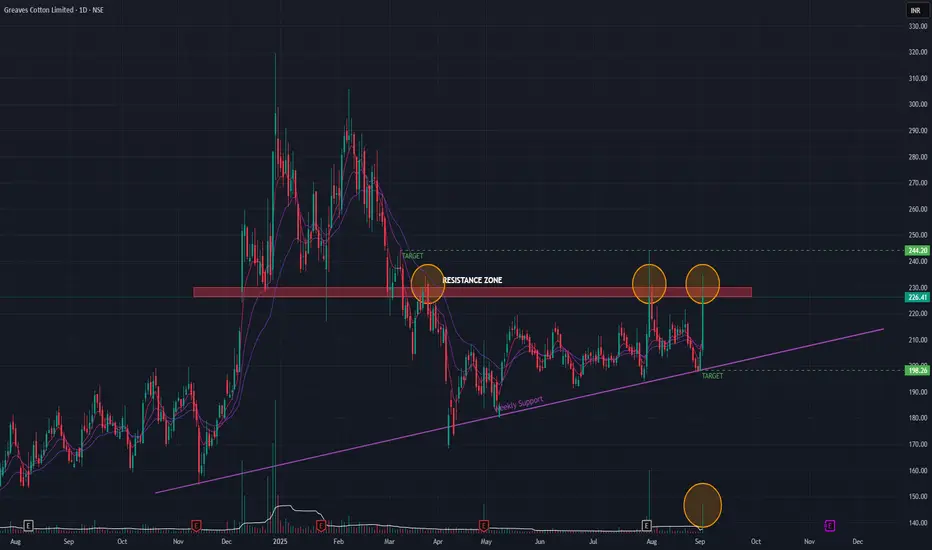
Greaves Cotton (Daily Timeframe) - Will it BreakOut or Not?Greaves Cotton since it's Double-Top formation has been in a downtrend. A key support level has become a resistance zone, which it's been trying to BreakOut few times. The stock has been forming Higher Lows for a while now. Few attempts to BreakOut has been futile. The recent BreakOut attempts been with huge volume spikes. Short-term EMAs are in positive cross-over state.
If it's able to BreakOut then the possible upside target is around 244. If not, we can expect the stock to go down to 198 levels.
Keep monitoring.
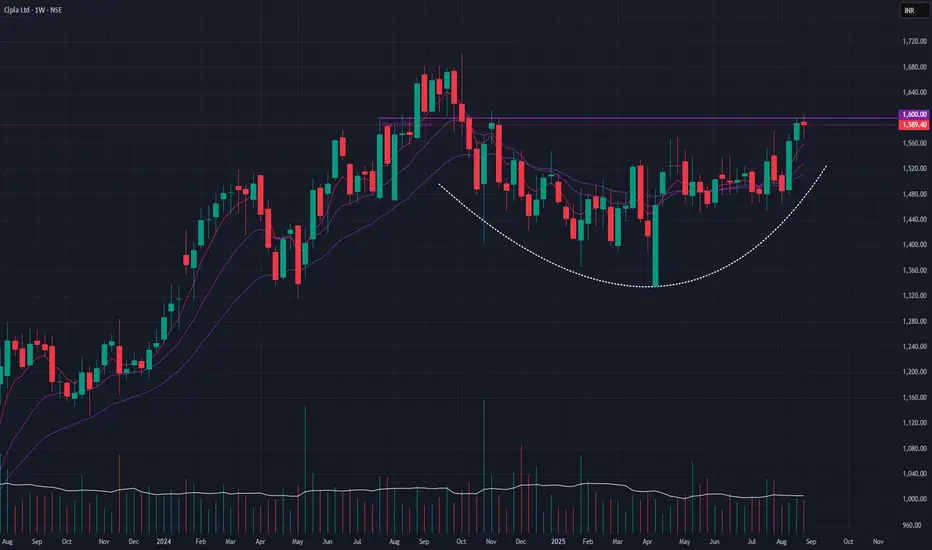
CIPLA (Weekly Timeframe) - Can it breakout ??Cipla has been in an accumulation stage for a while. Few attempts to breakout of the 1600 zone has not been successful. With EMAs in positive cross-over state, the stock looks to breakout of this key resistance zone. The volume is also OK in the past few weeks.
To be monitored on how it goes in the coming weeks.
Hammer Candlestick Reversals - Bullish & Bearish Setups🔹 Intro / Overview
In this idea, we focus on the Hammer candlestick pattern — both Bullish and Bearish variations.
The Hammer is a powerful reversal signal formed with a small body, a long shadow, and defined highs/lows.
When combined with EMA High–Low Band Confirmation and swing structure, it creates rule-based trading opportunities with clear validation and devalidation rules.
---
📖 Bullish & Bearish Hammer Intro
🟢 Bullish Hammer → Appears after a downtrend / at swing low . Buyers step in strongly, rejecting lower prices.
- EMA Band should be above the candle.
- Candle High = Validation line.
- Candle Low = Devalidation line.
- Entry → Close above the High.
- Stop-Loss → Candle Low.
- Target → 1x risk, with remaining lots trailed (ATR, Fibonacci, Box Trailing).
🔴 Bearish Hammer → Appears after a uptrend / at swing high . Sellers take control after rejecting higher prices.
- EMA Band should be below the candle.
- Candle Low = Validation line.
- Candle High = Devalidation line.
- Entry → Close below the Low.
- Stop-Loss → Candle High.
- Target → 1x risk, with remaining lots trailed.
---
📌 How to Use
🟢 Bullish Hammer Spotted
- Validation → Close above the Hammer’s high.
- Devalidation → Close below the Hammer’s low. (before validation)
- SL → Hammer Low.
- Target → 1x risk, remaining lots trail with ATR/Fibonacci.
🔴 Bearish Hammer Spotted
- Validation → Close below the Hammer’s low.
- Devalidation → Close above the Hammer’s high. (before validation)
- SL → Hammer High.
- Target → 1x risk, remaining lots trail with ATR/Fibonacci.
---
🎯 Trading Plan
- Entry → On validation close (Bullish above High, Bearish below Low).
- Stop Loss → Defined by Hammer candle (Low for Bullish, High for Bearish).
- Target → First TP = 1R, Remaining lots trailed for extended moves.
---
📊 Chart Explanation
1️⃣ 🟢 Bullish Hammer Spotted
- Candle validated as price closed above the high.
- 🎯 Target 1 achieved, remaining lots managed with trailing methods. Trailing Exit could be at swing top with best trailing
2️⃣ 🛑 Bearish Hammer →
- Candle validated as price closed below the low.
- 🎯 Target 1 achieved, remaining lots managed with trailing methods. Trailing Exit could be at swing bottom with best trailing
3️⃣ 🛑 Bearish Hammer →
- ❌ Devalidated
- Candle devalidated as price closed above the high.
4️⃣ 🛑 Bearish Hammer →
-Candle validated as price closed below the low.
⛔ Stop-Loss hit
- stop loss ensures risk management and discipline in trading.
5️⃣ 🛑Bearish Hammer →
-Candle validated as price closed above the low.
- 🎯 Target 1 achieved, remaining lots managed with trailing methods. Trailing Exit could be at swing bottom with best trailing
---
👀 Observation
- Bullish Hammer → Works best after prolonged downtrend at support zones.
- Bearish Hammer → Stronger after extended uptrends or near resistance zones.
- EMA Band → Confirms market bias and filters false signals.
- Risk Management → Defined SL + structured TP protect capital and maximize reward.
---
❗ Why It Matters?
- Clear rules: Validation, Devalidation, Entry, SL, and TP.
- Combines price action (Hammer) with EMA Band confirmation.
- Ensures disciplined trading instead of emotional decisions.
- Allows both conservative and aggressive management via trailing.
---
🎯 Conclusion
The Bullish & Bearish Hammer patterns, when combined with EMA High–Low Band confirmation, provide a structured reversal trading strategy.
By following strict entry, SL, and TP rules, traders can filter false setups and capture strong reversals at swing highs and lows.
🔥 Patterns don’t predict. Rules protect. 🚀
---
⚠️ Disclaimer
For educational purposes only · Not SEBI registered · Not a buy/sell recommendation · Not financial advice — purely a learning resource.

Bearish Hammer with EMA High-Low Band - Rule Based Entry 🔹 Intro / Overview
The Bearish Hammer candlestick is a signal of potential downside reversal.
It forms when buyers push price higher, but sellers regain control and close the candle near its low.
When combined with EMA High–Low Band confirmation, it creates a disciplined setup to identify short trade opportunities with clear rules.
---
📖 How to Use
✅ Validation → A valid signal occurs when the close price is below the low of the Bearish Hammer.
❌ Invalidation → If the close price crosses above the high of the Bearish Hammer, the signal is invalid. (Before validation )
EMA Band Confirmation:
- The Bearish Hammer must be above the EMA High–Low Band.
- The EMA High-Low band should not touch the Bearish Hammer.
- This ensures the setup aligns with bearish conditions.
✅ Bearish Hammar High must be swing high
---
🎯 Trading Plan
Entry → Enter short when the close price is below the Hammer’s low (validation line).
Stop-Loss (SL) → The high of the Bearish Hammer candle(Swing High)
Target (TP):
- First Target → 1R (equal to the risk defined by Entry–SL distance).
- Remaining Lots → Trail using ATR, Fibonacci levels, Box Trailing, or structure-based stops.
---
📊 Chart Explanation
- The Bearish Hammer shows rejection of higher prices, with a small body near the low and a long upper shadow.
- The EMA High–Low Band sits below the candle, and the Hammer forms above the band (no touch), confirming the setup.
- Validation occurs when the next close is below the Hammer’s low.
- Invalidation occurs if price closes above the Hammer’s high(before Validation)
---
👀 Observation
Bearish Hammer Behavior → Most effective after an uptrend or at resistance zones.
EMA Role → Ensures trade alignment with broader market bias.
Risk Management → SL above Hammer high, TP at least 1:1, with trailing options for extended downside moves.
---
❗ Why It Matters?
- Shows buyers losing strength.
- Sellers step back in and dominate.
- EMA Band ensures cleaner filtering of weak signals.
- Provides a strict framework for entry, SL, and targets.
---
🎯 Conclusion
The Bearish Hammer, combined with EMA High–Low Band confirmation, creates a structured short setup.
Using strict validation, devalidation, and risk management, traders can filter false signals and ride potential bearish moves with confidence.
🔥 Patterns don’t predict. Rules protect.
---
⚠️ Disclaimer
For educational purposes only · Not SEBI registered · Not a buy/sell recommendation · Not financial advice — purely a learning resource.

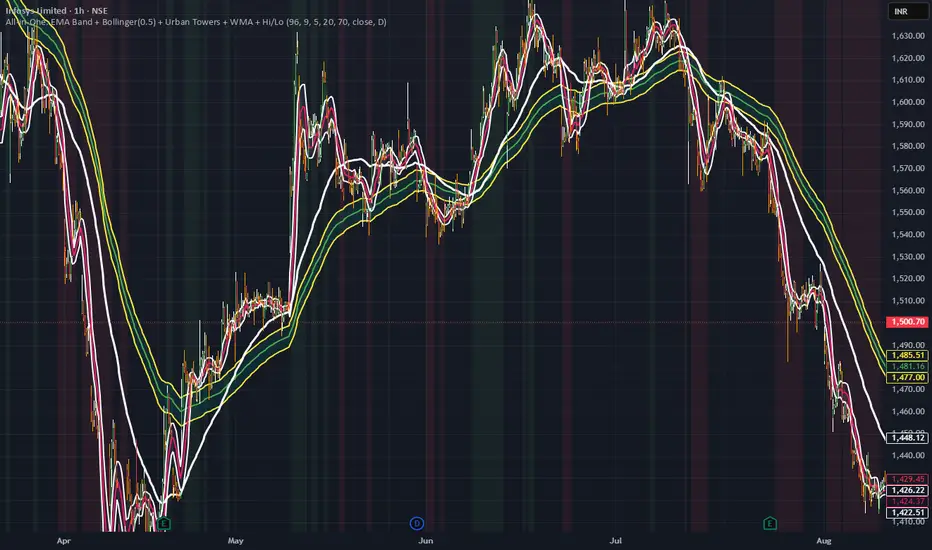
Market’s Current Crowd – Why SD 0.5 Matters with 96WMAEvery candle on the chart is a footprint of the crowd.
Some are footprints of long-term investors, others of restless scalpers, and in between lie the majority — the current active population.
Most traders look at Bollinger Bands with ±1 SD or ±2 SD. But here’s the catch:
±1 SD (68% zone) is too wide, it includes noise that the current crowd may not actually be trading.
±2 SD (95% zone) often shows overreactions — moments that only a small, emotional part of the market touches.
🔹 This is why 0.5 SD is powerful.
It captures the true heartbeat of the current population — the majority of trades happening right now.
Instead of focusing on the extremes, it filters the chatter and shows us where the real action is.
Importance of 96WMA:
Above it, the active crowd is leaning bullish, even if short-term noise distracts.
Below it, the weight shifts bearish.
Together, 0.5 SD + 96WMA forms a map — the pulse of the market (0.5 SD) laid against the backbone of trend (96WMA).
The market is not moved by everyone at once, but by the dominant population of the moment.
By tracking SD = 0.5, we see that population more clearly than any other band width.
Combine it with the quiet guide of 96WMA, and we stop guessing the crowd’s mood — we start seeing it.
DMART BREAKINGLONG TERM RESISTANCE WEEKLYDMART breaking long time resistance on weekly chart
huge volume, bullish RSI above 60
trading above 20 ema
GST Reform effect
target1 4900 target2 5400
sl 3900 use ur own sl
NO BUY/SELL RECOMENDATION
