DMART BREAKINGLONG TERM RESISTANCE WEEKLYDMART breaking long time resistance on weekly chart
huge volume, bullish RSI above 60
trading above 20 ema
GST Reform effect
target1 4900 target2 5400
sl 3900 use ur own sl
NO BUY/SELL RECOMENDATION
Moving Averages

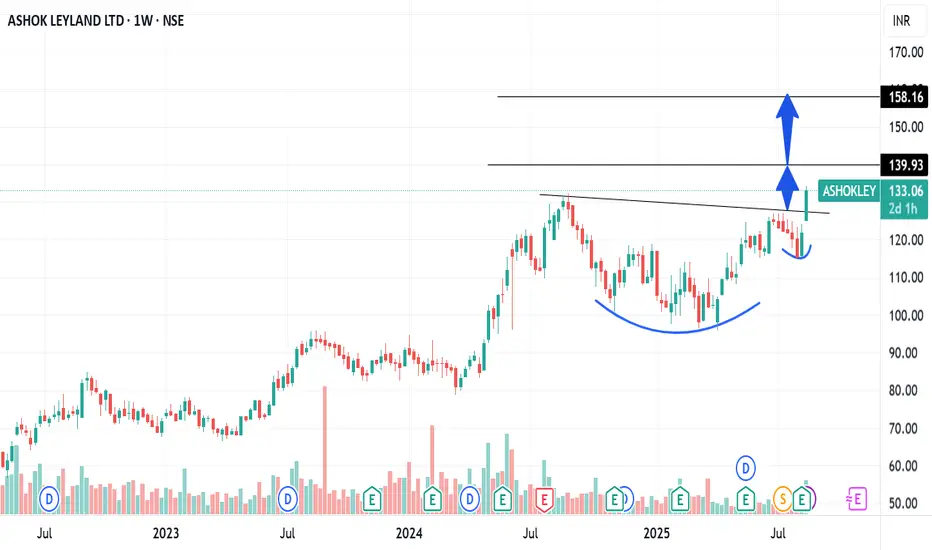
ASHOKLEYLAND C&H PATTERN BREAKOUTAshokleyland breaking C&H pattern weekly basis
with huge volume this week
bullish RSI above 60
trading above 20 ema
#target1-140, #target2- 158
sl- 115 auto sector in focus
NO BUY/SELL RECOMENDATION
Inv Head and Shoulder in Supreme industriesVery good reversal in supreme industries.
It can reach nr All time high.
This has also bounced nr weekly 200ma
Since it is spotted on weekly targets can come in 4~6 months time.

Adani Ports Maintains Bullish Momentum, Nears Resistance at Key Topic Statement:
Adani Ports is riding strong bullish momentum after rebounding from a key retracement level, now approaching stiff resistance near a distribution zone.
Key Points:
1. The stock retraced up to the 50% Fibonacci level and has since moved up to the 23.6% level, showing renewed strength
2. Price faces stiff resistance at the 1500 mark as it enters a known distribution zone
3. The stock rarely trades below the 200-day EMA, and such dips have historically offered excellent accumulation opportunities

Nifty swing Pullback Failure 15mins Hello,
Nifty again bounce from previous low/support levels of 24350 to high of 24700 and pullback is failed and falled again CMP 24510 ......50SMA support and RSI adjusted from overbought also more than 50% retracement near by 61% reatrce making it good Pullback Reversal Set up for swing+postional

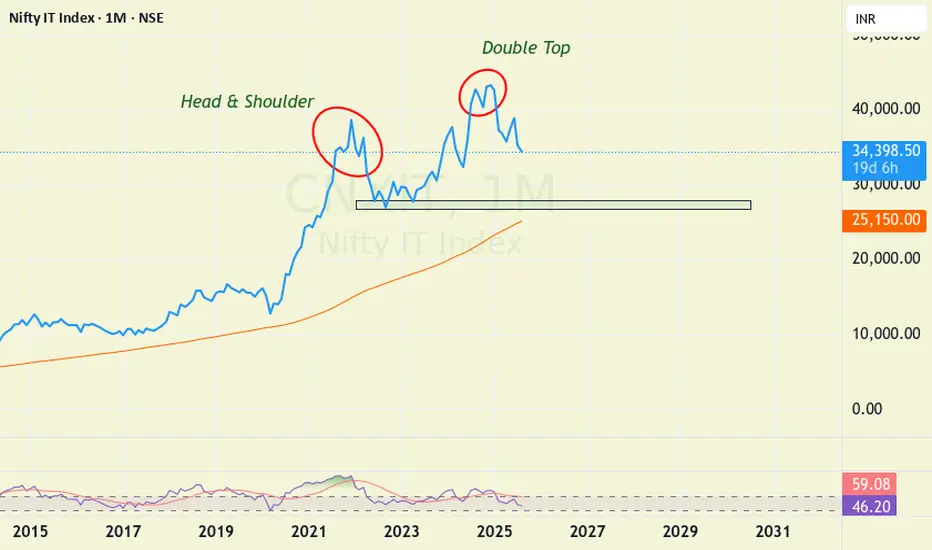
Bearish patterns in Nifty ITOn monthly we see multiple bearish patterns in IT index.
Over long term we can see that this index takes support near 100 SMA on monthly.
Currently this index is in down trend and in worst case can see support nr 29000 levels. Which also coincides with earlier buying zone.
I would avoid IT till I find some good bottoming out pattern.
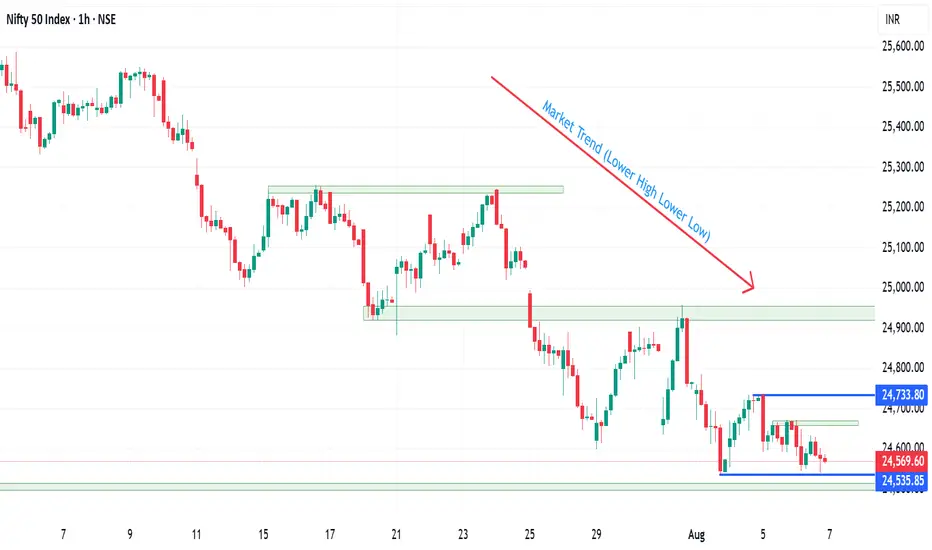
Expecting a nice move on Nifty weekly expiry 07/08/2025.Nifty for the last three days is forming an inside candle, chances of it moving either side is high.
If the market starts trading below 24510, it may test the pervious support around 24230 and another levels below it.
On the higher side, trade can only be initiated only once 24650 levels are taken out.
In case of a gap down wait for the retest of the support zone that will act as the resistance now. Enter trade only once the setup triggers.
Major resistance levels :- 24660, 24733
Support levels :- 24500 (psycological level), 24228
Hourly Moving averages are above the closing price while the Daily 100 EMA is around the closing leves, which can act as the support else it can come to test the 200 EMA (24200).
Wait for the price action near the levels before entering the market.
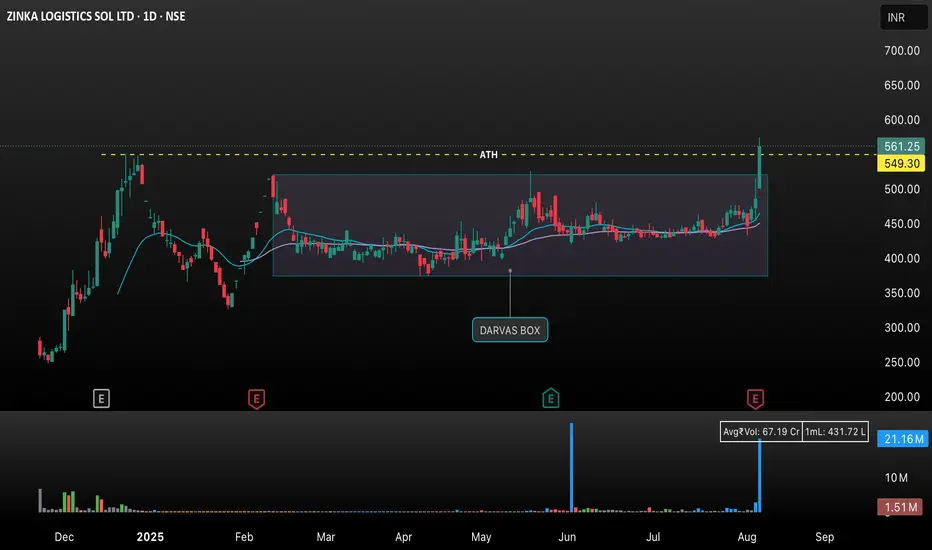
Zinka Logistics Sol Ltd : Daily Chart Breakout from Darvas BoxThis chart shows the daily price action of Zinka Logistics Sol Ltd (NSE) with a focus on recent technical developments:
• Darvas Box Pattern: For several months, the stock price traded sideways within a well-marked “Darvas Box” range, approximately between ₹400 and ₹549.30. This represents a consolidation phase where the stock found both support and resistance within this zone.
• All-Time High Resistance: The yellow dashed line at ₹549.30 marks the previous all-time high (ATH) level, acting as a critical resistance point.
• Breakout and Volume Surge: On the latest trading day, the stock price sharply broke above the ATH resistance, closing at ₹561.25—a gain of 15.66%. This move was supported by a significant spike in trading volume, as shown at the bottom of the chart, which reinforces the breakout’s strength.
• Bullish Signal: Such a breakout from a long consolidation within a Darvas Box, particularly on elevated volume, is typically interpreted by traders as a strong bullish signal, suggesting the start of an upward trend.
• Indicators: The chart also includes a moving average line (light blue) that underscores recent momentum and trend direction.
UltraTech Cement Rides Strong Bullish Channel, Eyes Breakout BeyTopic Statement:
UltraTech Cement continues its bullish run, driven by consistent growth and cement’s critical role in construction-led demand.
Key Points:
1. The stock moves strictly within a well-defined uptrending channel, making it highly suitable for channel-based trading
2. It rarely dips below the 200-day EMA, and prices near this level have historically presented strong investment opportunities
3. The price is currently facing resistance at the 12000 mark, but a weak breakout appears to be underway, signaling potential continuation

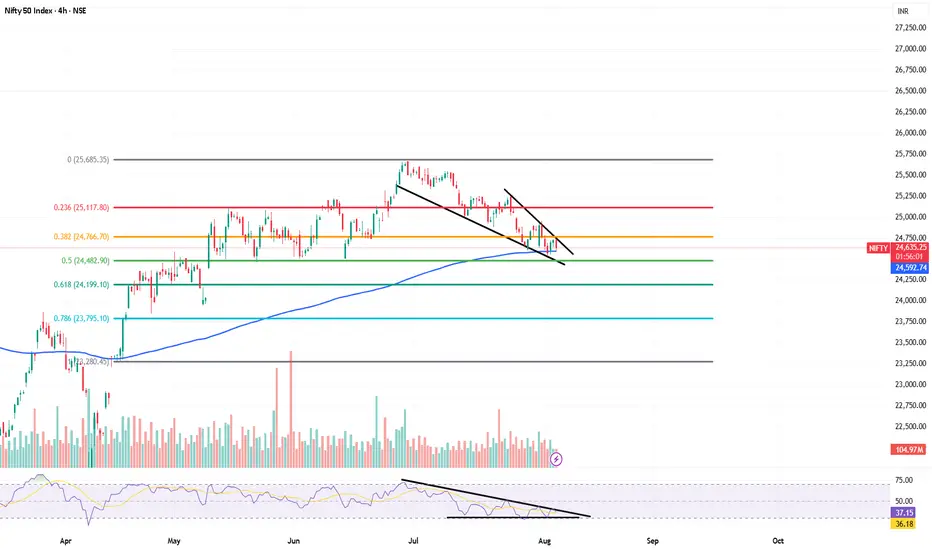
Nifty Bullish Confluence Set up ( Swing+ positional)Hello,
Nifty spot 24610 from low of 21780 made high around 25650 april to june in 2 months now Its retrace to 24600 i.e almost more than 50% retracement another is RSI squezze with bullish divergence in lowertimeframe with EMA 200 support and making pattern of falling wedge .
expecting bullish reversal set up for new lifetime high possibilties in next 2 months
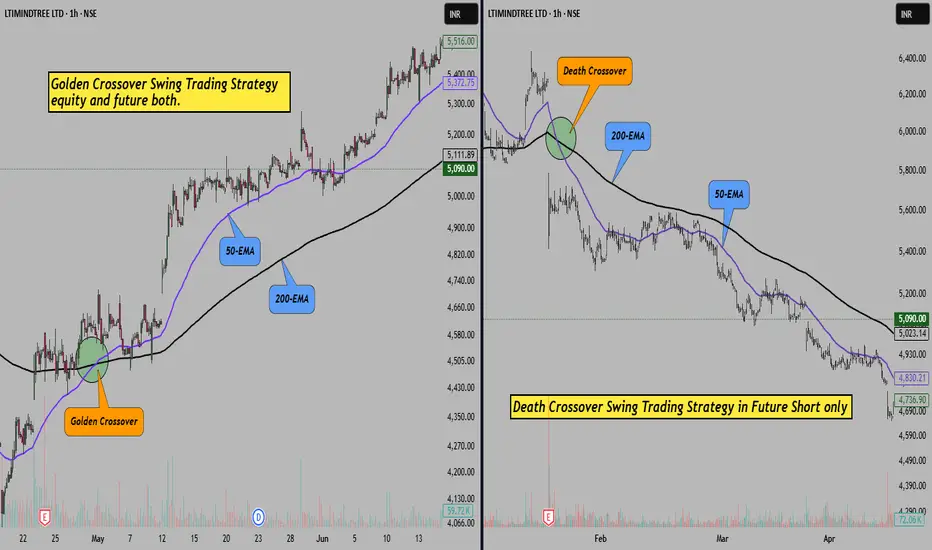
Golden EMA Setup – Catch Medium-Term Trends with 50 & 200 EMA!Hello Traders!
One of the simplest yet most powerful ways to identify long-lasting trends is by using moving averages. And among all combinations, there’s one that stands out for swing and positional trades, the Golden EMA Setup .
It uses just two tools: the 50 EMA and the 200 EMA. When used correctly, this setup helps you ride big trends and avoid choppy zones.
Let’s understand how this works and how you can apply it.
What is the Golden EMA Setup?
It’s a trend-following strategy based on the crossover of two EMAs:
50 EMA (Fast Average): Reacts quicker to price changes
200 EMA (Slow Average): Represents the long-term trend
When 50 EMA crosses above 200 EMA, it’s considered a Golden Crossover , a bullish signal.
When 50 EMA crosses below 200 EMA, it’s a Death Crossover , a bearish signal.
How to Trade This Setup:
Entry:
Buy when 50 EMA crosses above 200 EMA and price is above both.
Stop Loss:
Just below the 200 EMA or recent swing low.
Target:
Trail the stop loss and ride the trend till the crossover reverses or price weakens.
Timeframe:
Works best on daily or 1-hour chart for positional/swing trades.
Rahul Tip:
Golden EMA setup works great during trending phases, but avoid using it in sideways markets — you may get trapped in whipsaws. Always confirm with volume or RSI divergence before entering.
Did you ever used this strategy before, let me know in comment box.
LICI Shows Minimal Gains Since IPO, Moves Weakly Within Broad ChTopic Statement:
Nearly three years after its IPO at 870, LICI trades only slightly higher, reflecting the limited post-listing returns even for a market giant.
Key Points:
1. The stock is moving in a weak uptrending bullish channel, offering modest directional cues
2. It retraced to the 61.8% Fibonacci level where it received support and has since rebounded
3. Price now faces resistance at the 38.2% retracement level near 955, creating a ceiling for upward movement
4. Accumulating the stock below the 50-day EMA presents a more favorable risk-reward entry point

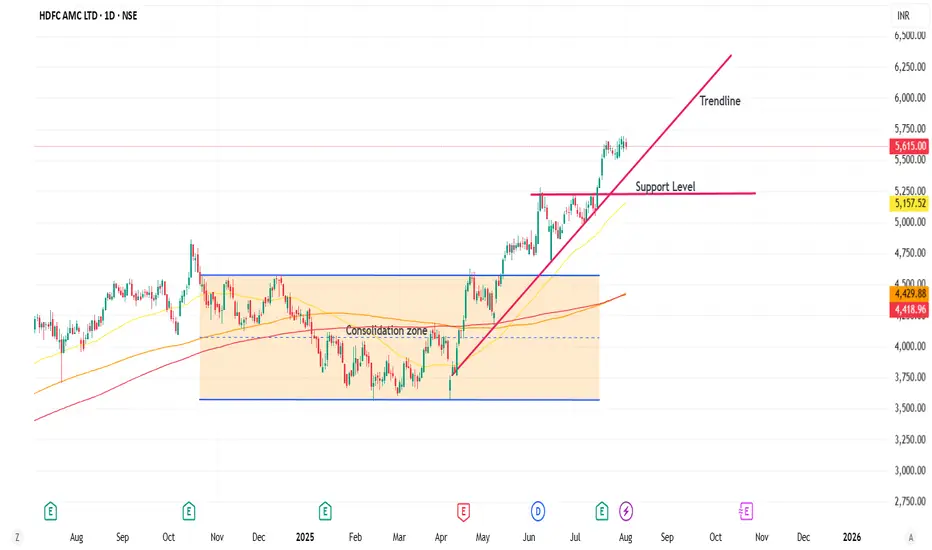
HDFC AMCThis analysis is intended solely for educational purposes and does not constitute financial advice.
The stock of HDFC Asset Management Company (HDFC AMC) is currently demonstrating a gradual upward trajectory following a breakout from a seven-month consolidation phase. This breakout signals renewed bullish momentum in the stock's price action.
Key technical indicators support this trend:
• ✅ Trading above major moving averages: The stock is positioned above the 200-day, 150-day, and 50-day moving averages, which typically indicates strong underlying support and a positive long-term outlook.
• ✅ Holding above a critical support level: This reinforces the bullish sentiment and reduces the likelihood of a sharp downside reversal in the near term.
Given these technical factors, there is a high probability of continued upward movement. However, it is essential to approach trading with caution. 📌
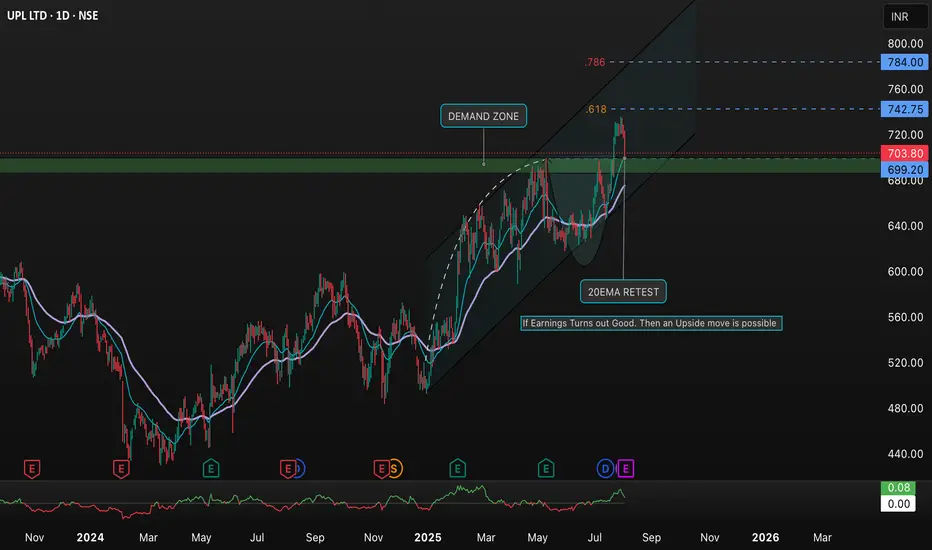
UPL LTD - Daily Chart Analysis with Demand Zone & Key ResistanceDescription:
This chart analyzes UPL LTD (NSE:UPL) on the daily timeframe. Key highlights include:
• Demand Zone: The chart marks a demand zone where buying interest is expected to be strong.
• Fibonacci Levels: Major resistance at the 0.618 and 0.786 Fibonacci retracement zones (around 720 and 784).
• Current Price Action: Stock is trading near 703.80, showing a recent pullback after testing higher levels.
• 20EMA Retest: The price recently retested the 20 EMA, a critical support.
• Upside Potential: Watch for an upside move if upcoming earnings turn out positive. Key upside targets: 742, 760, and 784.
• Strategy Note: Monitor the demand zone for support and watch for breakouts above resistance for potential bullish confirmation.
Ideal for traders looking to capitalize on support/resistance and trend-following strategies.
LT Jumps on Strong Q1 FY26 Results, Continues Steady Climb WithiTopic Statement:
LT surged nearly 6% after posting impressive Q1 FY26 earnings, reinforcing its position within a mildly bullish up-trending channel.
Key Points:
1. The stock may experience temporary bullish momentum driven by strong quarterly results
2. It continues to trade within a mildly bullish up-trending channel, making channel-based trading reliable
3. Two trend lines on the chart highlight the ongoing trend strength and underlying support for the stock
4. Since recovering from COVID in 2021, the price has consistently remained above the 200-day EMA, reflecting long-term bullishness

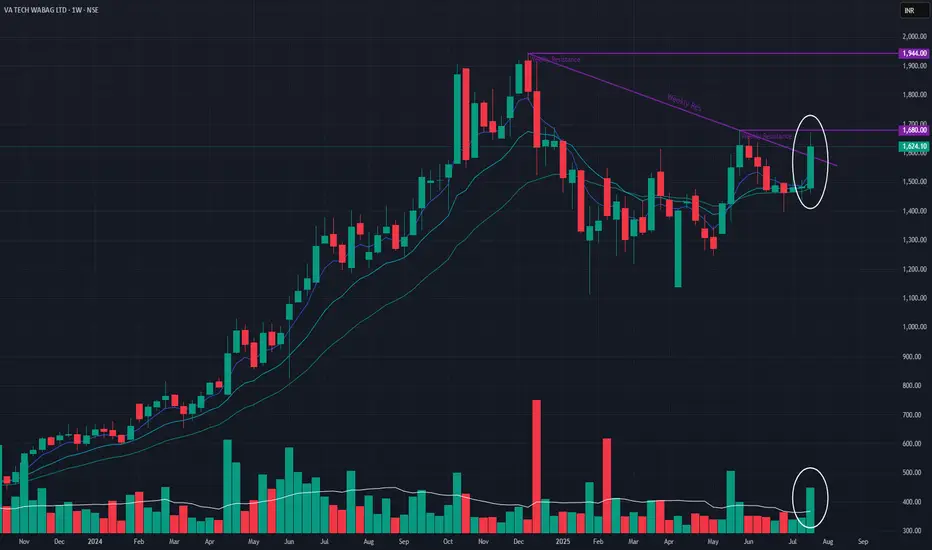
VA Tech Wabag Ltd (Weekly Timeframe) - Potential BreakoutOn weekly timeframe the stock has made-up for all those past 7 weeks of loss with a 9.30% gain with huge volume. The stock also BrokeOut of a longterm weekly angular resistance zone. The coming week if it can BreakOut of the short-term weekly resistance with some good volume, then it may go up to 1,944 in the near future , which is the ATH.
In Daily timeframe, a Golden Cross-over is formed as well, that suggests a bullish sign.
Keep monitoring the coming week's price action.
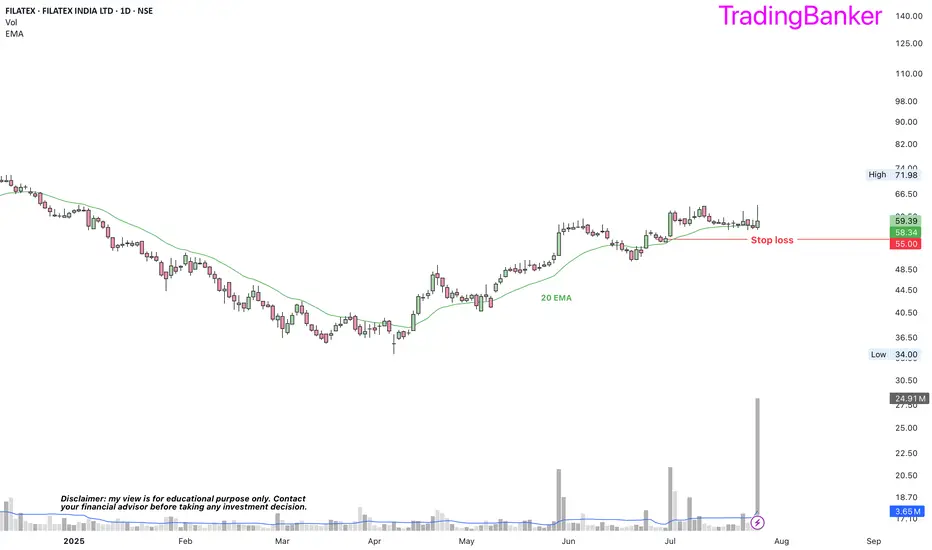
FILATEX: a probable long➡️decent RS rating
➡️improvement in EPS YoY, cash cycle and operating cash flow
➡️promoter holding at 65%
➡️trading above 20 EMA
➡️entered with a stop loss of 55
➡️huge volume spike
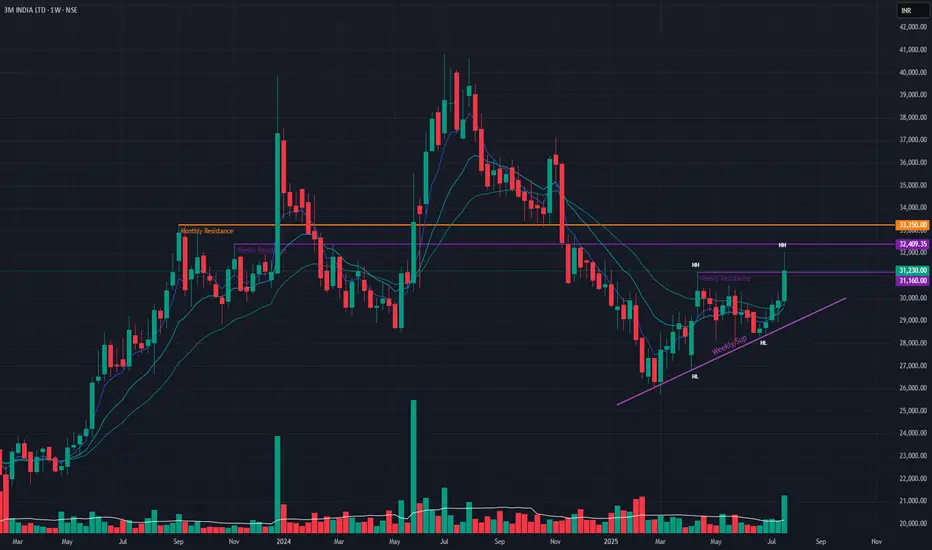
3M India Ltd (Weekly Timeframe) - Potential BreakoutPast few weeks, the stock has been in an uptrend and has breached the short-term weekly resistance during this week with HUGE VOLUME . Next target for the stock is to breach the weekly resistance zone near 32,405. During the week, a positive cross-over of EMAs has been established, indicating positive signs. With this week's bullish candle, the stock has made Higher Highs (HH) while breaching the short-term weekly resistance.
Keep a watch on the stock for next week.
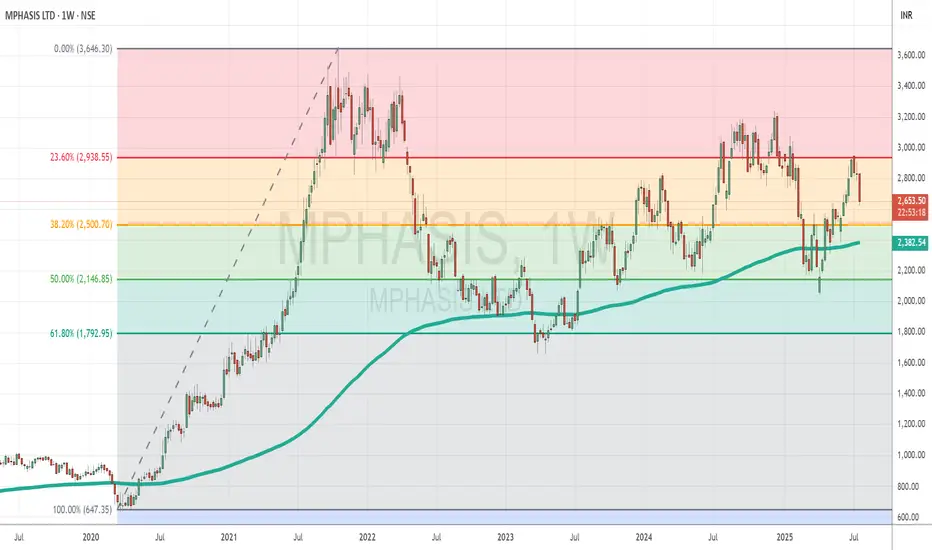
Mphasis Holds Strong Amid Weak IT Sentiment, Trading Between KeyTopic Statement:
Mphasis has shown resilience despite the broader weakness in the Indian IT sector, oscillating between strong support and resistance levels.
Key Points:
* The stock faces stiff resistance near 3000, with the 23.6% Fibonacci retracement level at 2938
* It receives strong buying support around 2000, with the 50% retracement level at 2146 acting as a critical floor
* The price rarely dips below the 200-day EMA, and such instances have historically presented attractive investment opportunities
Coforge Makes V-Shaped Recovery Post Crash, Eyes Resistance at DTopic Statement:
Coforge staged a sharp V-shaped recovery from the early 2025 market crash, rebounding off key support and approaching major resistance.
Key Points:
* The stock retraced to the 38.2% Fibonacci level at 1292 during the crash, where it found strong support
* A swift V-shaped recovery followed, with the price now facing stiff resistance at 2000, forming a double top
* Coforge generally trades above the 200-day EMA, making it a strong accumulation candidate when nearing that level

Angel One Struggles to Recover After Weak Earnings, Stuck in DowTopic Statement:
AngelOne remains under pressure after a sharp profit decline, trading within a downtrending channel as it struggles to regain bullish momentum.
Key Points:
* The stock is moving in a clearly marked downtrending channel, allowing for structured channel-based trading
* It received strong support at the 50% Fibonacci retracement level around 2000, helping limit further downside
* Price generally faces resistance above the 100-day EMA, which continues to cap any rebound attempts
* A breakout above the channel could signal a trend reversal, but the poor quarterly results may delay any significant upside move

Aarti Drugs Ltd (Daily Timeframe) - Potential BreakOutThe resistance zone (560-570) was breached only once , and thereafter, the stock was in a downtrend for a prolonged duration. Recent past, the stock has been forming Higher Lows & a buildup in volume in the past few days. The stock gained almost 19.5% over the last few days, assisted by huge volume. On Jul 15, the stock BrokeOut of a major resistance with huge volume, and today it tried to breach the long-term resistance.
The Short-term EMAs are in PCO state as well as a Golden Cross-over has formed few days back, which indicates further uptrend.
We should monitor the stock in the coming days for its price action to take a call.

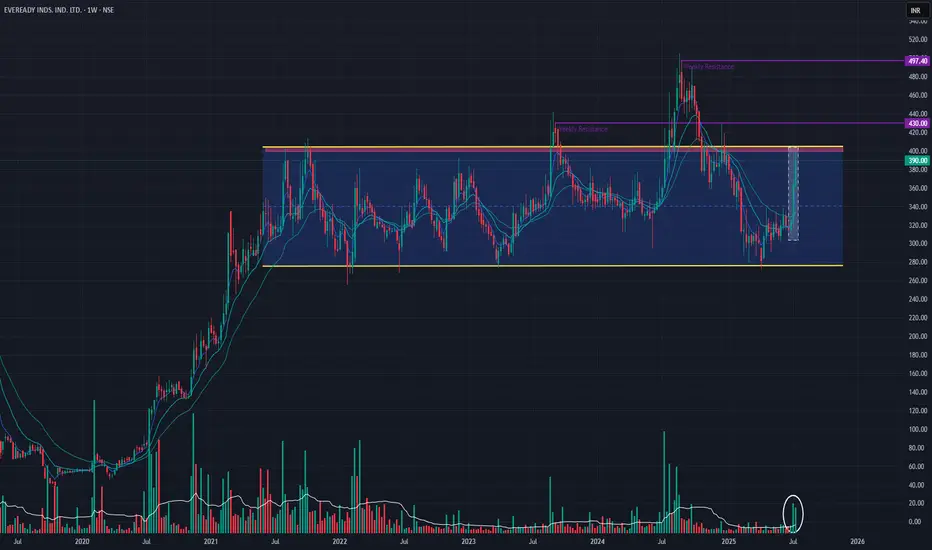
Eveready Inds. Ind. Ltd (Weekly Timeframe) - Potential BreakOutThe stock has been in a range since 2021, with couple of BreakOuts (2023 & 2024) which did not sustain momentum. Past 3 weeks the stock has gained appox: +29% with huge volume buildup . The short-term EMAs are in PCO state, indicating an uptrend . The stock may BreakOut of the resistance zone (398 - 406), if buyers show interest in the stock to take it further up.
Watchout for next week's price action!!