XAUUSD (Gold) Short term bearish biasLooking at a short term bearish side trade on XAUUSD, to take down the level after a continuous long rally from yesterday.
Multiple Time Frame Analysis

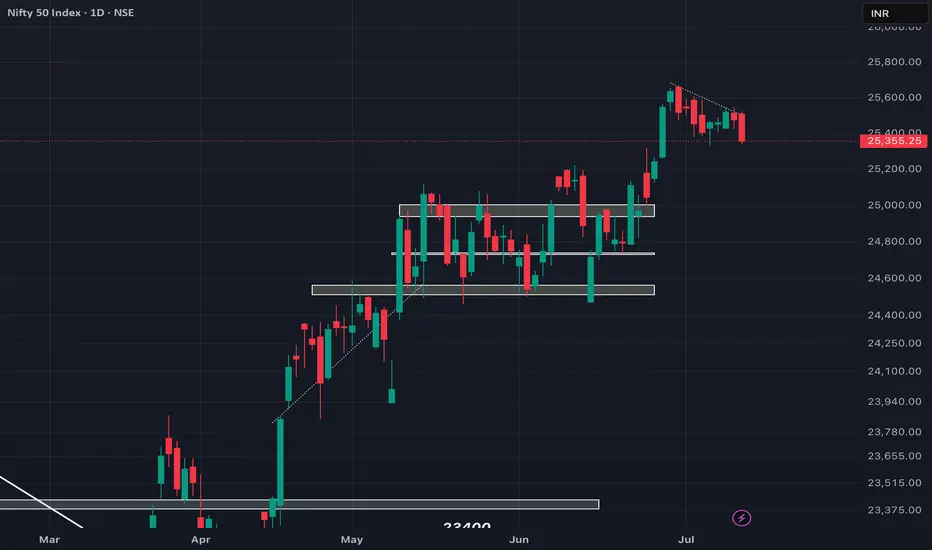
Nifty Support & Resistance Zones – 24th July 2025Based on today’s price action and high-probability cluster zones, here are the key levels to watch for tomorrow:
Resistance Zones:
25516 – 25523
25408 – 25410
25314 – 25317
25228
Support Zones:
25140 – 25150
25054 – 25060
24931 – 24939
24823 – 24864
Technical Outlook:
Nifty successfully broke above the 21 EMA of the Daily Timeframe, indicating a shift in short-term momentum back in favor of buyers. This breakout was supported by strong bullish candles and higher closes throughout the session.
As long as price sustains above 25140, the upward momentum may extend toward 25314 and 25408. A failure to hold above 25054 would weaken the structure and invite a retest of lower support zones.
Monitor price behavior around 25228 for intraday breakout or rejection opportunities.
Watch these zones closely for potential price reactions, breakouts, or reversals. Use them with intraday confirmation and volume analysis for effective trade setups.

SBI Short analysisLooking forward to entering short positions on SBIN, post confirmation. Once we do see a good enough push with volume, would be most likely an ideal confirmation to enter.

VIEW remain the SAME!! buying the dip!!NIFTY showed minor retracement but our view remains the same as market tends to move in wavy pattern and cannot move unidirectionally hence sticking with our plan would be most optimal so one should look for buying opportunity around demand zone if opens weak and stay strict with given SL so plan your trades accordingly and keep watching everyone.

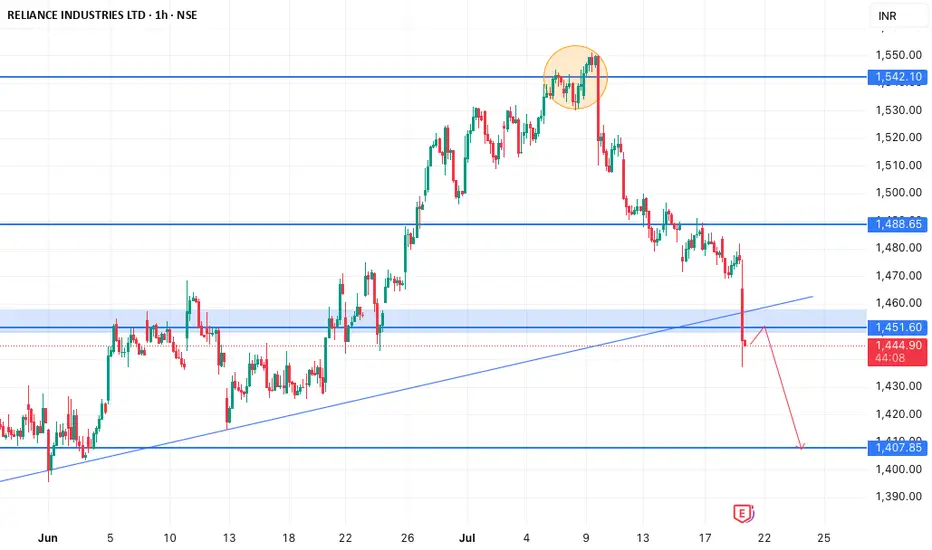
RELIANCE TECHNICAL SHORT BIASLooking forward on a short opportunity, technicals wise on Reliance, aligning with a major trendline breakout on the 4h and a major key level break to the downside. Expect a pullback/correction move to the nearest support-turned resistance level before the final impulse move to the downside.
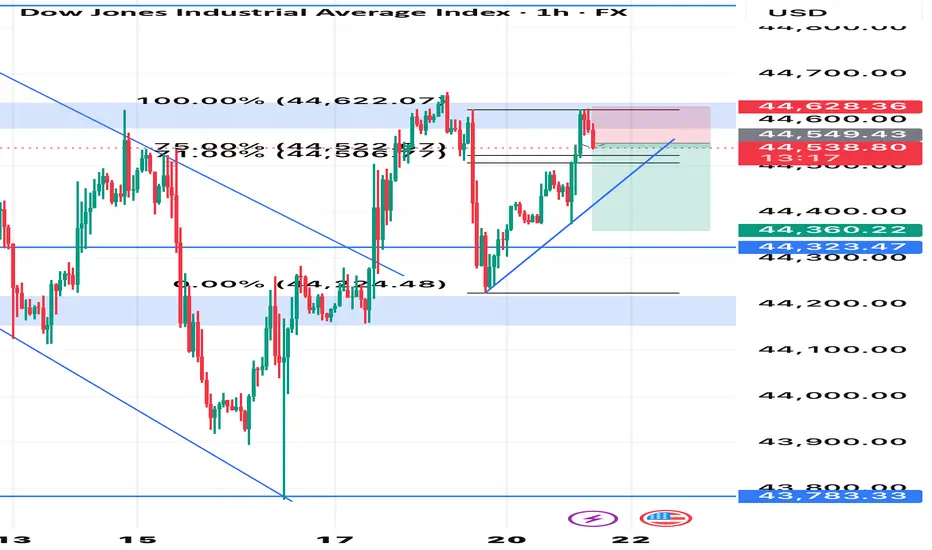
Potential sell side bias on US30Looking at a potential short position on US30, technicals confirming sell side trade while the day’s New York session move was bullish. Looking to enter shorts post confirmation.
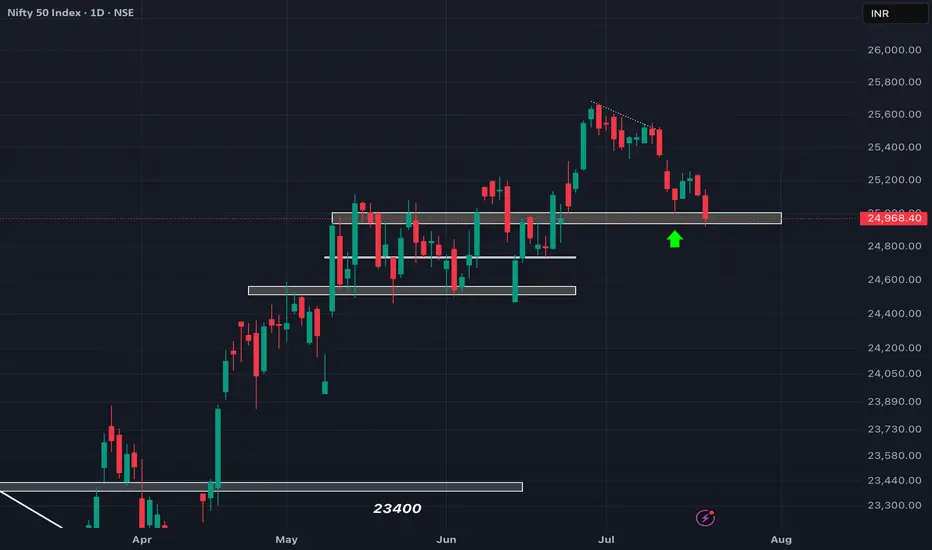
REVERSED as analysed! Will it sustain..?As we can see NIFTY reversed strongly exactly from our demand zone as analysed which is both a sign of REVERSAL we were looking for and confirmation of bullish bias. Hence one can plan going LONG from here with clear stoploss of candle's low closing basis. We can expect NIFTY to show 25250-25300 levels in coming trading sessions before facing any rejection so plan your trades accordingly and keep watching everyone

NIFTY should REVERSE from here!!Following our analysis, we can expect NIFTY to reverse from here and form a potential good green candle from here but for POSITIONAL one can wait for NIFTY to show signs of REVERSAL around this demand zone. Hence wait for confirmation as any sustainment below the given zone could change the overall trend so plan your trades accordingly and keep watching everyone.
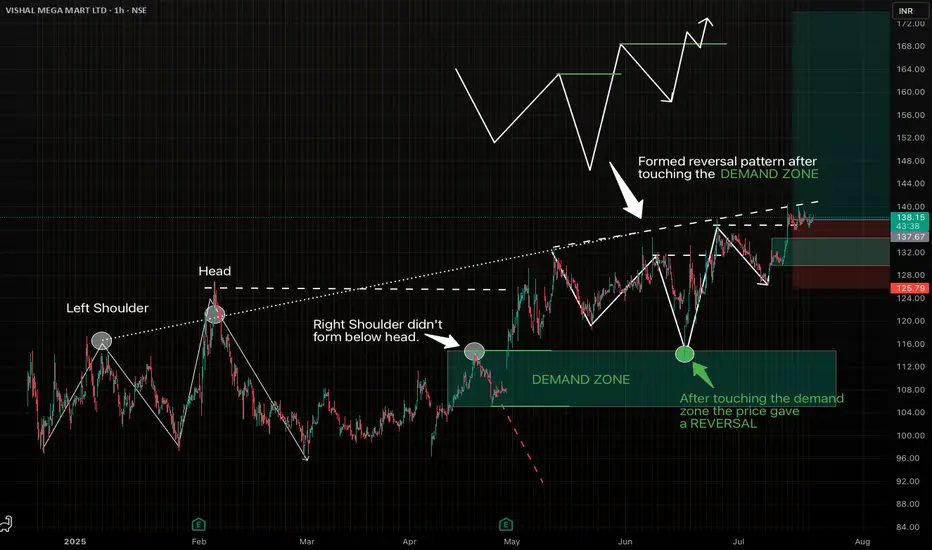
Strong reversal pattern on VMM. Looks good for swing trade.Spotted a beautiful setup on VISHAL MEGA MART LTD (1H Chart), following my favourite "Elevated Right Shoulder" pattern.
- The Left Shoulder and Head formed clearly.
- The Right Shoulder didn't go below the head, indicating ultra bullish structure and formed a demand zone.
- Price touched the Demand Zone and gave a perfect reversal.
-Clean entry with favourable risk-reward.
Let's see how it plays out.
We are still strong above 25000!!As we can see, NIFTY showed minor correction despite its rejection from important demand zone but we are still strong as long as we are above 25000 psychological level hence we should plan buying on every drip keeping stoploss below 25000 level closing basis so plan your trades accordingly and keep watching everyone.

EDELWEISS FIN SERVE LTD - BUY/LONG TRADEThere is bullish head and shoulder formation on edelweiss fin serve ltd. given breakout on daily time frame with supporting volume . one can look to buy if next candle hold above breakout candle high with mention target and without stoploss as i will update when to exit.

25500 coming soon in NIFTY!!As we can see despite the weakness shown in first half, NIFTY managed to RECOVER and closed in green showing immense buying pressure from our demand zone, Hence our view remains intact 0f BUYING the DRIP till 25000 level is respected. So plan your trades accordingly and keep watching everyone.

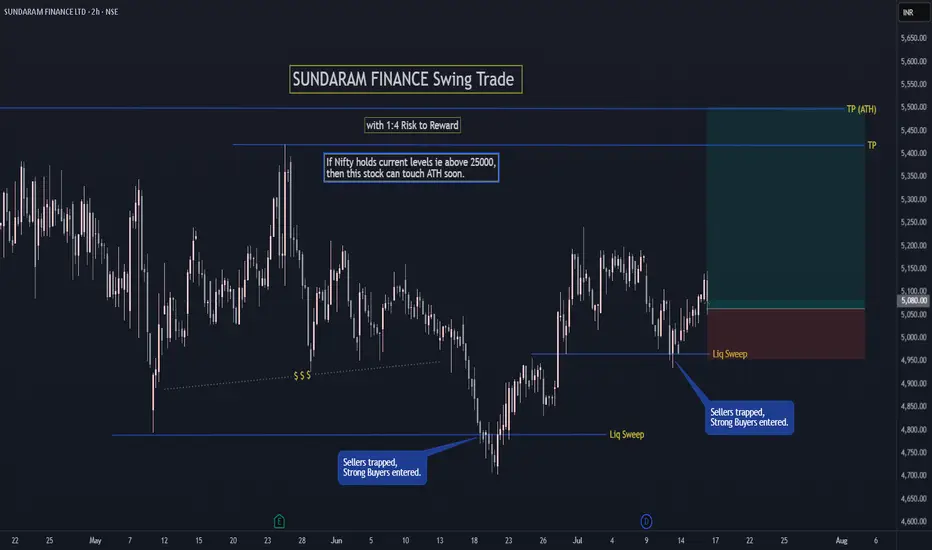
SUNDARAM FINANCE Swing TradeIf Nifty holds current levels ie above 25000,
then SUNDARAM FINANCE can touch ATH soon.
FOLLOW for more such simple swing setups.
Let me know in comments if you have any doubt or questions.
Exact REVERSAL from our demand ZONE!!As analysed NIFTY showed more than 200++ points REVERSAl from our demand zone, now our view has been changed from selling the highs to buying the dips unless NIFTY breaches 25000 level and sustains below which could be our SL hence any dip could be a buying opportunity from here so plan your trades accordingly and keep watching everyone.

US30 potential for the upsideLooking for US30 to push to the upside upon the retest of the recently created 4h/1h demand zone.Use proper risk management should you join me.

25000 is here! READY TO REVERSE!!?As we can see NIFTY has taken support in the important demand zone as analysed being both a demand zone and a psychological level hence from now we can wait for NIFTY to show signs of REVERSAL as any signs of REVERSAL from this demand zone can show new ATH so plan your trades accordingly and keep watching everyone.

the much awaited FALL is here!! Just as analysed!! Whats NEXT?As we can see NIFTY seems to be following our analysis. Now since it has entered our demand zone of 25150-25200, we can expect NIFTY to reverse as not much downside is available now. We can see 24950-25000 to act as a strong demand zone which is also a psychological level hence any signs of REVERSAL around this zone could show strong UPSIDE so plan your trades accordingly and keep watching everyone.

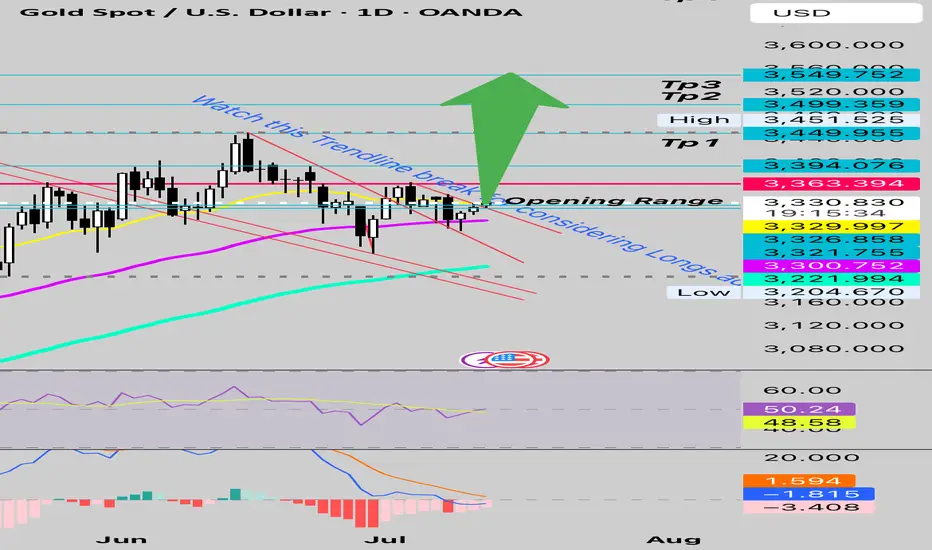
Trendline broken Buying pressure continuous and flooding Gold is gaining from strength to strength
After breaking the falling trendline It is trading above the opening range.
As long as above this. More upside towards 3366 and more could follow
Comfortably above weekly support 3300
Tp remaining same as before
STRONG REJECTION exactly as analysed!!As we can see NIFTY showed directional downward move exactly as analysed. Now that NIFTY has closed again at important demand zone from where it got rejected previously, but now the formation of this candle shows the strength of bear over bulls, Hence any closing below 25300 should lead to another strong downfall so plan your trades accordingly and keep watching everyone.
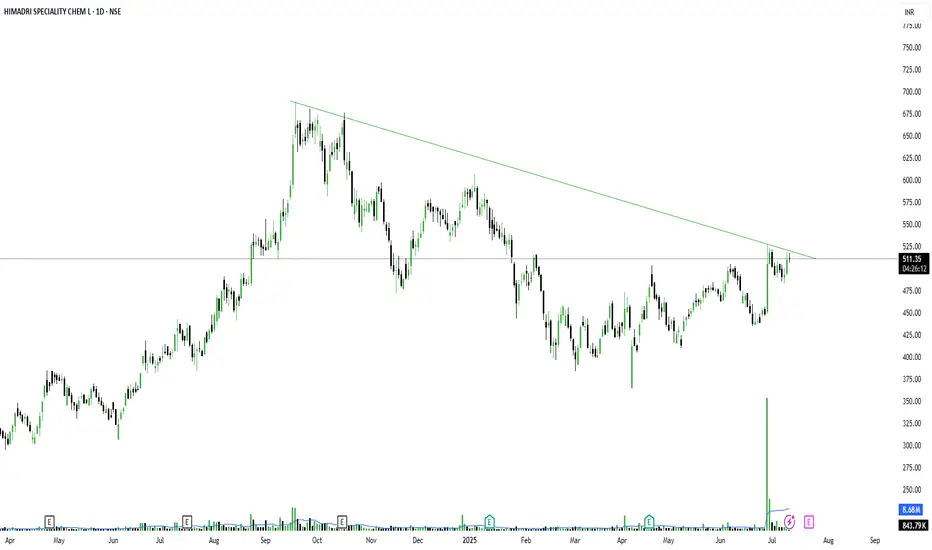
HSCL to Fly Very Sooon!So here's another chart that’s quietly showing signs of strength — NSE:HSCL just kissed its falling trendline drawn from September 2024 highs.
After almost 10 months of lower highs, the stock is now trying to push above the trendline with volume backing it. That giant green candle on June 27 with a volume burst was the sign of Smart Money stepping in. And now it’s consolidating just below the breakout point — classic pre-breakout structure.
This is what we call a volatility contraction near resistance, where price tightens and sets up for an impulsive move. Earnings season is around the corner, and this might just be forming its Earning Pivot.
Don't rush. But if price takes out that 525–530 zone cleanly with volume, it's ready to fly.
#Entry above: 530
#Stoploss: 498
#Target 1: 565
#Target 2: 598
#Extended: 630 (if volume sustains above 600 zone)
Be ready but not greedy.
Let confirmation guide your move. No front running.
Also — this is a stock with explosive history, so manage risk wisely.
Avoid impulse. Trade plans, not predictions.
Have a focused and profitable day ahead.
BEARISH till now! View might change above 25550!!As expected NIFTY got rejected exactly from our given trendline resistance but since it tried breaking the trednline, its candle high is of immense importance. Any break and sustainment above 25550 can result in strong unidirectional upmove, but below the trendline, it can remain sideways to negative so plan your trades accordingly and keep watching everyone.
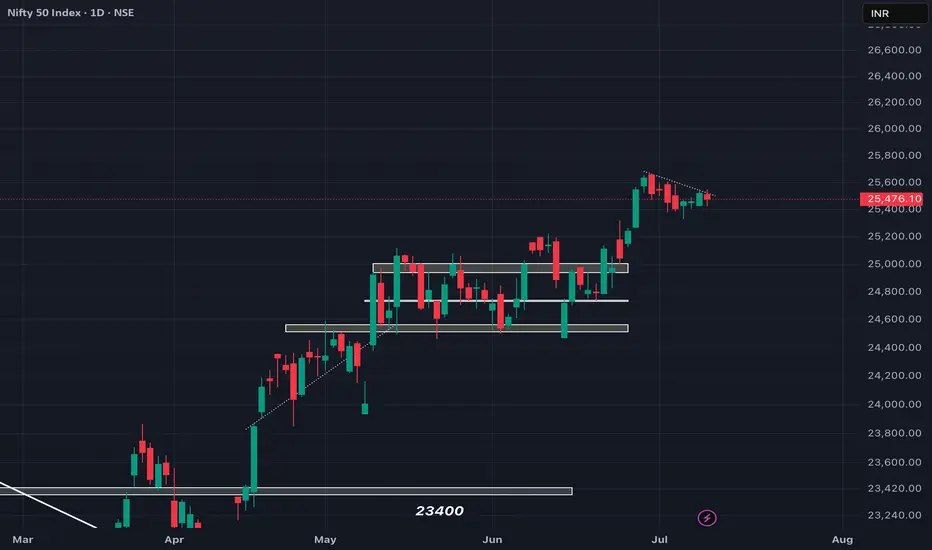
A minor RESPITE!? will it sustain?As we can see NIFTY finally showed some volume after being sideways for couple of days which could be a result of consolidation's break. Moreover, we can see NIFTY closed itself at the trendline resistance which is cautionary. Hence unless NIFTY breaks and sustain itself above the trendline, every rise can be shorted so plan your trades accordingly and keep watching everyone.

Ready for 3450 and more!After Weeks of consolidation
Gold is ready to resume the Rally.
Comfortably trading above 3300 A Strong Weekly Support that has repeatedly provided the necessary Cushion.
Buy above - 3350
TP1 3450
TP2 3500
TP3 3550
Tp4 3650~3700
SL - below 3320
