We are still VERY WEAK below 26000 level! EXPLAINEDStanding. by our previous analysis, as long as we are below 26000 and doesn't sustain ourselves above 26000, every rise can be shorted till 25500 which is its next important DEMAND zone. So plan your trades accordingly and keep watching everyone.
Multiple Time Frame Analysis

Gujarat Gas Ltd – A Major Correction Nears CompletionAfter a volatile two-year decline, Gujarat Gas Ltd (NSE: GUJGASLTD) may be approaching the final leg of a prolonged corrective structure — a setup that aligns beautifully across both monthly and daily timeframes.
The Bigger Picture – Monthly View
From the 2016 lows near ₹94 , Gujarat Gas advanced in an impressive impulsive manner , peaking around ₹786.
What followed has been a deep and time-consuming correction that unfolded as a double zigzag (W–X–Y) structure.
Wave W bottomed at ₹403.55 in early 2021.
Wave X retraced sharply to ₹689.95 — a typical counter-trend rally.
Wave Y then extended lower and now appears to be terminating near ₹360.
This region coincides with the 0.618 Fibonacci retracement of the entire 2016–2021 uptrend, an area often associated with exhaustion in larger corrective waves.
Price action has also turned subdued, with narrower candle bodies and waning momentum — a sign that the multi-year correction may be approaching completion.
Zooming In – Daily Structure
The daily chart reveals the internal five-wave pattern within Wave C of Y nearing its end.
The final sub-wave (5) has reached a confluence between 0.618 (₹411.7) and 0.786 (₹389.1) retracements, forming a technical Buy Zone.
However, traders may consider waiting for bullish confirmation before acting.
Watch for reversal signs such as Hammer, Bullish Engulfing patterns to confirm that buyers are stepping in from support.
Importantly, the RSI shows bullish divergence — a classic sign that downside momentum is losing steam even as price makes marginal new lows.
Confluence and Context
Structural Alignment : Monthly W–X–Y correction appears mature.
Fibonacci Support : Key retracement cluster at ₹389–₹412.
Momentum Shift : RSI divergence adds conviction.
Price Trigger : Wait for bullish candle confirmation from the Buy Zone.
Risk Clarity : Invalidation below ₹372.
Together, these factors indicate that the correction could be ending, setting the stage for a medium-term trend reversal.
The Road Ahead
If price sustains above ₹440–₹460 after a confirmed reversal signal, it could mark the beginning of a new upward phase — potentially the start of a larger impulsive leg.
Failure to hold above ₹372 would, however, invalidate the bullish case and shift focus back to ₹340–₹360.
In essence: Gujarat Gas is positioned at a confluence of structural, Fibonacci, and momentum supports — a zone where long-term corrections often end and new trends begin. Confirmation through bullish price action could validate the start of a new recovery leg.
Disclaimer: This analysis is for educational purposes only and does not constitute investment advice. Please do your own research (DYOR) before making any trading decisions.

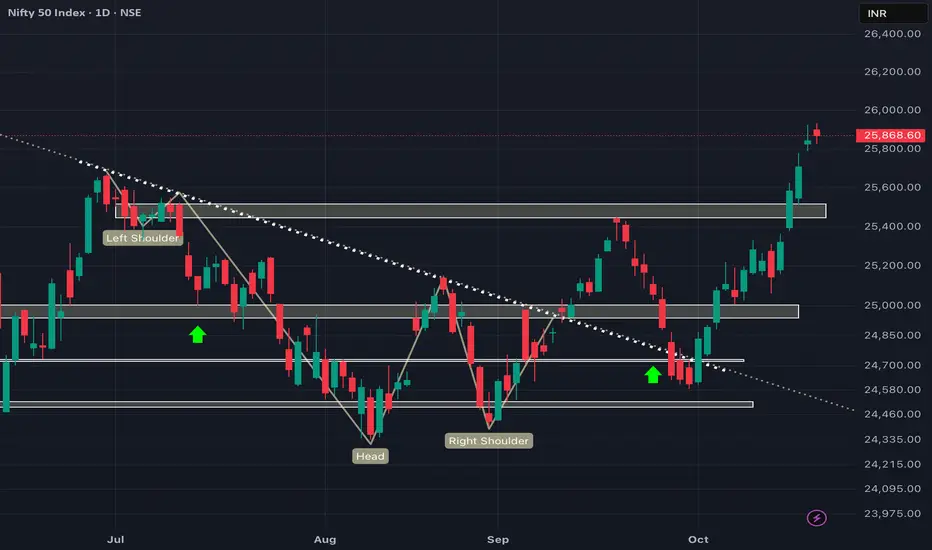
Will only gp long if sustains above 26000 level!As we can see NIFTY recovered sharply but managed to close below 26000 which is a strong supply zone. Moreover, we analysed in our previous post that we may see short term retracement towards upside and we did see that today. Now, we will only think of going long if sustains above 26000-26100 level until that every rise can be shorted for 25500 so plan your trades accordingly and keep watching everyone
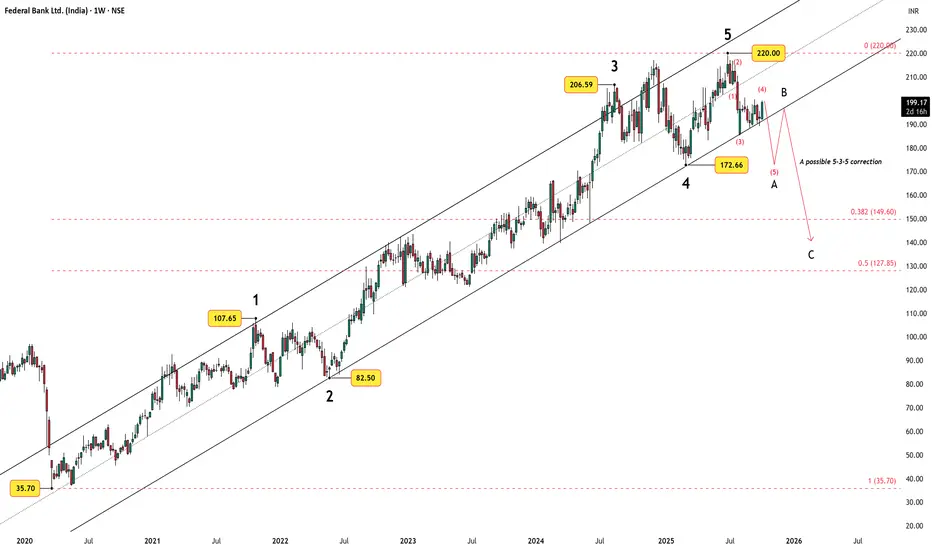
Federal Bank: Wave 4 Triangle Near Completion, Wave 5 AheadAfter a clean five-wave impulse from the 2020 low near ₹35.70 to the 2024 peak at ₹220, Federal Bank appears to be transitioning into a larger corrective phase.
Weekly Outlook
The broader structure suggests the start of a 5-3-5 zigzag correction , marked as A–B–C .
Wave A is still unfolding — only Wave 4 of A appears complete, with Wave 5 expected next to finish the first leg of the correction.
Once Wave 5 concludes, price could rebound toward the lower channel trendline to form Wave B, a counter-trend rally within the broader correction.
Thereafter, a deeper Wave C decline may follow, potentially stretching into the ₹149–₹128 zone, which aligns with the 0.382–0.5 Fibonacci retracement range of the 2020–2024 advance.
This developing structure reflects a natural pause after a long impulse cycle, with the market now transitioning into a corrective rhythm.
Daily Chart Details
Zooming in, the internal structure of Wave A shows a clear five-wave drop, with Wave (4) evolving as a contracting triangle pattern.
The MA50 has started curling toward the MA200, hinting at a possible bearish crossover — a classical confirmation of trend transition.
If price breaks below the triangle base, Wave (5) could extend toward ₹186–₹178, derived from Wave 1 projected from Wave 4’s end.
The targets will be adjusted once the final (e)-wave of the triangle is confirmed, as a minor uptick remains possible.
A sustained move above ₹206.39 would invalidate the immediate bearish setup and delay the decline.
Conclusion:
Federal Bank’s structure aligns with a typical post-impulse correction, and the interplay between Elliott Wave and moving averages provides a clear framework to track this phase.
Disclaimer:
This analysis is for educational purposes only and does not constitute investment advice. Please do your own research (DYOR) before making any trading decisions.
SHREE CEMENT LIMITEDSSL (Sell-side Liquidity)
The chart shows a sweep below previous lows (SSL).
This indicates liquidity grab — where stops below that level were taken before price reversed.
This often signals the end of a bearish move and the beginning of a bullish structure shift.
FVG (Fair Value Gap)
A small imbalance (gap) formed after a strong bullish candle.
Price tends to revisit these gaps before continuing in the intended direction (in this case, upward).
BSL (Buy-side Liquidity)
Marked near the previous swing high.
This is a potential target zone, as the market may seek to take out liquidity above that level once bullish momentum resumes.
Order Block (OB)
The gray shaded region is marked as an Order Block — the last bearish candle before a strong bullish move.
Price has revisited this zone (currently trading within it), indicating a potential area of institutional buying interest.
Market Bias Bullish (Reversal Likely)
Key Support ₹28,400 – ₹28,800 (Order Block)
Short-Term Target ₹30,400
Extended Target ₹31,600+ (BSL zone)
Invalidates Bullish View Close below ₹28,300

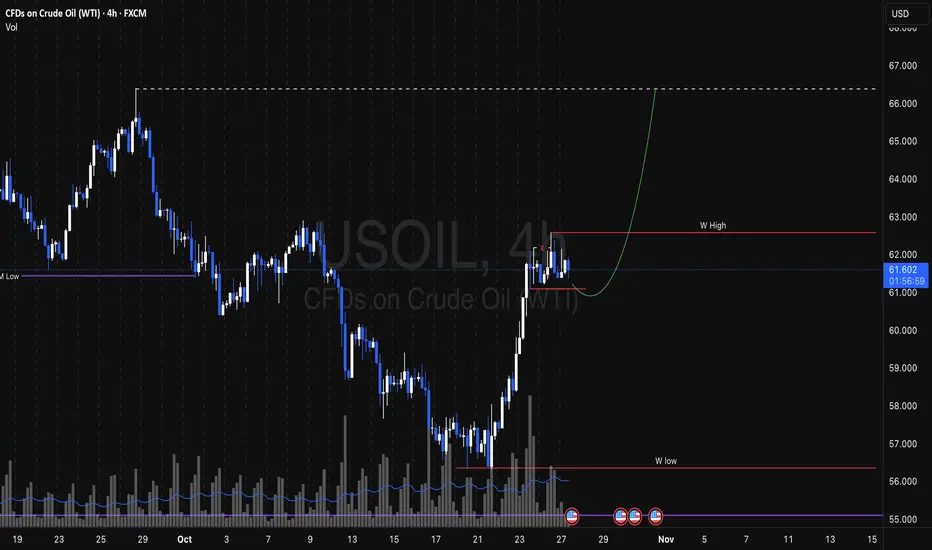
US OILUS Oil weekly was bullish. We can expect this week as bullish expansion. Hence giving US monthly with strong rejection from bottom and closing above monthly open price.
BTCUSDTBitcoin retracement is almost over. There is shift in Orders. Now it can start going down probably.

BTC USDTBITCOIN 4H shows rejection from Top. This could be liquidity sweep pending below. It can retrace back to demand zone. Can show rejection from there and then continue to break previous day high which is external liquidity.


BTC USDT ShortBitcoin is going towards internal liquidity pool or Left Imbalance or Price gap on to at 1H time.
Price can retrace from current point and continue to push up from Demand. Then fall from top Supply as shown by green Line.

BTC USDTBitcoin is generating sell side liquidity. There is sign of rejections from top. Wait for Price to get into the supply zone and starting showing rejections in 4H, followed by 1H. Can take a deep retracement into supply. So I will wait till we have favourable sell conditions.
- Safe Entry. Wait for Daily rejection. Then wait fro 4H retracement. 4H rejection and we enter.

XAUUSD LongFriday ending session setting the Directional bias for next week. Monday it can start with retracement to the demand zone and then continue to push up to target the external liquidity, which is Daily high or prevision trading day as well as day before that. Since both previous day made Equal high.
1. Daily closing with Big price rejection.
2. We have change of character in 1min, Leaving behind imbalance as well as Equal low.

XAUUSDContinues to push up. Next retracement could be M15 Demand zone. Then push up. We have equal low above demand zone. Eq Low is strong liquidity pool.

XAUUSDLast day was consolidating and has generated sell side liquidity. There could be possibility the price sweeps that liquidity and then reverse from the Marked Demand zone.
We have Imbalace left in 15M
We have Equal lows. Srong liquidity pool.
Below Eq low we have Demand zone.

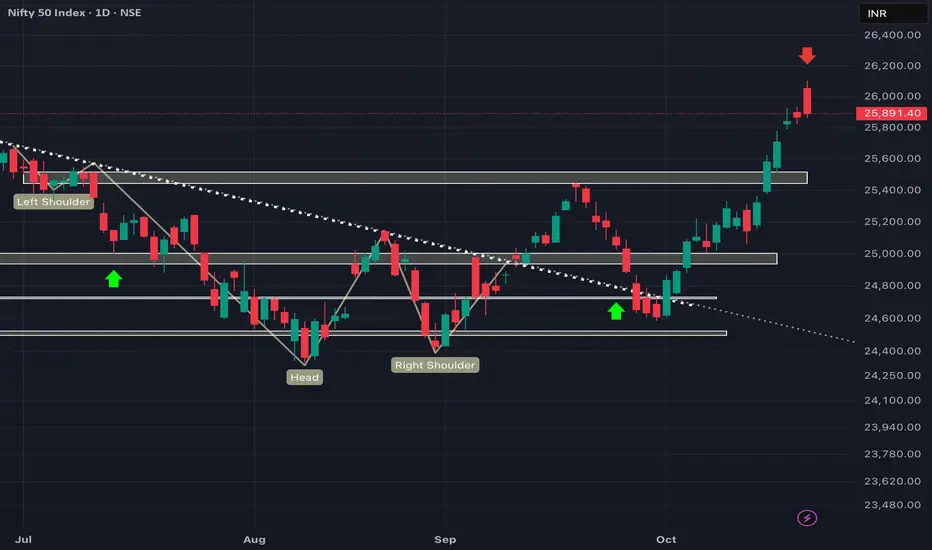
Signs of REVERSAL!!? As we can see NIFTY showed strong rejection forming marabozu candle in daily time frame showing rejection from 26000 levels as explained in previous post. Moreover, we can see NIFTY has filled the pending gap and hence we can expect NIFTY tp show weakness from here and hence until and unless NIFTY sustains itself above psychological level of 26000, every rise can be sold so plan your trades cautiously and keep watching everyone.
Torrent Power - Short Term Investment IdeasTorrent Power Limited - Technical Analysis Report
Current Market Price: 1,328.40
Opportunity: The Stock is Trading at 40% discount to intrinsic value, presenting a potential value investment in the #Integrated #powersector.
Technical Setup: Stock testing critical 20 #EMA support on monthly timeframe after forming #HiddenDivergence #pattern. Recent decline suggests caution but oversold conditions emerging.
Technical Snapshot
Trend: Monthly chart shows trend continuation pattern with classic divergence forming between February and October 2025 lows. Currently attempting support at 20 EMA (1,329).
RSI: Monthly RSI at 33.26 (oversold territory) with RSI 3 breakout indicating significant selling pressure but potential bounce setup.
Support Levels: 1328, 1200, 1055
Resistance Levels: 1539, 1743 (recent high)
Business Overview (Fundamentals)
Torrent Power operates across three segments: thermal power generation and LNG trading, transmission and distribution (largest revenue contributor), and renewable energy through wind and solar projects.
Trading Strategy
Aggressive Buyers: Accumulate at current levels with stop loss below 1,280. Risk-reward favorable given 40% discount.
Conservative Buyers: Wait for weekly close above 1,350 confirming support hold before entry.
Target:1,539 (short-term), 1,743+ (medium-term)

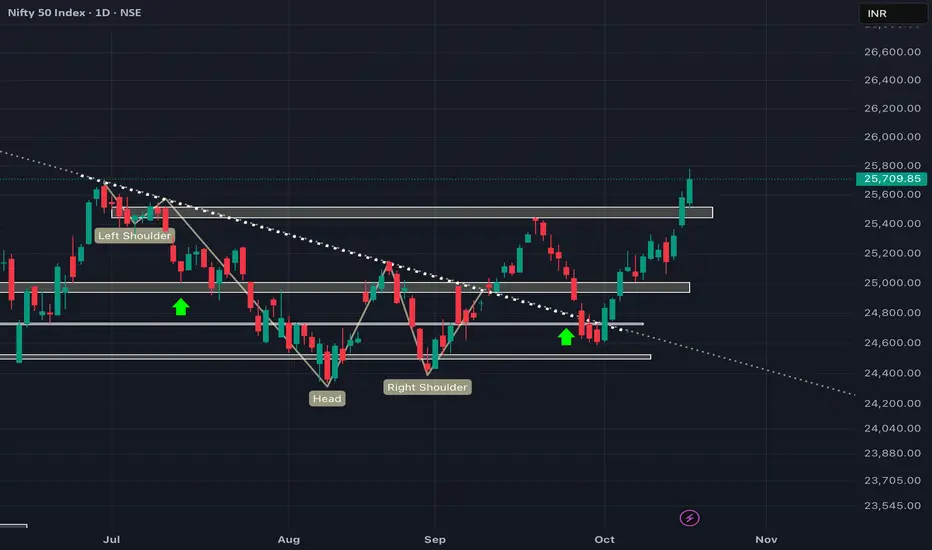
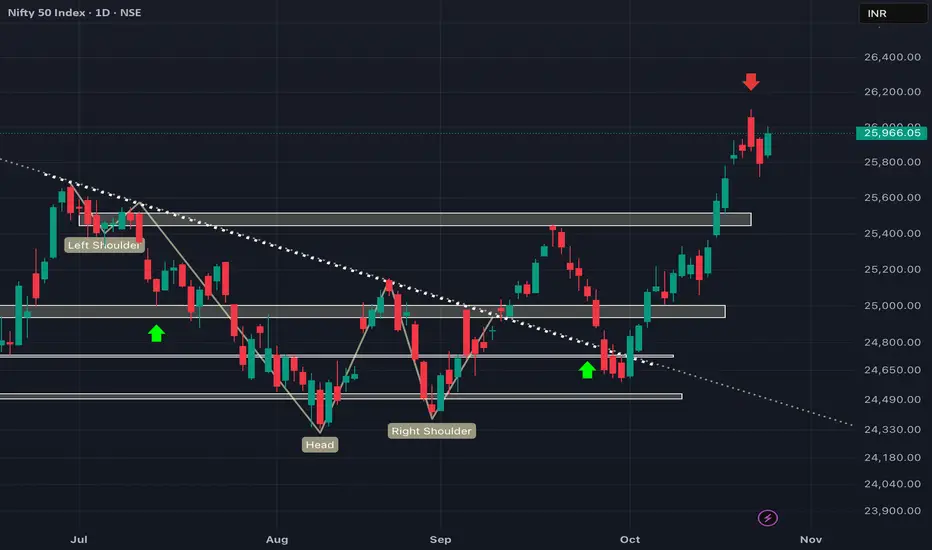
NIFTY looks strong but not STRONG ENOUGH!!?As we can see NIFTY has finally breached its previous swing but is showing signs of rejection around 25900-26000 levels as it is now trading at important GAP which has been filled and cam act as a resistance as long as NIFTY doesn't sustains itself above 25900-26000 psychological level every rise can be sold as it could be a possible trap leading to sharp fall. Moreover one who had been rallying this uptrend from our zones should start booking partially and wait for signs of reversal or sustainment above 26000 level for confirmation so plan your trades accordingly and keep watching everyone.
AdityaBirlaCapital - Investment IdeasAditya Birla Capital Ltd - Technical Analysis
Simple Technical Analysis Summary
Aditya Birla Capital is breaking out from a multi-year resistance zone with a classic and perfect rounding bottom pattern playing out on the monthly timeframe.
Fibonacci targets have been activated!
Key Technical Observations
1. Multi-Year Rounding Bottom Pattern
The stock has completed a textbook rounding bottom formation spanning multiple years. This is one of the most reliable bullish reversal patterns in technical analysis, indicating a fundamental shift from bearish to bullish sentiment.
2. Breakout from Multi-Year Resistance
After years of consolidation and base building, the stock has successfully broken out from a significant resistance zone around ₹255. This breakout signals the potential beginning of a new uptrend cycle.
3. Monthly Timeframe Confirmation
The pattern is forming and confirming on the monthly timeframe, which carries significantly more weight than shorter timeframes. Monthly breakouts tend to lead to sustained moves.
4. Fibonacci Extension Framework
Multiple Fibonacci extension levels have been identified and activated, providing a clear roadmap for potential price targets based on the measured move from the rounding bottom pattern.
#Fibonacci Extension Target Levels
Based on the rounding bottom pattern measurement and Fibonacci extensions:
- Target 1: 314.20 (1.272 Fibonacci Extension)
- Target 2: 345.10 (1.414 Fibonacci Extension)
- Target 3: 389.90 (1.618 Fibonacci Extension)
- Extended Target: 472.00 (2.0 Fibonacci Extension)
Key Support Levels
- Immediate Support: 255.00 (Breakout level / Previous resistance turned support)
- Secondary Support: 171.86 (0.618 Fibonacci retracement)
- Critical Support: 146.17 (0.5 Fibonacci retracement)
- Base Support: 42.35 (Rounding bottom base)
- Pattern suggests long-term bullish structure - Risk-reward favorable for position building on dips
Risk Management:
- Maintain stoploss below 255 on monthly closing basis
- For aggressive traders: 240 (allowing some wiggle room)
- For conservative traders: 235 (below breakout zone)
Invalidation Level:
- Monthly close below 240 would weaken the bullish structure
- Break below 220 would invalidate the immediate bullish setup
DISCLOSURE & RISK WARNING:
This analysis is provided for educational and informational purposes only and should not be construed as financial advice, investment recommendation, or an offer to buy or sell securities. Past performance is not indicative of future results.

#Cipla - #ShortTerm #Inveatment IdeaCipla Ltd - Technical Analysis
Current Price: 1,639.10
Timeframe: Monthly Chart Analysis
This analysis utilizes:
- Monthly and Weekly timeframe analysis
- Fibonacci extension and retracement levels
- Support/resistance identification
- RSI momentum analysis
- Price action patterns
Technical Structure Overview
1. Monthly Consolidation Phase
After making a higher high, Cipla is currently in a consolidation phase on the monthly chart, forming a strong base. This consolidation suggests preparation for a potential significant move higher.
2. Breakout Level to Watch
The critical level to monitor for breakout confirmation is around the recent high zone. A decisive break above this level could trigger the next leg of the uptrend.
3. Weekly Timeframe Confirmation
For higher probability setups, confirmation should be sought on the weekly timeframe before taking any positions. This multi-timeframe approach reduces false signals.
4. Fibonacci Extension Targets
Based on Fibonacci patterns, the following extension levels have been identified as potential targets for future price movement.
5. Risk Management Strategy
Following a risk-reward approach is essential for this setup given the consolidation phase and potential for significant moves in either direction.
Fibonacci Extension Target Levels
Based on technical projections:
- Target 1: 1,872.70 (1.272 Extension at 1,878.05)
- Target 2: 1,986.95 (1.414 Extension at 1,987.15)
- Target 3: 2,145.45 (1.618 Extension at 2,143.95)
Key Support Levels
Primary Support: 1,345.75 (0.5 Fibonacci level)
Critical Support: 900.50 (0 level - invalidation zone)
Trading Considerations
Bullish Scenario:
- Wait for monthly candle close above consolidation range
- Confirm momentum on weekly timeframe
- Enter on weekly pullback for optimal risk-reward
Invalidation:
- Break and close below ₹1,345.75 would weaken the bullish structure
- RSI showing divergence patterns to monitor
DISCLOSURE & RISK WARNING:
This analysis is provided for educational and informational purposes only and should not be construed as financial advice, investment recommendation, or an offer to buy or sell securities. Past performance is not indicative of future results.

Long Term Buy #GMRCurrent market Price: ₹153.35
Key Technical Analysis Points
"Major Breakout Achievement"
The stock has successfully broken out of a 16-year resistance level around ₹101.73, which had been a significant barrier since the 2009 highs.
Previous ATH : ₹111.17
- Target 1: ₹125.86
- Target 2: ₹153.35
Key support : ₹101.73 (former resistance, now support)
**Long-term Pattern**: The chart shows a classic long-term consolidation pattern from 2009-2023, followed by a strong breakout and retracement that successfully held above the breakout level.
Conservative Trader can Initiate buy above ₹101.73 Breakout.
The stock experienced significant highs around 2009-2010, followed by a prolonged bear market and consolidation phase lasting over a decade. The recent breakout suggests a potential new bull cycle for the airport infrastructure company.

SchaefflerInd - Technical Analysis#Schaeffler India - Technical Analysis Report
Current Price: 4,141.10 / Prev ATH @4951.
Trade Setup Overview
Basic Dow Theory : Stock is making Higher High - Higher Low by Breaking previous ATH decisively and stock is down to strong Demand Zone for retracement.
Stock is in consolidation before breaking previous ATH & currently forming Flag & Pole Pattern.
Entry on breakout above resistance 4,200-4,300
Conservative Stop Loss at 3,800 | Tight SL near 4,000
Tgt 1: 4,602
Tgt 2: 4,776
Tgt 3: 5,026
Grand Flag & Pole Target: 5,495.
Technical Highlights:
- Trend Reversal confirmed by breaking previous High on May 2025 around 2,800
- Price consolidating after strong recovery rally
- Trading above key moving averages
- Breakout above 4,300 resistance could trigger momentum toward 4,600 / 5495
Risk-Reward:
Favorable R:R with potential 11-33% upside vs 3-8% downside to stop loss levels.

Hindpetro Long - Investment IdeaHindustan Petroleum (HINDPETRO) - Monthly Chart Analysis
Current Price: 441.75
Major #Breakout in Progress
**Timeframe:** Monthly (Long-term View)
Key Technical Event:
🚀 Historic Breakout - Stock has broken above 2017 all-time high after 8 years of consolidation
- Breakout Level: 325.55
- Retest Zone: 410-420 - Currently retesting breakout
Hindpetro is Brewing for fresh new highs above ₹441
Target Projections based on #Patterns and #Fibonocci levels.
Interim Targets:
- Support holding at ₹416
- Immediate resistance: ₹480-500 zone
Short Term Targets:
- Tgt 1: 530
- Tgt 2: 657
Extended Targets: 593-629
Technical Significance:
- **8-year base breakout** = High probability of sustained uptrend
- Monthly trend reversal confirmed
- Trading well above long-term moving average
- Volume-supported breakout suggests institutional accumulation
Risk Management:
- Stop Loss: Below 410 on monthly closing basis
- Key Support: 325 (previous resistance now support)
Outlook:
After breaking a major multi-year resistance, HINDPETRO is consolidating gains and positioning for the next leg up. Patient accumulation recommended on dips toward ₹410-420.
This is for educational purposes only.* Do your Own analysis before taking Trade.

NIFTY might start facing RESISTANCE from here if!! EXPLAINEDAs we can see NIFTY has shown unidirectional rally ever since it took support from our demand zone and now has reached its resistance which is also a previous swing which could act as a resistance. Moreover in a holistic view, we can see NIFTY filling the gap till 25800 which has not been filled before making it an important supply zone. Hence, we can expect NIFTY to show strength till 25800 and show signs of rejection but if it manages to sustain itself above 25800 then ATH is coming up anytime sooner so plan your trades accordingly and keep watching everyone.