Database Trading part 3Trading data is a sub-category of financial market data. It provides real-time information about stock and market prices as well as historical trends for assets such as equities, fixed-income products, currencies and derivatives. Trading data also includes information about trades historically and over the course of a trading day, such as the latest bid, asking price and time of the last trade.
NIFTY

MACD Part 2MACD, short for Moving Average Convergence Divergence, is a popular technical indicator used in trading to identify potential buy and sell signals, as well as trend reversals. It's essentially a momentum indicator that compares two moving averages (usually 12-period and 26-period exponential moving averages) to gauge the strength and direction of a trend.

RSI ExplanationThe Relative Strength Index (RSI) is a momentum indicator used in technical analysis to assess the speed and magnitude of price changes. It helps traders identify potential overbought and oversold conditions in a financial instrument, suggesting when an asset might be nearing a trend reversal. RSI values range from 0 to 100, with readings below 30 often indicating oversold conditions and readings above 70 suggesting overbought conditions'

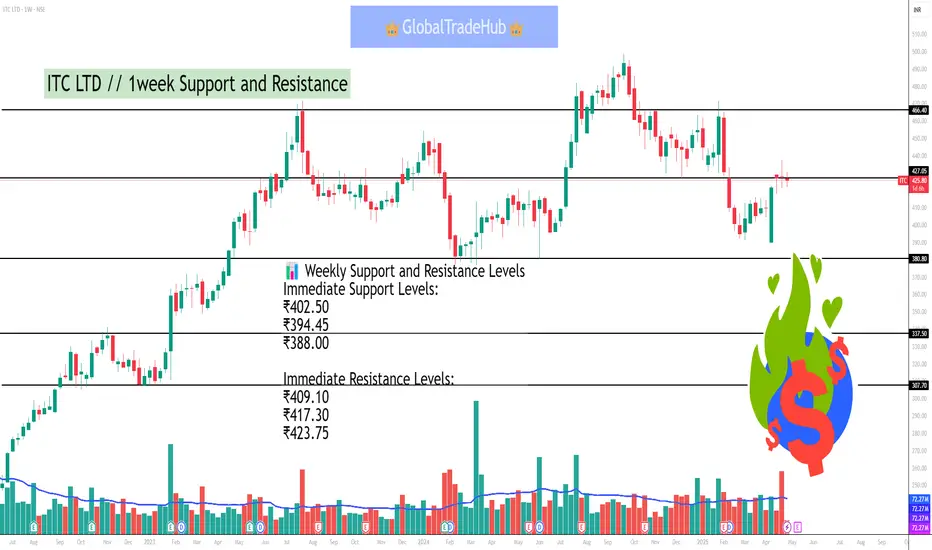
ITC LTD // 1week Support and ResistanceAs of May 1, 2025, at 10:20 AM IST, ITC Ltd (NSE: ITC) is trading at ₹403.05. Based on recent technical analysis, here are the key support and resistance levels for the stock on a weekly (1W) chart:
📊 Weekly Support and Resistance Levels
Immediate Support Levels:
₹402.50
₹394.45
₹388.00
Immediate Resistance Levels:
₹409.10
₹417.30
₹423.75
These levels suggest that if the stock price declines below ₹402.50, it may find support around ₹394.45 and ₹388.00. Conversely, if the price rises above ₹409.10, it could encounter resistance near ₹417.30 and ₹423.75.
🔍 Technical Indicators
ADX (Average Directional Index): 29.19 – indicates a trending market.
RSI (Relative Strength Index): 47.4 – suggests neutral momentum.
MACD (Moving Average Convergence Divergence): -4.66 – indicates a negative trend.
CCI (Commodity Channel Index): 2.74 – suggests neutral momentum.
These indicators suggest a neutral to slightly bearish outlook for ITC in the short term.
📈 Summary
ITC is currently trading near its immediate support levels. A break below ₹402.50 could lead to a decline towards ₹394.45 and ₹388.00. On the upside, resistance is observed at ₹409.10, ₹417.30, and ₹423.75. Traders should monitor these levels closely, as a decisive move beyond these support or resistance levels could signal the next directional move.
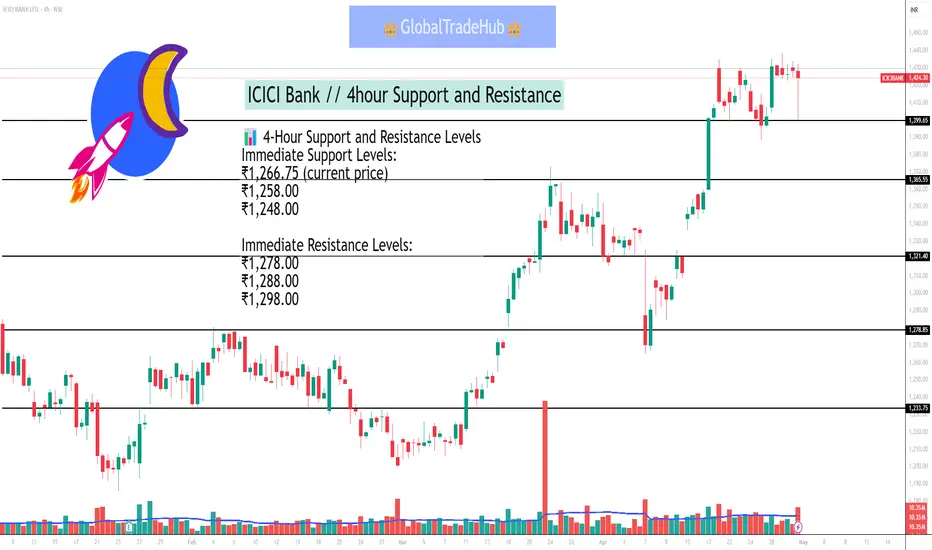
ICICI Bank // 4hour Support and ResistanceAs of May 1, 2025, at 10:08 AM IST, ICICI Bank Ltd (NSE: ICICIBANK) is trading at ₹1,266.75. Based on recent technical analysis, here are the key support and resistance levels for the stock on a 4-hour (4H) chart:
📊 4-Hour Support and Resistance Levels
Immediate Support Levels:
₹1,266.75 (current price)
₹1,258.00
₹1,248.00
Immediate Resistance Levels:
₹1,278.00
₹1,288.00
₹1,298.00
These levels suggest that if the stock price declines below ₹1,266.75, it may find support around ₹1,258.00 and ₹1,248.00. Conversely, if the price rises above ₹1,278.00, it could encounter resistance near ₹1,288.00 and ₹1,298.00.
🔍 Technical Indicators
ADX (Average Directional Index): 17.73 – indicates a weak trend.
RSI (Relative Strength Index): 55.87 – suggests neutral momentum.
MACD (Moving Average Convergence Divergence): 11.45 – indicates a positive trend.
CCI (Commodity Channel Index): 88.61 – suggests the stock is in an uptrend.
These indicators suggest a neutral to slightly bullish outlook for ICICI Bank in the short term.
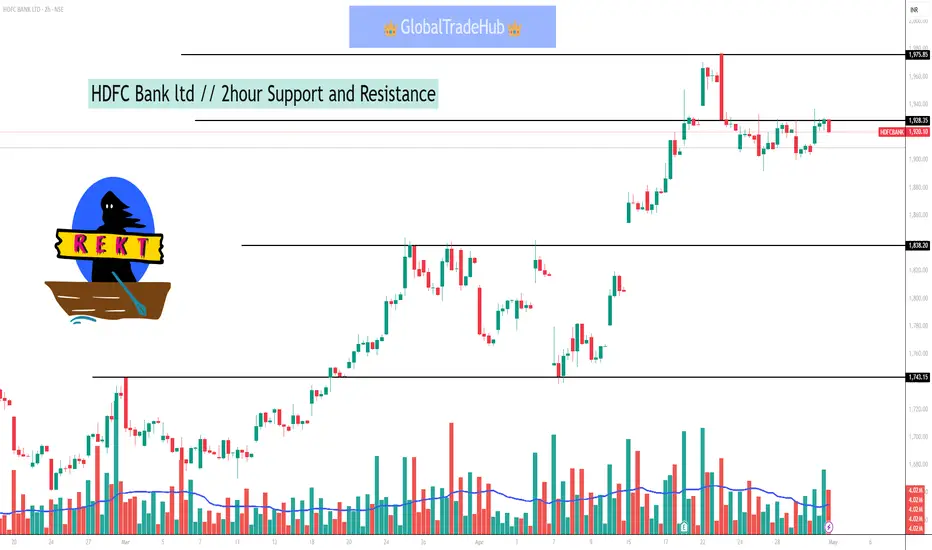
HDFC Bank ltd // 2hour Support and ResistanceAs of May 1, 2025, at 9:58 AM IST, HDFC Bank Ltd (NSE: HDFCBANK) is trading at ₹1,765. Based on recent technical analysis, here are the key support and resistance levels for the stock on a 2-hour (2H) chart:
📊 2-Hour Support and Resistance Levels
Immediate Support Levels:
₹1,746
₹1,732
Immediate Resistance Levels:
₹1,797
₹1,812
These levels suggest that if the stock price falls below the immediate support at ₹1,746, it may find the next support at ₹1,732. Conversely, if the price rises above the immediate resistance at ₹1,797, it could encounter the next resistance at ₹1,812 .
📉 Technical Indicators
ADX (Average Directional Index): 24.08, indicating a trending market.
MACD (Moving Average Convergence Divergence): Bearish crossover detected, suggesting downward momentum.
Parabolic SAR: Positioned at ₹1,714.70, indicating a bearish trend.
Super Trend: At ₹1,728.41, confirming bearish sentiment.
Bollinger Bands: Price is below the middle band (₹1,707.66), indicating potential for further downside .
MAX FINANCIAL SERVICES LTDAs of May 1, 2025, at 9:35 AM IST, here are the key daily support and resistance levels for Max Financial Services Ltd. (NSE: MFSL) based on recent technical analysis:
🔹 Support Levels
S3: ₹1,011.58
S2: ₹1,020.37
S1: ₹1,030.43
🔹 Resistance Levels
R1: ₹1,049.28
R2: ₹1,058.07
R3: ₹1,068.13
These levels are derived from the Classic pivot point method, calculated based on the price range of the previous trading day.
📊 Technical Indicators
RSI (14): 50.14 (Neutral)
MACD: 1.57 (Sell)
ADX (14): 22.20 (Neutral)
Williams %R: -51.44 (Buy)
CCI (14): 68.41 (Neutral)
ROC: 3.45 (Buy)
These indicators suggest a neutral to slightly bullish trend, with the stock trading near its 20-day moving average and showing mixed momentum signals.
📈 Moving Averages
20-day EMA: ₹1,073.42
50-day EMA: ₹1,109.36
100-day EMA: ₹1,118.91
200-day EMA: ₹1,086.00
The stock is trading below its 50-day and 100-day EMAs, indicating a potential resistance zone around ₹1,109.36.
Note: These levels and indicators are based on historical data and are subject to change with market conditions. It's advisable to monitor the stock's price movements and consult with a financial advisor before making any trading decisions.

PIL ITALICA LIFESTYLE LTDAs of May 1, 2025, at 9:20 AM IST, here are the key daily support and resistance levels for Pil Italica Lifestyle Ltd (NSE: PILITA) based on recent technical analysis:
🔹 Support Levels
S1: ₹14.71
S2: ₹14.40
S3: ₹14.02
🔹 Resistance Levels
R1: ₹15.40
R2: ₹15.78
R3: ₹16.09
These levels are derived from the Classic pivot point method, calculated based on the price range of the previous trading day.
Technical Indicators:
RSI (14): 66.92 (Uptrend)
MFI: 88.87 (Strong Uptrend)
CCI (14): 262.93 (Strong Uptrend)
EMA (20): ₹13.37 (Neutral)
EMA (50): ₹12.94 (Uptrend)
EMA (100): ₹12.72 (Uptrend)
EMA (200): ₹12.27 (Uptrend)
These indicators suggest a bullish trend, with the stock trading above key moving averages and strong momentum indicators.
Please note that these levels are based on historical data and are subject to change with market conditions. It's advisable to monitor the stock's price movements and consult with a financial advisor before making any trading decisions.

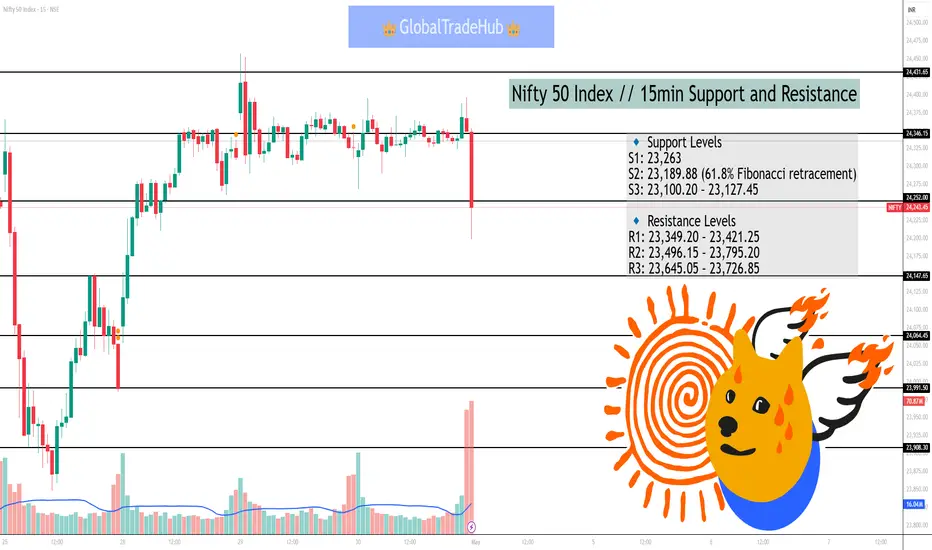
Nifty 50 Index // 15min Support and ResistanceAs of May 1, 2025, at 9:04 AM IST, the Nifty 50 index is trading at approximately 23,630. Based on recent intraday analysis, here are the key 15-minute support and resistance levels:
🔹 Support Levels
S1: 23,263
S2: 23,189.88 (61.8% Fibonacci retracement)
S3: 23,100.20 – 23,127.45
🔹 Resistance Levels
R1: 23,349.20 – 23,421.25
R2: 23,496.15 – 23,795.20
R3: 23,645.05 – 23,726.85
These levels are derived from recent intraday analysis and are subject to change with market conditions. It's advisable to monitor the stock's price movements and consult with a financial advisor before making any trading decisions.
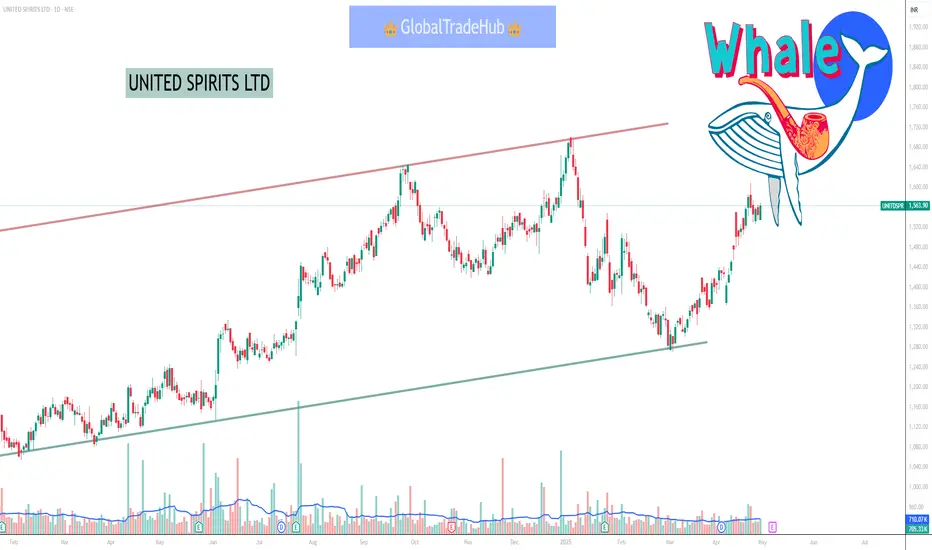
UNITED SPIRITS LTD As of May 1, 2025, here are the key support and resistance levels for United Spirits Ltd (NSE: UNITDSPR) based on the latest technical analysis:
🔹 Support Levels
S1: ₹1,322.63
S2: ₹1,297.97
S3: ₹1,271.98
🔹 Resistance Levels
R1: ₹1,373.28
R2: ₹1,399.27
R3: ₹1,423.93
These levels are derived from pivot point calculations and are commonly used by traders to identify potential price reversal zones.
Please note that these levels are based on historical data and are subject to change with market conditions. It's advisable to monitor the stock's price movements and consult with a financial advisor before making any trading decisions.
Option TradingOption trading involves buying or selling contracts that give the right, but not the obligation, to buy or sell an underlying asset (like a stock) at a specific price (strike price) by a certain date (expiration date). It allows traders to speculate on future price movements of an asset without actually owning it.

Overview of Financial MarketsA financial market is a place where firms and individuals enter into contracts to sell or buy a specific product, such as a stock, bond, or futures contract.

Price Action TradingPrice action trading is a strategy that focuses on analyzing and interpreting an asset's price movements to make trading decisions. It involves studying price patterns, trends, and support/resistance levels to anticipate future price direction. Instead of relying heavily on technical indicators, price action traders focus on the raw price data and chart patterns to identify entry and exit points.

MACD TradingThe Moving Average Convergence/Divergence indicator is a momentum oscillator primarily used to trade trends. Although it is an oscillator, it is not typically used to identify over bought or oversold conditions. It appears on the chart as two lines which oscillate without boundaries.

PCR TradingIn trading, PCR, or Put-Call Ratio, is a derivative indicator used to assess market sentiment by comparing the volume or open interest of put options to call options. It's a contrarian indicator, meaning it can suggest an opposite trend to what the market is currently showing. A higher PCR generally indicates bearish sentiment (expecting the market to decline), while a lower PCR suggests bullish sentiment (expecting the market to rise).

Explanation of RSIThe Relative Strength Index (RSI) is a momentum indicator used in technical analysis to assess the speed and magnitude of price changes. It helps traders identify potential overbought and oversold conditions in a financial instrument, suggesting when an asset might be nearing a trend reversal. RSI values range from 0 to 100, with readings below 30 often indicating oversold conditions and readings above 70 suggesting overbought conditions.

Option Trading AnalysisAn option is a contract that represents the right to buy or sell a financial product at an agreed-upon price for a specific period of time. You can typically buy and sell an options contract at any time before expiration. Options are available on numerous financial products, including equities, indices, and ETFs.

RSI Divergence RSI divergence in trading occurs when the price of an asset and its Relative Strength Index (RSI) indicator move in opposite directions. This divergence suggests a weakening of the current trend and a potential reversal. For example, if the price makes a new high, but the RSI makes a lower high, it could indicate bearish divergence and a potential price drop. Conversely, if the price makes a new low, but the RSI makes a higher low, it could indicate bullish divergence and a potential price increase.

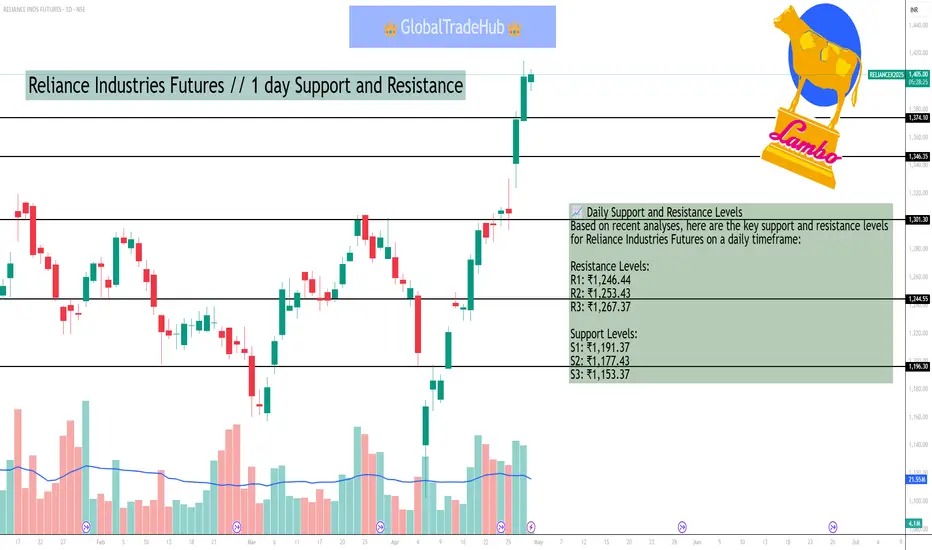
Reliance Industries Futures // 1 day Support and ResistanceAs of April 30, 2025, the Reliance Industries Futures (NSE: RELIANCE) closed at ₹1,235.80, up 0.16% from the previous close of ₹1,233.80. The futures market indicates a slight bullish sentiment, with open interest increasing by 4.82%, suggesting that traders are holding onto long positions.
📈 Daily Support and Resistance Levels
Based on recent analyses, here are the key support and resistance levels for Reliance Industries Futures on a daily timeframe:
Resistance Levels:
R1: ₹1,246.44
R2: ₹1,253.43
R3: ₹1,267.37
Support Levels:
S1: ₹1,191.37
S2: ₹1,177.43
S3: ₹1,153.37
These levels are derived from classic pivot point calculations and can act as potential entry, target, and stop-loss levels for intraday traders.
📊 Technical Indicators
Futures Price: ₹1,243.90
Pivot Point: ₹1,246.98
Support Levels:
S1: ₹1,233.12
S2: ₹1,222.33
S3: ₹1,208.47
Resistance Levels:
R1: ₹1,257.77
R2: ₹1,271.63
R3: ₹1,282.42
These levels are calculated based on the futures price and can provide insights into potential price movements.
🧭 Trading Strategy
Bullish Scenario: If Reliance Industries Futures breaks above ₹1,246.44, it could signal a continuation of the upward trend, with potential targets at ₹1,253.43 and ₹1,267.37.
Bearish Scenario: A decline below ₹1,191.37 may indicate a bearish trend, with support levels at ₹1,177.43 and ₹1,153.37.
Traders should monitor these levels closely and adjust their strategies accordingly.
Please note that these levels are subject to change based on market dynamics and should be used in conjunction with other technical analysis tools for informed decision-making.
Nifty 50 //2hour Support and ResistanceAs of April 30, 2025, at 9:45 AM IST, the Nifty 50 index is trading at approximately ₹24,100. Based on recent analyses and technical indicators, here are the key support and resistance levels for the Nifty 50 on a 2-hour timeframe:
📈 Key Support Levels
S1: ₹23,800 – A significant support level where buying interest may emerge.
S2: ₹23,500 – A crucial support zone; breaching this could indicate further downside potential.
S3: ₹23,200 – A critical support level; if broken, it may lead to a more substantial decline.
📊 Key Resistance Levels
R1: ₹24,460 – Immediate resistance; a breakout above this level could signal bullish momentum.
R2: ₹24,550 – A strong resistance zone; surpassing this could lead to further gains.
R3: ₹24,800 – A significant resistance level; if breached, it may indicate a continuation of the uptrend.
📌 Technical Indicators
Relative Strength Index (RSI): Currently at 41.51, indicating neutral momentum.
Moving Averages: The index is trading above its 200-day Simple Moving Average (SMA) of ₹23,780.57, suggesting a long-term bullish trend.
🧭 Trading Strategy
Given the current levels:
Bullish Scenario: A breakout above ₹24,460 could lead to a rally towards ₹24,800.
Bearish Scenario: A decline below ₹23,500 may indicate a move towards ₹23,200.
Traders should monitor these levels closely and adjust their strategies accordingly.
Please note that these levels are subject to change based on market dynamics. It's advisable to use them in conjunction with other technical analysis tools and indicators.

Nifty Financial Services Index//15min Support and ResistanceAs of April 30, 2025, the Nifty Financial Services Index (FINNIFTY) is exhibiting a bullish trend, with the current price at ₹23,512.80. Technical indicators such as moving averages and pivot points suggest potential support and resistance levels for short-term trading.
📊 Key Support and Resistance Levels
Based on recent analyses, here are the critical levels to monitor:
Resistance Levels:
R1: ₹23,571.52
R2: ₹23,630.23
R3: ₹23,695.77
Support Levels:
S1: ₹23,447.27
S2: ₹23,381.73
S3: ₹23,323.02
These levels are derived from pivot point calculations and are useful for intraday trading strategies.
📈 Technical Indicators
Moving Averages:
The index is trading above its 5-day, 10-day, and 20-day simple and exponential moving averages, indicating a bullish short-term trend.
Pivot Points:
The classic pivot point is at ₹24,264.15, with R1 at ₹24,397.3 and S1 at ₹24,175.85.
🧭 Trading Strategy
Given the current bullish momentum, traders might consider buying near support levels and targeting resistance levels for potential profits. However, it's essential to monitor market conditions closely, as breakouts above resistance levels could lead to further upward movement, while failures to hold support may indicate a reversal.
Please note that these levels are subject to change based on market dynamics and should be used in conjunction with other technical analysis tools for informed decision-making.

Pidilite Industries
PIDILITE Industries is forming a Head and shoulders pattern on 4 Hour Time frame, although the chart is looking bullish and the price is also at a round number
support i.e., 3000, but as this indication is on 4 hour we cannot ignore it.
We will wait for the price to breakdown and let the first 30 min candle close below the neckline and do a retest or give us some confirmation candles.
We will also keep a eye, how price is rejecting from 3000 if it gives us some concrete confluences we will looking for long trades only, trend priority

Engineers India Ltd (EIL)As of April 30, 2025, Engineers India Ltd (EIL) is trading at ₹178.41 on the NSE. Based on the latest technical analysis, here are the key intraday support and resistance levels for EIL:
📊 Intraday Support and Resistance Levels
Pivot Point: ₹180.13
First Support: ₹177.46
Second Support: ₹174.04
Third Support: ₹171.37
First Resistance: ₹183.55
Second Resistance: ₹186.22
Third Resistance: ₹189.64
📈 Technical Indicators
Relative Strength Index (RSI): 37.21 (indicating a potentially oversold condition)
Money Flow Index (MFI): 28.35 (suggesting weak buying pressure)
MACD: -9.01 (indicating a bearish trend)
These levels and indicators suggest that EIL is currently in a bearish phase, with the stock trading below its pivot point and facing resistance at higher levels. Traders may consider monitoring the stock for potential reversal patterns or further breakdowns.
Please note that stock prices and technical levels are subject to change, and it's advisable to consult with a financial advisor or conduct further research before making investment decisions.
