What is Trap of the Gap fill theory ?I make educational and conceptual based videos in the field of trading . In this video I have revised the previous concepts and not removing any of them to showcase the power of them and add a new one every other video to build something stronger for you all .
No bias, No forecasting, pure price action understanding and talking about general trends of the markets through index only
Nifty50

Nifty50 analysis(7/2/2026)CPR: wide + decending cpr: consolidtion
FII: 1,950.77 bought
DII: 1,265.06 sold
Highest OI:
CALL OI: 25500 and 25600
PUT OI: 25700 to 26000
Resistance: - 26000
Support : - 25500
conclusion:.
My pov:
1.today market consolidate and take support from 25600 or 25500 then bullish trend is possible
2.25500 and 25600 has more support and 25700 to 25900 has most resisting oi so possibly those gap will fade and take support .
3. If today price breaks 25850 then bullishness continues.
What IF:
1.If it breaks 25500 then 25400 great support
2. If it breaks 25900 then all time high is the target. Only if it close in day candle.
Psycology:
Find a good setup, retest same setup again and again all this 20 percent and 80 percent are mindset.
note:
8moving average ling is blue colour.
20moving average line is green colour
50moving average line is red colour.
200moving average line is black colour.
cpr is for trend analysis.
MA line is for support and resistance.
Disclaimer:
Iam not Sebi registered so i started this as a hobby, please do your own analysis, any profit/loss you gained is not my concern. I can be wrong please do not take it seriously thank you.

Support Holds, Volatility Fades — Fresh Rally Ahead for Nifty?Indian markets were volatile last week. Initial uncertainty after the Union Budget was followed by a strong positive reaction to the India–US trade deal.
Nifty moved in a wide range during the week but ended higher.
India VIX fell by around 12%, showing that volatility has reduced after major events.
◉ Key Levels
Immediate Support: 25,400–25,500
Immediate Resistance: 26,000
Strong Resistance: 26,200–26,300
The sharp sell-off after the gap-up opening found a base near 25,500, establishing it as a strong demand zone.
◉ Technical View
The overall trend remains positive above 25,400. A sustained move above 26,000 is needed for further upside, and a clear breakout above 26,300 could lead to the next rally.
◉ Key Triggers for the Week
India–US Trade Deal: Lower US tariffs (18%) improve visibility for exporters and foreign investors, supporting sentiment.
Inflation Data: Domestic CPI/WPI and global inflation prints will influence interest rate expectations and risk appetite.
Q3 FY26 Earnings: Results from banks, financials, IT, and other index heavyweights will drive sector leadership and Nifty direction.
◉ Trading Strategy
Traders should follow a buy-on-dips strategy near support levels and avoid taking aggressive positions until Nifty decisively moves above the 26,000–26,300 zone.

Axis Bank | Gann Square of 9 Intraday Observation | 11 March 202Disclaimer:
This analysis is for educational purposes only. I am not a SEBI-registered advisor. This is not financial advice.
Symbol: AXISBANK (NSE)
Date Observed: 11 March 2024
Time Frame: 15-Minute Chart
Method: Gann Square of 9 (Price Capacity & Time Alignment)
This post shares a historical intraday observation showing how price interacted with a normal Square of 9 capacity level, leading to a temporary reaction when time and price aligned.
📊 Market Context & Reference Selection
Axis Bank displayed upward momentum after the completion of the first 15-minute candle.
In such market conditions, the low of the first 15-minute candle (~1104) was treated as the 0-degree reference level, following Gann methodology.
This reference point was used to study the session’s expected price expansion.
Correct identification of the reference level is critical for objective Square of 9 analysis.
🔢 Square of 9 Level Mapping
Based on the selected reference:
0 Degree: ~1104
45 Degree (Observed Normal Capacity): ~1121
The 45-degree level often represents the normal intraday movement range under regular market conditions.
⏱️ Observed Price–Time Behavior
Price approached the 45-degree level well before the later part of the trading session.
Early completion of normal price capacity has historically been associated with short-term trend fatigue.
After interacting with this zone, price showed temporary selling pressure and moved lower.
A minor variation around the calculated level was observed, which is common in live market conditions.
This aligns with a widely observed Gann concept:
When expected price capacity is completed early in time, the probability of a reaction may increase.
📘 Educational Takeaways
Square of 9 helps define logical intraday price limits
Early capacity completion can indicate temporary exhaustion
Time plays a supporting role in validating price-degree levels
Small price deviations are normal and should be viewed structurally
The method promotes rule-based observation over prediction
📌 Shared strictly for educational and historical chart-study purposes.
#AxisBank #GannSquareOf9 #WDGann #IntradayAnalysis #MarketEducation #PriceTime #TechnicalAnalysis

Nifty50 analysis(5/2/2026).CPR: wide + decending cpr: bearish consolidtion
FII: 29.79 bought.
DII: 249.54 bought.
Highest OI:
CALL OI: 25800, 26000
PUT OI: 25700
Resistance: - 26000
Support : - 25500
conclusion:. bearish
My pov:
1.still my view price should take support at 25650 then bullish
2.For 200ma line the price must break many time to get support ,so there is highly possible to go down to find support .
3.in 4hour candle has support of 200ma line at 25650 that itself give support or make market consolidate itself there 25650.
4.the price have to take retest and go long until then its a trap. so do not trade until the clear signal.
What IF:
retest possibilities 26000 on the upside
25650 or 25500 on the down side .
psychology fact:
You cant learn every possible way market behaves. If you cant accept uncertanity then you cant take trade without hesitation
note:
8moving average ling is blue colour.
20moving average line is green colour
50moving average line is red colour.
200moving average line is black colour.
cpr is for trend analysis.
MA line is for support and resistance.
Disclaimer:
Iam not Sebi registered so i started this as a hobby, please do your own analysis, any profit/loss you gained is not my concern. I can be wrong please do not take it seriously thank you.

Visualization of a Inverted Head and Shoulders ( Reality ) In this video I talk about general trends of the markets only - no bias - no directional indication - nothing - simply sharing how to create a setup / strategy building and concepts that I learned while becoming a full time trader - Giving back my experience .

Nifty50 analysis(4/2/2026).CPR: wide + ascending cpr: consolidtion
FII: 5,236.28 bought.
DII: 1,014.24 bought.
Highest OI:
CALL OI: 25800, 26000
PUT OI: 25700
Resistance: - 26000
Support : - 25500
conclusion:.
My pov:
1.today price consolidate towards 25250. because it is the place were huge support is seen.
2.in one hour candle the 200ma line is broken for first time , for 200ma line the price must break many time to get support ,so there is highly possible to go down to find support .
3.in 4hour candle has support of 200ma line at 25650 that itself give support or make market consolidate itself there 25650.
4.keep in mind that market is in bullish the price suddenly gapped up so most active player wait for the right place to entry long .
What IF:
market can go down to 25250 max.
if it 26000 is the high max.
psychology fact:
Trust the process, objectify the market, accept uncertainty.
note:
8moving average ling is blue colour.
20moving average line is green colour
50moving average line is red colour.
200moving average line is black colour.
cpr is for trend analysis.
MA line is for support and resistance.
Disclaimer:
Iam not Sebi registered so i started this as a hobby, please do your own analysis, any profit/loss you gained is not my concern. I can be wrong please do not take it seriously thank you.

Powergrid inside Perfect Descending Parallel Channel PatternPowergrid seen travelling perfectly inside the descending channel pattern, taking perfect resistance and support at the channel (from April 2025 till now)
Now seen at the perfect crucial point where it can either move bullish or bearish in the upcoming days
Bearish view gets cancelled on getting past the red dotted line...till that we can't be bullish on Powergrid!!!
Just add to the watchlist and let's watch how its going to move!!!!
will update once the decider move occurs!!!!
Just Sharing my view ...not a tip nor Advice!!!
Thank you!!!

Axis Bank | Gann Square of 9 Intraday Study (Normal Case)Disclaimer:
This analysis is for educational purposes only. I am not a SEBI-registered advisor. This is not financial advice.
Symbol: AXISBANK (NSE)
Date Observed: 12 November 2024
Time Frame: 15-Minute Chart
This post presents a historical intraday observation using the Gann Square of 9, focusing on how normal price movement capacity and time alignment can highlight potential reaction zones.
📊 Market Structure at the Open
Axis Bank displayed upward strength from the first 15-minute candle.
The low of the opening candle (~1166) was used as the 0-degree reference level, following Square of 9 methodology.
This level acts as the base point for mapping the day’s upward price vibration.
Correct identification of the 0-degree reference is essential for consistent Square of 9 studies.
🔢 Square of 9 Level Mapping
Based on Square of 9 calculations:
0 Degree: ~1166
45 Degree (Observed Normal Capacity): ~1183
In intraday analysis, the 45-degree level often represents the stock’s normal price expansion range under typical market conditions.
⏱️ Price & Time Interaction (Observed Behavior)
Price reached the 45-degree level early in the session (around the second 15-minute candle).
Completion of the normal price capacity well before the later part of the trading day has historically shown temporary price pressure.
After interacting with this zone, the market displayed rejection behavior followed by short-term downside expansion.
This aligns with a commonly observed Gann concept:
Early completion of expected price capacity may increase the probability of a reaction.
📘 Educational Takeaways
Gann Square of 9 helps define logical intraday price limits
Normal (45-degree) reactions occur more frequently than exceptional cases
Combining price structure with time context improves market clarity
Small deviations around calculated levels are part of normal market behavior
This approach supports rule-based observation, not prediction
📌 Shared strictly for educational and historical chart-study purposes.

Nifty50 analysis(3/2/2026)Expiry day.CPR: wide + overlapping cpr: slightly bullish and consolidtion
FII: -1,832.46 sold
DII: 2,446.33 sold.
Highest OI:
cant say whats oi because of hugeeeeeeeeee gap up.
Resistance: -
Support : -
conclusion:.
My pov:
1.price has crossed the range 25500, this will be the strong support for today.
2.there is a huge gap up so market makes another rally because of short covering wait for first one and trade.
3. today is expiry that also has volatality, mind that.
What IF:
1.today market can break ATH.
2.can retest from high because most of the smart money try to entry at low .
psychology fact:
Trading fails not because of lack of opportunity,
but because most minds can’t handle unlimited freedom.
note:
8moving average ling is blue colour.
20moving average line is green colour
50moving average line is red colour.
200moving average line is black colour.
cpr is for trend analysis.
MA line is for support and resistance.
Disclaimer:
Iam not Sebi registered so i started this as a hobby, please do your own analysis, any profit/loss you gained is not my concern. I can be wrong please do not take it seriously thank you.

Continuation of the Liquidity Grab concept I make educational content videos for trading, this will be a continuation of what happens after a liquidity grab in the markets
No Bias - No predications - only telling concepts and information on general trends of index

Nifty50 analysis(2/2/2026).CPR: wide + descending cpr: consolidation.
FII: -588.34 sold
DII: -682.73 sold.
Highest OI:
25000 put oi.
24800 to 24600call oi.
Resistance: strong 25000.
Support :rising support 24800,24700,24600
conclusion: wide cpr shows high volatility.
My pov:
1.today price will not act accoding to indicators, if support is taken from the above level market will sustain if not it will move down side.it just breaks every resistance and move above.and breaks if and go down.
2.wait for the clear signal and trade responsibly.
What IF:
1.if market close above 24900 then retest.(possibily) and continuation.
2.if closed below 24800 then 24500 is then next support .
Note:
find what happened on this days:
1.20/9/2019.
2.07/04/2025.
3.09/03/2023.
psychology fact:
People are attracted to trading because it offers total freedom
but most people are not psychologically prepared to handle that freedom.
note:
8moving average ling is blue colour.
20moving average line is green colour
50moving average line is red colour.
200moving average line is black colour.
cpr is for trend analysis.
MA line is for support and resistance.
Disclaimer:
Iam not Sebi registered so i started this as a hobby, please do your own analysis, any profit/loss you gained is not my concern. I can be wrong please do not take it seriously thank you.

Nifty50 analysis(1/2/2026)CPR: narrow + overlapping lower cpr: trending(slight bearish).
FII: 2,251.37 bought
DII: -601.03 sold.
Highest OI:
25300 and 25500 put oi.
25300 and 25200 call oi.
Resistance: strong 25500.
Support :weak 25200
Event:
Exchanges are conducting a special live trading session on Sunday, 01-Feb-26, on account of the presentation of the Union Budget.
conclusion: market shows weaknesses.
My pov:
1.when we look at the overall view market tightly consolidate range 25500-25200, if it breaks either a good trend can form. highly down side possible for now.
2.today Sunday market can be choppy too because how many will know today is a trading day.
3.overall market gives bearishness volume, MA lines, cpr in day candle any resistance or negative news can affect the market severe.
4.this bearishness is for the short term until huge support given .
What IF:
1.25500-25250 this must be broken for clear confirmation.
2.if range broken above then 26000, if broken below 24900 as the target.
3.if any shows strongness today or good news highly possible a good trend in day candle.
Note:
watch the volume in day candle something is fishy we gonna ride a huge trend sooner.
psychology fact:
never trade news or events. wait till uncertainty becomes certain.
note:
8moving average ling is blue colour.
20moving average line is green colour
50moving average line is red colour.
200moving average line is black colour.
cpr is for trend analysis.
MA line is for support and resistance.
Disclaimer:
Iam not Sebi registered so i started this as a hobby, please do your own analysis, any profit/loss you gained is not my concern. I can be wrong please do not take it seriously thank you.

Nifty spot 25320.65 by Daily Chart view - Weekly UpdateNifty spot 25320.65 by Daily Chart view - Weekly Update
- Support Zone 24775 to 25075 for Nifty Index
- Resistance Zone 25325 to 25625 for Nifty Index
- Nothing major Domestically except for the unwarranted Geo-Political scenario affecting our Stock Markets

Nifty50 analysis(30/1/2026).CPR: wide + overlapping cpr: range day.
FII: -393.97 sold
DII: 2,638.76 bought.
Highest OI: 25500 put oi. and 25300 and 25200 call oi.
P.C.R: 1 bearish.
Resistance:25500.
Support : 25200
Event: Budget on Feb. 1
conclusion: bullish but retest is highly possible.
My pov:
1.market opens with gap down almost 100 points.
2.until 25200 is crossed below down only bullish pov.
3.IN one hour candle if it takes support at 50ma (red line ) from there the bullish trend continues.
4. budget is highly a anticipated event so uncertanity highly present trade accodingly. anything can happen on monday. wait until event is closed.
What IF:
1.if price breaks 25200 and 25450 closed in day candle then overall trend bearish
psychology fact:
Fight like you deserve to win, but don’t focus on the outcome.
note:
8moving average ling is blue colour.
20moving average line is green colour
50moving average line is red colour.
200moving average line is black colour.
cpr is for trend analysis.
MA line is for support and resistance.
Disclaimer:
Iam not Sebi registered so i started this as a hobby, please do your own analysis, any profit/loss you gained is not my concern. I can be wrong please do not take it seriously thank you.

Nifty50 analysis(29/1/2026).CPR: narrow + ascending cpr: trending day.
FII: 480.26 bought
DII: 3,360.59 bought.
Highest OI: 25500and25300 put oi and 25300 and 25200 call oi.
P.C.R: 0.8 mild bullish.
Resistance:25500.
Support : 25150
conclusion:
My pov:
1.the first price resistance is 25450 if it crossed then bulish.
2.until 24900 is crossed below down only bullish pov.
3.today trending day so plan accordingly.
What IF:
1.if price breaks 24900 and closed in day candle then overall trend continues.
2.bullishness continues if it crossed 25450.
psychology fact:
embrace uncertainty, become skilled don't wait, go for it.
note:
8moving average ling is blue colour.
20moving average line is green colour
50moving average line is red colour.
200moving average line is black colour.
cpr is for trend analysis.
MA line is for support and resistance.
Disclaimer:
Iam not Sebi registered so i started this as a hobby, please do your own analysis, any profit/loss you gained is not my concern. I can be wrong please do not take it seriously thank you.

Nifty50 analysis(28/1/2026).CPR: overlapping + descending cpr: consolidation day.
FII: -3,068.49 Sold
DII: 8,999.71 bought.
Highest OI: too soon to tell
Resistance:25500.
Support : 24900.
conclusion:
My pov:
1.yesterday clearly DII support with 9000cr. today a positive almost 300 point gap. this gap will not sustain.
2.price will drift towards yesterdays high or today cpr only then price goes upward.
3.wait for the price come to your range so you can buy at bottom.
What IF:
1.if price breaks 24900 and closed in day candle then overall trend continues.
2.if the gap sustained from openning then 25600 will be the resistance .
psychology fact:
A setbacks as the result of minor, controllable, situations that have nothing to do with them personally.
note:
8moving average ling is blue colour.
20moving average line is green colour
50moving average line is red colour.
200moving average line is black colour.
cpr is for trend analysis.
MA line is for support and resistance.
Disclaimer:
Iam not Sebi registered so i started this as a hobby, please do your own analysis, any profit/loss you gained is not my concern. I can be wrong please do not take it seriously thank you.

NAUKRI - Shorting opportunity?!!!Naukri - Info edge is consistently making highs and lower highs and lows and lower lows
Its been forming a channel pattern...which is perfectly visible...
Targets and sl levels as mentioned @ chart!!!
This bearish view goes nullified on making the higher high(sl level)
Let's wait and watch!!!
Just my view...not a tip nor advice!!!!
Thank you!!!

Nifty50 analysis(27/1/2026)Expiry.CPR: wide + descending cpr: consolidation day.
FII: -4,113.38 Sold
DII: 4,102.56 bought.
Highest OI: 25000 both PE and CE
Resistance: In 4hour candle the resistance lies 20ma and 200ma.
Support : recent low 24900.
conclusion:
My pov:
1.market can be choppy today because of high oi on both side and cpr indicates wide cpr. check both 4hour and daily candle for 200ma line.
2.any timeframe once the 200ma is crossed price can retest 200ma or can be fake breakout. also take support from there. bigger timeframe it hard to break 200ma line support.
3.today if price broke below 24900 in a day candle trend continues.
psychology fact:
A lazy mind creates a miserable future; a hardworking mind creates destiny.
note:
8moving average ling is blue colour.
20moving average line is green colour
50moving average line is red colour.
200moving average line is black colour.
cpr is for trend analysis.
MA line is for support and resistance.
Disclaimer:
Iam not Sebi registered so i started this as a hobby, please do your own analysis, any profit/loss you gained is not my concern. I can be wrong please do not take it seriously thank you.

NIFTY 50 – Weekly Outlook (Key Levels & Structure)
NIFTY has decisively broken below the rising trendline that was supporting the index for the past few months. This trendline had multiple confirmations, and the breakdown signals a shift from bullish to corrective / sideways-to-bearish structure in the near term.
The index is currently testing a crucial horizontal support zone around 25,000–25,050. This level will be very important for next week’s price action.
⸻
Key Levels to Watch
Support Zones:
• 25,000 – 25,050 → Immediate and psychological support
• 24,600 – 24,650 → Major demand zone (next downside support)
• 24,350 – 24,400 → Strong long-term support if selling accelerates
Resistance Zones:
• 25,350 – 25,450 → Minor pullback resistance
• 25,750 – 25,850 → Breakdown retest zone
• 26,200 – 26,350 → Strong supply / rejection zone
⸻
Market Structure View
• As long as price remains below the broken trendline, rallies may face selling pressure.
• A sustained hold above 25,450 can lead to short-term relief bounce.
• Break and hold below 25,000 may open gates for 24,600 levels in coming sessions.
• Expect volatile moves, especially around weekly expiry and global cues.
⸻
Trading Approach
• Prefer wait & watch near support levels
• Avoid aggressive trades in the middle of the range
• Let price confirm direction before taking positional bias
⸻
Disclaimer
I am not a SEBI registered analyst/advisor.
This analysis is only for educational and informational purposes.
This is NOT a buy or sell recommendation.
Trading in the stock market involves risk. Please consult your financial advisor before taking any trade.
I am not responsible for any profit or loss arising from this analysis.

Dalal Street Shaken Ahead of Monthly Expiry — What’s Next?Indian equity markets witnessed a sharp corrective move last week, with the Nifty sliding nearly 2.5% to close around 25,050. The sell-off came at a sensitive juncture—just ahead of monthly expiry.
Adding to the nervousness, India VIX jumped sharply by 24.8% to 14.19, signaling a sudden rise in uncertainty and trader caution.
A combination of geopolitical tensions, pre-Union Budget 2026 jitters, and mixed Q3 earnings weighed heavily on market sentiment, prompting profit booking across sectors.
◉ Technical Setup
Nifty is currently testing the lower end of its rising channel, a technically important area. A mild relief bounce is possible from these levels.
However, a decisive breakdown below the channel support could trigger another leg of sharp selling in the coming sessions, making this zone extremely crucial for near-term direction.
◉ Key Levels to Watch
Support Zones
25,000 – 24,900: Immediate psychological and technical support
24,500 – 24,400: Strong base with heavy put writer concentration
Resistance Zones
25,400 – 25,500: Immediate hurdle with significant call writing
26,000 – 26,100: Major supply zone and strong resistance
◉ Near-Term View
Volatility is likely to remain elevated in the coming week. While the broader structure has weakened, a short-term bounce from the 25,000 zone cannot be ruled out, given oversold conditions and strong psychological support.
That said, any recovery should be viewed with caution and may face stiff resistance at higher levels.
◉ Suggested Strategy
A cautious, stock-specific strategy is preferred for the week ahead. Short-term oversold signals may support a bounce, but the broader trend has weakened. Avoid aggressive longs and focus on protecting gains.

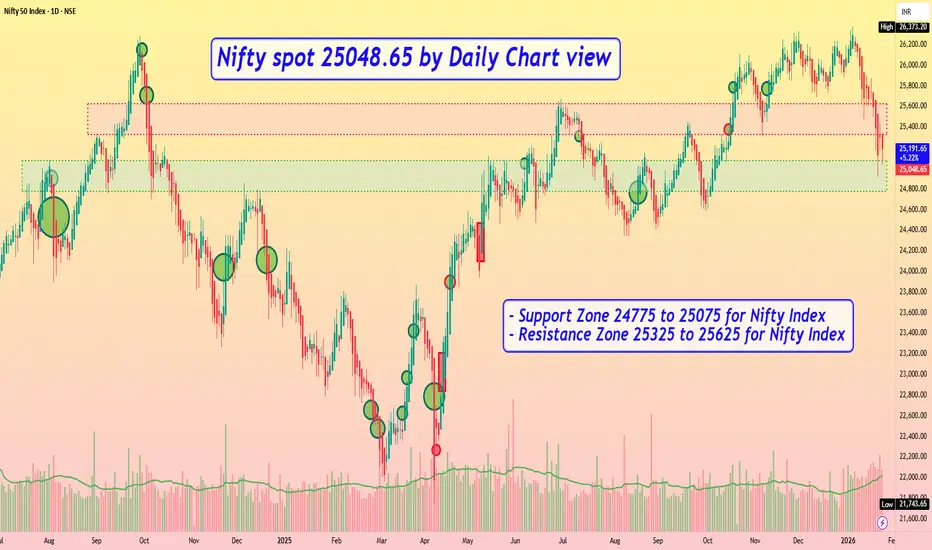
Nifty spot 25048.65 by Daily Chart view - Weekly UpdateNifty spot 25048.65 by Daily Chart view - Weekly Update
- Support Zone 24775 to 25075 for Nifty Index
- Resistance Zone 25325 to 25625 for Nifty Index
- Since a while the indicative Support and Resistance Zone are just an eyewash, as they hardly sustain by the unprecedented Geo-Political happenings
Nifty 50The price has been moving in assending channel for many years . Currently the price is near the bottom support of this ascending channel. There is a horizontal resistance which , if it crosses we could expect a parabolic move in prices towards the upward side of the channel. Let's see how it moves.
