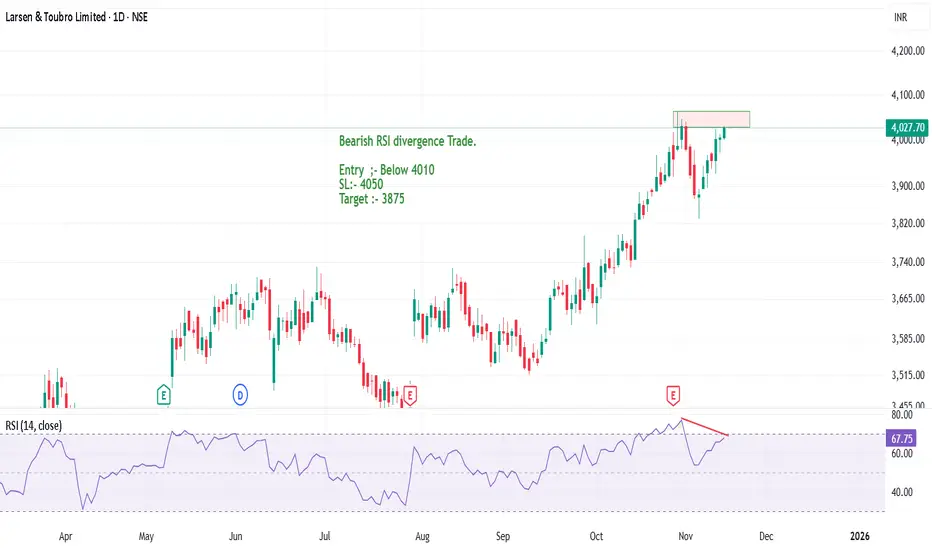
L&T forming a new high or Double Top pattern?Larsen & Toubro is showing a strong bearish RSI divergence on the daily charts. There can be an opportunity to sell the stock in coming trading sessions.
The stock has performed fabulously and good returns has been yeilded by the stock.
If there is a bearish price action, a double top pattern confirmation, good R:R trade can be capture in the stock.
Entry :- Below today's low (4000)
Stop Loss :- 4055
Target :- 3875
A swing trade can be initated in the stock with Target 1 as 3875 and trailing SL for next target upto 3780.
Target 2 can also be made with the help of the 50 EMA.
In case price tries to form a new high is can be shorted only when there is some negative sentiment and price action in the stock.
Nifty50
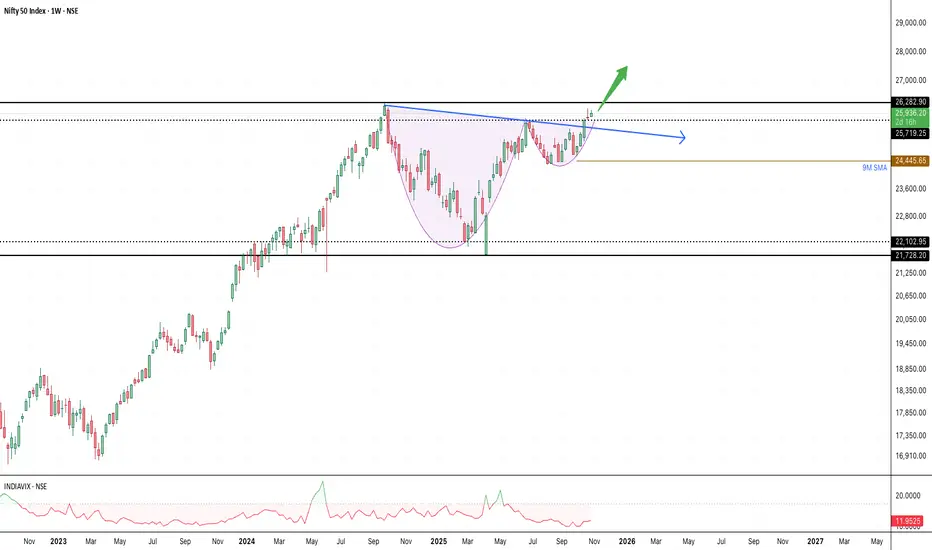
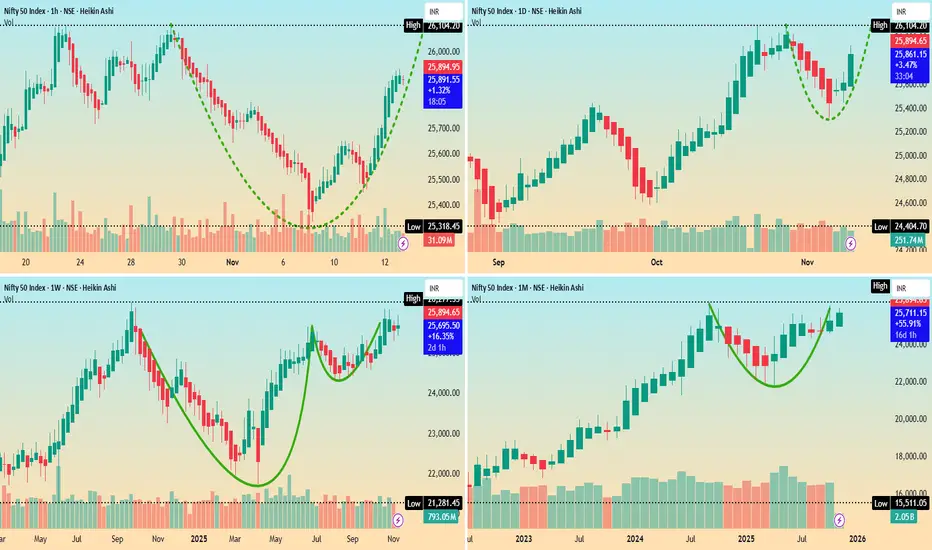
Cup & Handle & Momentum: Nifty’s Charge Toward New Highs !🚀 "Cup, Handle & Momentum: Nifty’s Charge Toward New Highs!"
📈 Understanding the Cup & Handle Pattern
The Cup & Handle is one of the most recognized bullish continuation patterns in technical analysis. It visually resembles a teacup:
Cup Formation: Prices decline from a peak, stabilize, and then gradually recover to retest the prior high. This rounded bottom reflects accumulation and investor confidence returning.
Handle Formation: After the cup completes, prices consolidate sideways or slightly downward, forming a smaller dip. This is the market’s “pause,” shaking out weak hands before the next leg higher.
Breakout: When price breaks above the handle’s resistance, it signals renewed buying interest and often leads to strong upward momentum.
In the case of Nifty 50, the cup began forming after the September 2024 all-time high of 26,277. The recent breakout from the handle on the weekly chart suggests that the consolidation phase is complete, and buyers are back in control.
🔍 RSI: The Momentum Gauge
The Relative Strength Index (RSI) is a momentum oscillator that measures the speed and magnitude of price movements.
Range: RSI moves between 0 and 100.
Key Levels:
Above 50 → bullish momentum.
Sustaining above 60 → strong trend confirmation.
Above 70 → overbought, but in strong bull runs, RSI can remain elevated for extended periods.
Currently, Nifty’s RSI is holding above 50 and sustaining near 60, which indicates that momentum is not just positive but strengthening. This aligns perfectly with the breakout from the cup & handle pattern, reinforcing the probability of surpassing the previous high.
⚡ Why This Matters for Learners
Chart Patterns like the Cup & Handle teach us how collective psychology plays out in markets: fear, consolidation, and renewed optimism.
RSI adds a layer of confirmation, showing whether momentum supports the breakout or if it’s likely to fail.
Together, they provide a structured, disciplined approach to studying markets—without cluttering charts with excessive indicators.
🔔 The Big Picture
With the cup & handle breakout and RSI strength, Nifty 50 looks poised to challenge and potentially surpass its September 2024 all-time high of 26,277. If sustained, this could mark the beginning of a fresh leg in India’s equity market rally.

Today(17/11/2025),nifty50 analysis.
CPR: slightly wide + overlapping lower cpr: sideways to bearish.
FII: -4,968.22 sold.
DII: 8,461.47 bought.
Highest OI:
Resistance: 26000, 26100
Support : 25800,25700
conclusion:
My pov: market is neutral to bearish, If and only 26100 is closed and crossed i view as bullish trend lets wait and watch. why because FII keep selling, That the reason i cant clearly think market is in bullish,
psychology fact : Trading is a profession where you have to think freely and creatively.
note:
8moving average ling is blue colour.
20moving average line is green colour
50moving average line is red colour.
200moving average line is black colour.
cpr is for trend analysis.
MA line is for support and resistance.
Disclaimer:
Iam not Sebi registered so i started this as a hobby, please do your own analysis, any profit/loss you gained is not my concern. I can be wrong please do not take it seriously thank you.

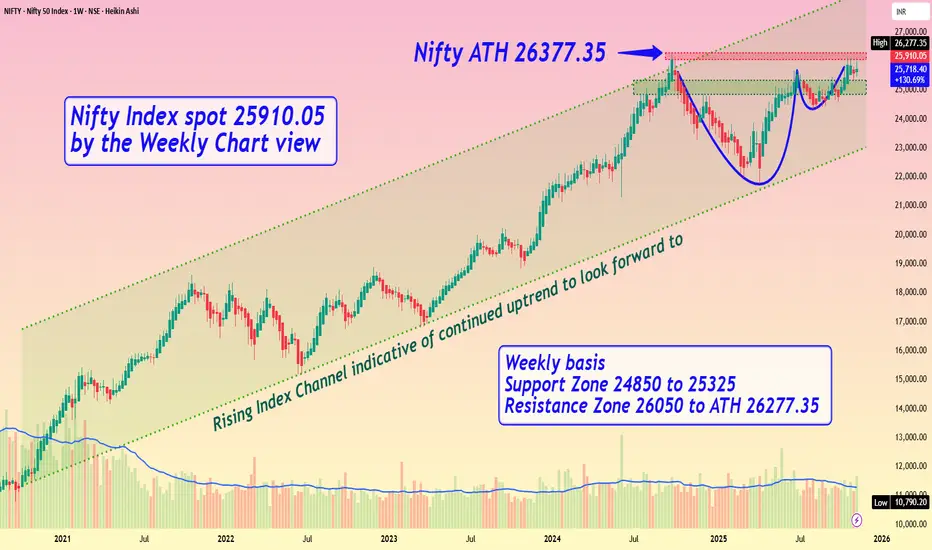
Nifty Index spot 25910.05 by the Weekly Chart viewNifty Index spot 25910.05 by the Weekly Chart view
- Weekly basis - Support Zone 24850 to 25325
- Weekly basis - Resistance Zone 26050 to ATH 26277.35
- Rising Index Channel indicative of continued uptrend to look forward to .....
- Bullish Cup and Handle pattern shows breakout expectation from Resistance Zone
L&T Multiyear BreakoutLarsen & Toubro Limited - Multi-Timeframe Breakout Analysis
Current Price:4,004.40
CRITICAL SETUP ALERT
L&T is at a pivotal moment with breakouts confirmed on weekly and monthly timeframes. The stock is now in a crucial period that will determine the validity of this range breakout.
KEY TECHNICAL OBSERVATIONS
Weekly Chart Analysis:
- Nearly 1.9 Years of Consolidation (2023-2025) between 3,200-3,800
- Clean breakout above 3,800 resistance with strong momentum
- All major EMAs (20/50/100/200) aligned bullishly
- Long accumulation phase suggests institutional participation
Monthly Chart Analysis :
- Breakout confirmed above 4,250 resistance box
- Strong bullish candle with healthy volume expansion
- EMAs: 20 | 50 |100 I 200 - all rising
Current Status:
✅ Breakout happened on weekly/monthly charts
⏳ Awaiting confirmation via follow-up candle close
📈 Price holding above breakout zone shows strength
🎯 PRICE TARGETS
Based on the range breakout and Fibonacci projections:
- Target 1: 4,451.25 (Immediate resistance)
- Target 2: 4,809.60 (Major psychological level)
- Target 3: 5,424.35 (Extended target - 35% upside)
- Target 4: 5,750+ (Bullish scenario)
📌 CRITICAL LEVELS
Support Zones:
- S1: 3,740 (Breakout retest level)
- S2: 3,611 (20 EMA on weekly)
- S3: 3,419 (Consolidation top - breakdown level)
WHAT MAKES THIS SETUP SPECIAL?
1. Time Factor: 1.9 years of consolidation = strong base building
2. Multi-Timeframe Alignment: Breakout on both weekly AND monthly charts
3. Volume Confirmation: Significant expansion during breakout
4. Long-Term Trend: Steep uptrend from 2020 lows still intact
For Conservative Traders:
- Wait for successful retest of 3,740-₹3,800 zone
- Confirm with strong bounce and volume
- Enter on confirmation with tighter stops
For Long-Term Investors:
- Accumulate on any dip to 3,700-3,800
- Strong fundamental backing (Infrastructure leader)
- Multi-year breakout suggests sustained momentum
- Target: 5,500-6,000 (12-18 months)
- ❌ Failure Signal: Close below 3,740 = False breakout, back to range
What to Watch:
1. Monthly candle close (crucial for pattern confirmation)
2. Volume sustenance above breakout level
3. No bearish engulfing on weekly/monthly timeframe
4. Hold above previous consolidation high (3,800)
DISCLAIMER:
This analysis is for educational purposes only and NOT financial advice.
- Technical patterns may fail; past performance doesn't guarantee future results - Breakouts can be false; always use stop losses - Conduct your own research and consult a financial advisor - The author may or may not hold positions in L&T - Trading/investing involves substantial risk of capital loss - You are solely responsible for your investment decisions
**Trade responsibly with proper risk management.**
#LarsenToubro #LT #Breakout #TechnicalAnalysis #NSE #Infrastructure #RangeBreakout #MultiTimeframe #BlueChip #IndianStocks

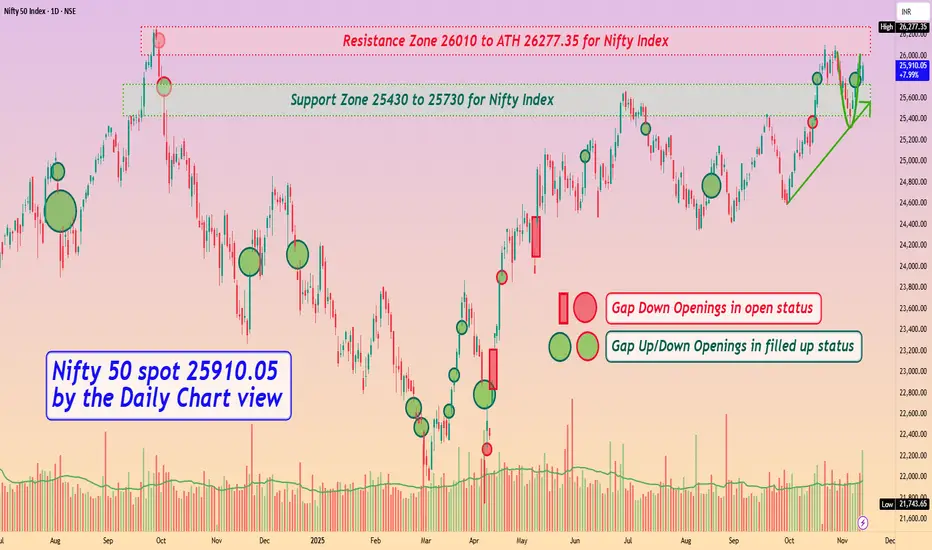
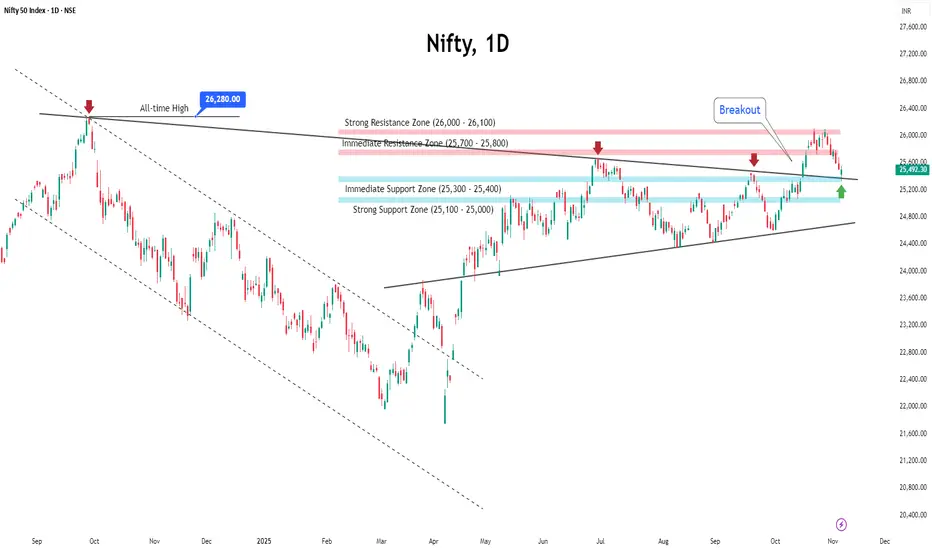
Nifty 50 spot 25910.05 by Daily Chart view - Weekly UpdateNifty 50 spot 25910.05 by Daily Chart view - Weekly Update
- Support Zone 25430 to 25730 for Nifty Index
- Resistance Zone 26010 to ATH 26277.35 for Nifty Index
- Rising Support Trendline seems respected by weekly positive closure
- Rounding Bottom Bullish momentum by Resistance Zone neckline seems sustained
- Nifty timidly shy from creating a New Lifetime High by crossing ATH final hurdle remains effectively elusive
Today(13/11/2025),Nifty50 analysis.
CPR: narrow+ascending cpr: trending.
FII: -1750.03 sold.
DII: +5127.12 bought.
Highest OI:
Resistance: 26000
Support : 25800,25700
Events.
1.Bihar elections result on Friday from morning.
conclusion:
My pov: there is uncertainty so no view until the event is over, and preserve the capital.
psychology fact : It is important to make sure that your losses are reasonable.
note:
8moving average ling is blue colour.
20moving average line is green colour
50moving average line is red colour.
200moving average line is black colour.
cpr is for trend analysis.
MA line is for support and resistance.
Disclaimer:
Iam not Sebi registered so i started this as a hobby, please do your own analysis, any profit/loss you gained is not my concern. I can be wrong please do not take it seriously thank you.

Nifty 50 Index spot 25890 Multi Timeframe viewsNifty 50 Index spot 25890 Multi Timeframe views
Major Timeframes showing Bullish Chart view by Hourly, Daily, Weekly and Monthly, so hope for the best to happen 🤞🏼😊
Daily analysis Nifty: 12/11/25Daily levels for Nifty. Gift Nifty is trading higher, and if the price opens with a gap up, it is expected to fill the gap and then continue to rise. All the possibilities are shared here.

nifty50 analysis 11/11/2025.todays (11/11/2025)(nifty50 expiry).
CPR:very narrow+ascendingcpr : trending day
FII:-4,114.85sold.
DII:5,805.26bought.
Highest OI:
Resistance:25700,25800.
Support :25400,25300.
Possibilities:
1hour timeframe
1.nifty can fall from 50ma line because its not sloping upward.
2.market is not clearly uptrend so todays range is 25750 to 25300.
3.also it can take support at 200maline or can break.
conclusion:
My pov: market is can be bearish.if price in its my range i will confirm and then go short,if not i will never trade,also today is expiry, do your own research and be flexible
note:
8moving average ling is blue colour.
20moving average line is green colour
50moving average line is red colour.
200moving average line is black colour.
cpr is for trend analysis.
MA line is for support and resistance.
Disclamier:
Iam not sebi registed so i started this as a hobby,please do your own analysis,any profit/loss you gained is not my concern.I can be wrong please do not take it seriously thank you.
.

Monthly analysis for Nifty: 09/11/25I tried to make it as elaborate as I could to give a clear picture of the Nifty trend in November. If there is any doubt or question, you can drop in the comment section.
Right now, it is in between the zone of cluster of support/resistance

Nifty Slips for 2nd Week: Consolidation Ahead amid Rising VIXIndian markets ended lower for the second straight week, weighed down by persistent foreign fund outflows, mixed corporate earnings, and cautious global cues.
Nifty slipped nearly 0.8% to close at 25,490, while India VIX rose over 3% to 12.55, reflecting a slight uptick in market volatility.
Key Levels to Watch
Nifty is currently retesting the apex of its ascending triangle breakout, around the 25,300–25,400 zone. This area is supported by significant put writing, as reflected in recent open interest data, making it an important near-term support.
Below this, the next strong support lies near 25,000.
On the upside, the 25,700–25,800 zone could act as an immediate resistance due to heavy call writing, while 26,000 remains a major resistance level to watch.
Outlook
Given the current setup, markets are likely to trade within a neutral range in the coming week. Volatility may stay elevated as global uncertainties, FII outflows, and a busy flow of economic and earnings data continue to influence sentiment.
While near-term sentiment remains cautious, strong domestic macro fundamentals and steady corporate performance are expected to provide underlying support to the broader trend.
Traders are advised to stay stock-specific, focusing on banking and financials—particularly PSU banks—which continue to display relative strength.
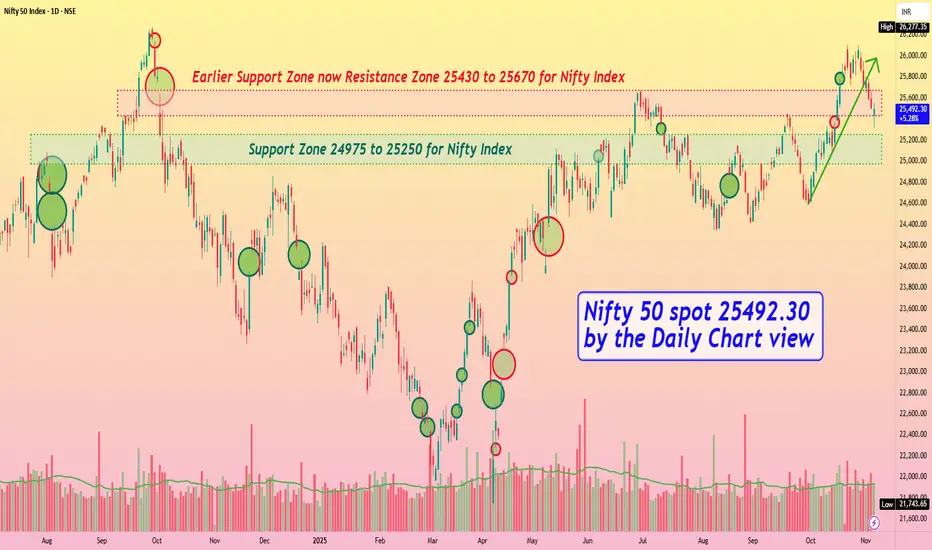
Nifty 50 spot 25492.30 by the Daily Chart view - Weekly updateNifty 50 spot 25492.30 by the Daily Chart view - Weekly update
- Support Zone 24975 to 25250 for Nifty Index
- Earlier Support Zone now Resistance Zone 25430 to 25670 for Nifty Index
- Rising Support Trendline Breakdown done basis the ongoing weak sentiments in general
- The final hurdle ATH remains elusive and Nifty keeps distinctly shy to create a New Lifetime High
NAUKRI - Shorting opportunity?!!!Naukri - Info edge is consistently making highs and lower highs and lows and lower lows
Its been forming a channel pattern...which is perfectly visible...
Targets and sl levels as mentioned @ chart!!!
This bearish view goes nullified on making the higher high(sl level)
Let's wait and watch!!!
Just my view...not a tip nor advice!!!!
Thank you!!!

Nifty 50 Technical Analysis Nov 3-7, 2025Next Week Vibes: Nov 3-7, 2025
~~ 25,722 close, Nifty eyes a breakout above 26,400 for glory towards 28k—or a dip test at 25,300 support if breaks then bears roar. Metal & PSU Banks stealing the show; will bulls charge or profit-book?
Disclaimer
High Risk Investment
Trading or investing in assets like crypto, equity, or commodities carries high risk and may not suit all investors.
Analysis on this channel uses recent technical data and market sentiment from web sources for informational and educational purposes only, not financial advice. Trading involves high risks, and past performance does not guarantee future results. Always conduct your own research or consult a SEBI-registered advisor before investing or trading.
This channel, Render With Me, is not responsible for any financial loss arising directly or indirectly from using or relying on this information.

NIFTY Weekly OutlookNIFTY Weekly Outlook
NIFTY has closed almost flat but with bearish sentiment last week, ending at lows. 2 Consecutive rejection candles at 26100 has been formed in weekly TF. Hourly major swings are placed 26115 and 25690. Neutrally we should wait for breakout of any to plan the directional trade.
After a small pullback if index breaks 25690 then index will test 25100 zone as per Half Bat pattern.
By any chance if low of the current week does not break and breaks 26115 in the higher side, index will show double force move above 26115 to a new All Time High.
I am Not SEBI Registered
This is my personal analysis for my personal trading. Kindly consult your financial advisor before taking any actions based on this.

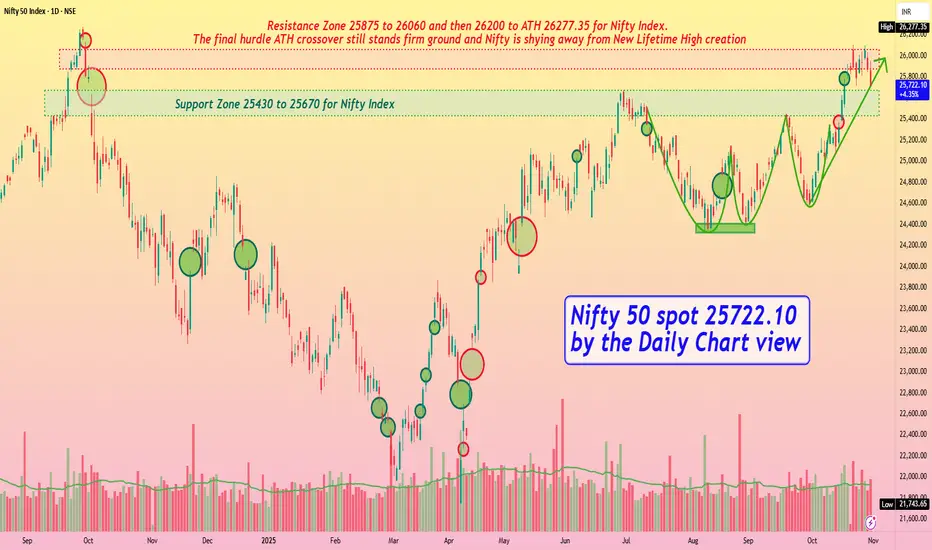
Nifty 50 spot 25722.10 by the Daily Chart view - Weekly UpdateNifty 50 spot 25722.10 by the Daily Chart view - Weekly Update
- Support Zone 25430 to 25670 for Nifty Index
- Rising Support Trendline seems in active mode but may be broken
- Nifty below Resistance Zone but taking rest tad above the Support Zone
- Resistance Zone 25875 to 26060 and then 26200 to ATH 26277.35 for Nifty Index
- Bullish Rounding Bottoms seems active but continued skepticism keeping the Nifty index weak
- The final hurdle ATH crossover still stands ground and Nifty shying away from New Lifetime High creation
Daily Analysis Nifty: 31/10/25Too much volatility in the prices of Nifty.
Right now, the greed zone is active in the market. 25770 is a subtle support level, but the bearish market is still not around the corner unless it is trading above 25400. 300 points of consolidation are evident. Any clear trend will be on the break of either side.

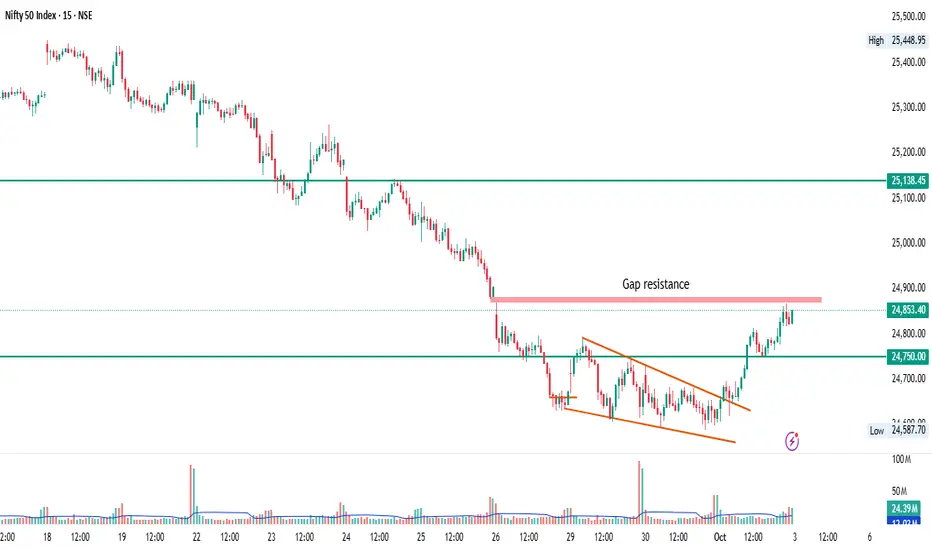
NIFTY 50 – Intraday level 15min TFNIFTY 50 – Gap Resistance Test After Falling Wedge Breakout
Timeframe: 15 min
📌 Key Observations:
Falling wedge pattern formed over the last few sessions, followed by a clean breakout with rising volume.
Price has now rallied toward the gap resistance zone near 24,880–24,900, where supply previously stepped in.
24,750 is acting as immediate support — the level from where the breakout initiated.
Next resistance to watch is 25,138, which aligns with a previous structure zone.
📈 Trading Plan:
✅ Bullish if:
Price sustains above the 24,880–24,900 gap resistance
Then potential upside towards 25,050 / 25,138
⚠️ Caution if:
Price gets rejected at the gap resistance
Watch for pullback retest around 24,750
🔍 Sentiment:
Short-term recovery is in play after a prolonged downtrend, but the current zone is a make-or-break resistance.
Adanient - Strong Bullish Momentum!!!Adanient showing Strong Bullish momentum
- Rounding bottom
-Inverted head and shoulders pattern
-Expanding channel pattern(shown as white dashed line)
-making higher highs and lower lows consistently
Target and Sl mentioned @ chart
not a tip nor advice...just sharing my view!!!!!
Thank you !!!

Daily analysis Nifty: 29/10/25Nifty is with a slight gap up, and the levels to be traded are shared in the video. Main bias is bullish, and for the bearish side, there is are cluster of supports to be more careful today.

Nifty 50 Contracting Triangle in 1hr🔹 What is a Contracting Triangle?
A Contracting Triangle is a sideways corrective pattern made up of five overlapping waves (A–B–C–D–E) that move within converging trendlines — meaning the highs get lower, and the lows get higher.
It reflects a balance between bulls and bears, where each wave becomes smaller as price compresses before a final breakout.
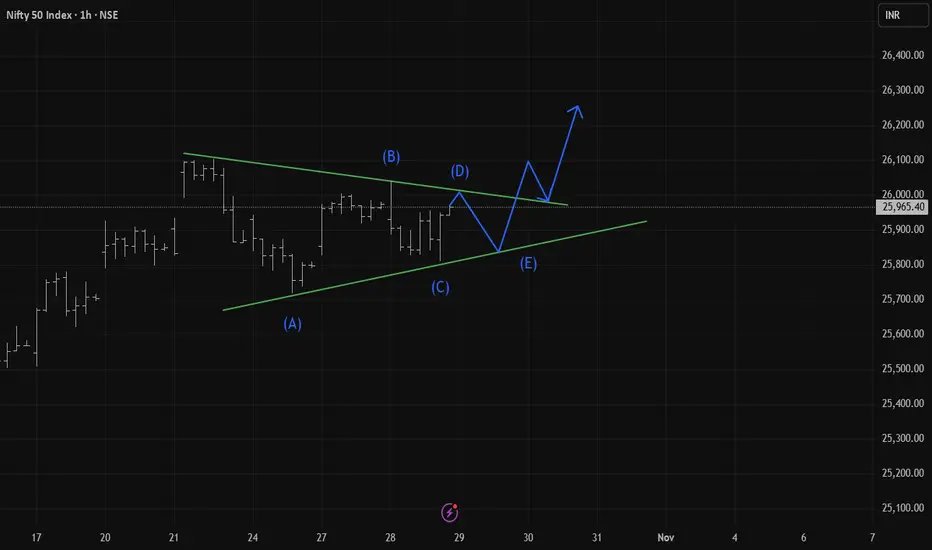
Its Nifty making Cup and Handle. At weekly timeframe. Chart patterns performs well when appears on big timeframe. Here its weekly chart of Nifty making Cup and Handle lets see how it performs in future. For Learnings only.