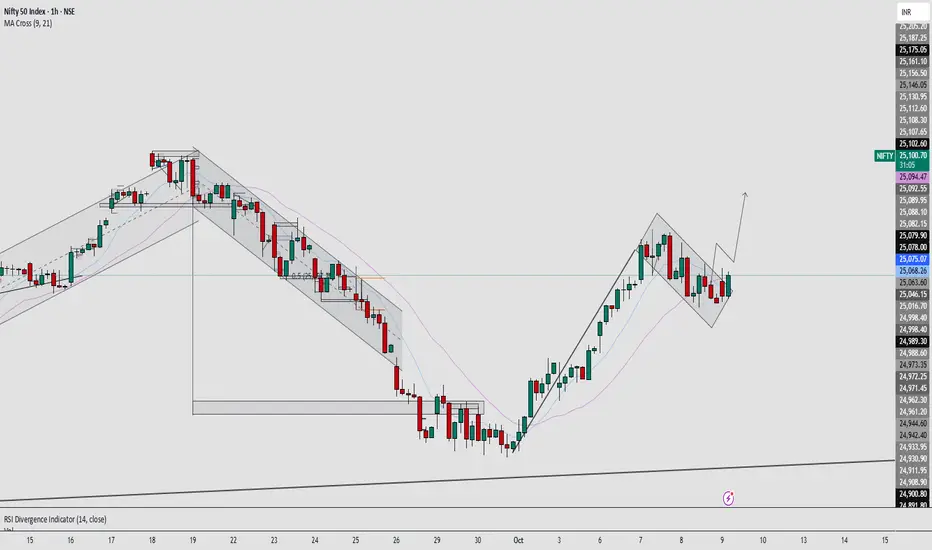
NIFTY 50 – Bullish Flag Breakout in Progress | Continuation NIFTY 50 is showing a clean bullish flag breakout on the 1H chart after a strong impulsive leg from recent lows.
This consolidation phase acted as a flag correction, where price stayed within a downward-sloping channel before breaking to the upside.
The breakout suggests a continuation of the existing uptrend , supported by price closing above the EMA cluster and reclaiming short-term momentum.
Key Observations:
🚀 Impulsive bullish rally followed by tight flag formation.
🔹 Breakout candle confirming strength above 25,080 zone.
📈 If momentum sustains, next upside targets are 25,180 → 25,250 → 25,300.
⚠️ Invalid if price falls back below 25,05 0 with strong volume.
NIFTY breaking out from a bullish flag pattern 🚀
Continuation setup in play after a strong impulse move.
🔹 Above 25,080 = bullish
🔹 Targets: 25,180 / 25,250 / 25,300
🔹 Invalidation: below 25,050
#NIFTY #PriceAction #Breakout #BullishFlag #TechnicalAnalysis #HenishMavani
Niftyanalysis
Nifty is ready for 26000We are expecting Nifty to reverse from the important demand zone of 25050.
After the reversal, we can expect Nifty to reach above 26000. RSI is also indicating the reversal signal on the 30-minute timeframe.

Nifty Index (Research for 16 Sep Expiry)NIFTY is running from supportive trendline. ..PCR has also come in favour of CE( ie indicating that CE buyers/ Put sellers are showing their strength. Coming expiry will probably closes in green
Nifty CMP-25114
expecting Targets- 1) 25220 ,
2) 25330 ,
3) 25420
Intraday Support- 25025, 25980
Major support (I think we won't need it in this expiry) - 24750

August Iron Condor Setup on Nifty – Premium Eating Strategy!Hello Traders!
Just like we nailed the July Iron Condor, here comes the fresh setup for August expiry.
Nifty is trading around 24680 and we are seeing tight range movement with no clear trend for now. In such times, Iron Condor becomes a powerful income-generating strategy for option sellers, especially if the market stays within a defined range.
So here's the plan:
Strategy Type:
Bullish Iron Condor on Nifty (28th August 2025 expiry)
Position Details:
Sell 2x 24300 PE @ 130.05
Buy 2x 23800 PE @ 53.75
Sell 2x 25000 CE @ 172.50
Buy 2x 25500 CE @ 49.30
Strategy payoff graph:
Strategy Rationale:
We’ve created a wide range between 24101 to 25199 as our breakeven zone. As long as Nifty stays in this range by expiry, we collect full premium and enjoy time decay.
Why We Call It Bullish Iron Condor:
We’ve kept the Put side tighter and Call side slightly wider, meaning we have a bullish bias but still want to benefit from a range-bound expiry.
Rahul Tip:
Don’t go for iron condors blindly, always check for major events, news, or breakout signals. A sudden breakout or breakdown can flip your setup. Adjust or exit if market moves out of your defined zone.
Disclaimer:
This strategy is for educational purposes only. Please do your own risk management and position sizing. Avoid taking full quantity at once — better to scale in once the range confirms.
Nifty Intraday Analysis, Key Levels & Trade Plan for 14 Aug 2025Good Morning Traders,
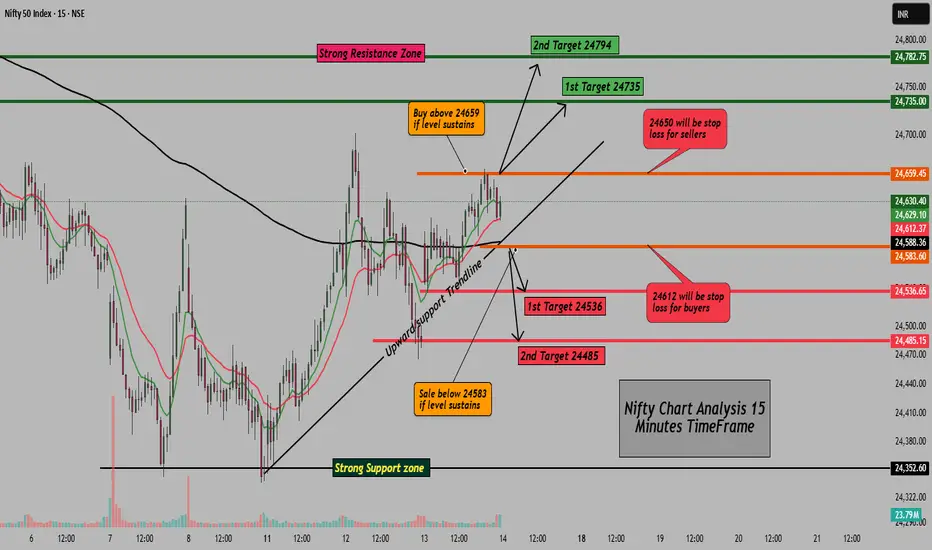
Yesterday, Nifty maintained a bullish tone throughout the session, respecting the upward support trendline and closing near the higher levels. Price action stayed above key psychological support zones, hinting at buying interest on dips. Resistance near the 24,660 area acted as a hurdle, and today’s session will decide whether bulls can take control for higher targets or sellers will step in at resistance.
Important Levels for Nifty (15-Minutes Timeframe):
Intraday Support Zone: 24,583 – 24,536
Intraday Resistance Zone: 24,659 – 24,735
Buy Setup:
Buy above 24,659 if the level sustains for at least 15 minutes .
Targets: 24,735 / 24,794
Stop Loss: 24,612
Sell Setup:
Sell below 24,583 if the level sustains for at least 15 minutes .
Targets: 24,536 / 24,485
Stop Loss: 24,650
Trend Bias: Neutral-to-bullish above 200 EMA; bearish bias if price sustains below it .
Note: Levels are for reference. When a trade setup forms, I will update it in the live market, stay tuned .
Disclaimer: This analysis is for educational purposes only. Please do your own research or consult a financial advisor before trading .
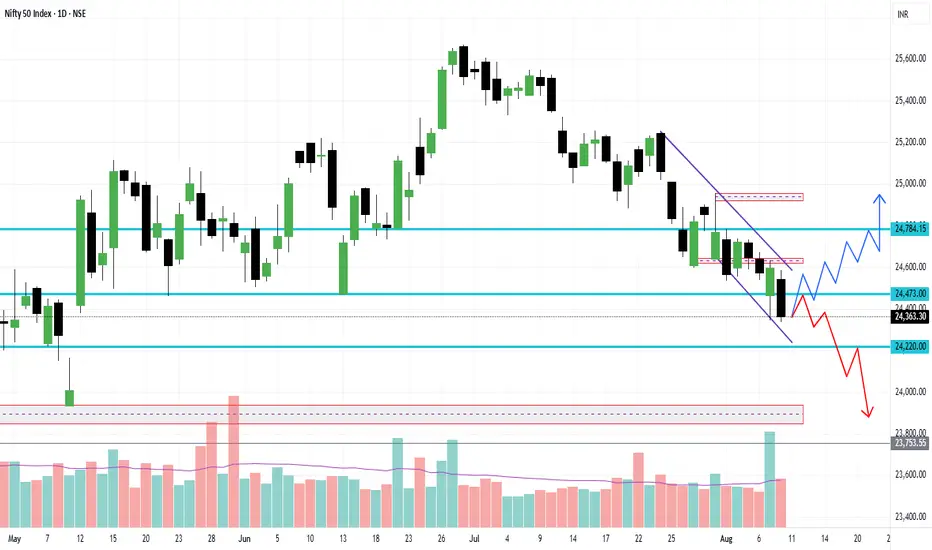
Nifty Levels and Ideas for the Next Week (11th Aug - 14 Aug )Although there was a huge sell off seen on 8th August Friday, But a recovery can be witnessed in Nifty - that too in the case if it strongly surpasses the Resistance levels which have turned stronger now - the 24480 - 24560 - 24640 levels are stacked on above the other - breaking these levels in continuation may not be possible in the current ongoing downtrend market. But nothing is impossible. In contrary some more fall can't be denied - yes but before that an upward retracement can be seen and there might be some Sell on Rise scenarios may occur, which then can take the Nifty towards 2429 and then 24200 levels too. 24150-24200 may act as a good and strong support area.
Let's see how this analysis plays out for the market in upcoming week.
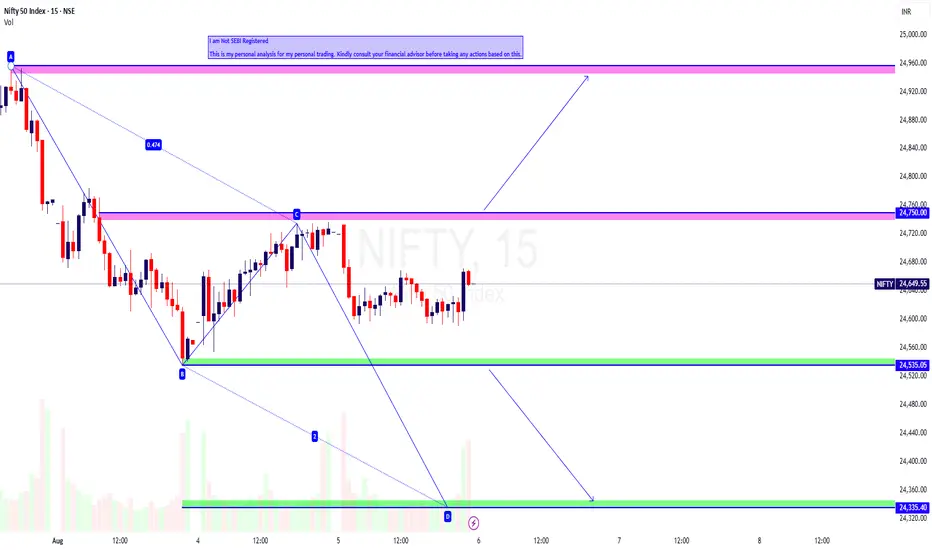
NIFTY Intraday Trade Setup 06 Aug 2025NIFTY Intraday Trade Setup 06 Aug 2025
Buy-Above 24750
Invalid-Below 24700
T- 24950
Bearish- Below 24530
Invalid-Above 24580
T- 24335
NIFTY has closed on a bearish note with 0.3% cut today. It has made 2 consecutive inside candles in daily TF. 24500 zone will be a confluence zone, due to multiple supports taken earlier. Below 24400 index can escalate, and index may start an impulsive move. On flat opening above 24750 index may give a reversal move towards 25k. Below 24530 index will be simple short towards 24335 zone as per ABCD pattern. Plan on 15 Min candle closing.
In case of a big gap up/down, wait till 10 o'clock and mark the high and low of the trading range (5MIN). Trade on this range breakout.
==========
I am Not SEBI Registered
This is my personal analysis for my personal trading. Kindly consult your financial advisor before taking any actions based on this.
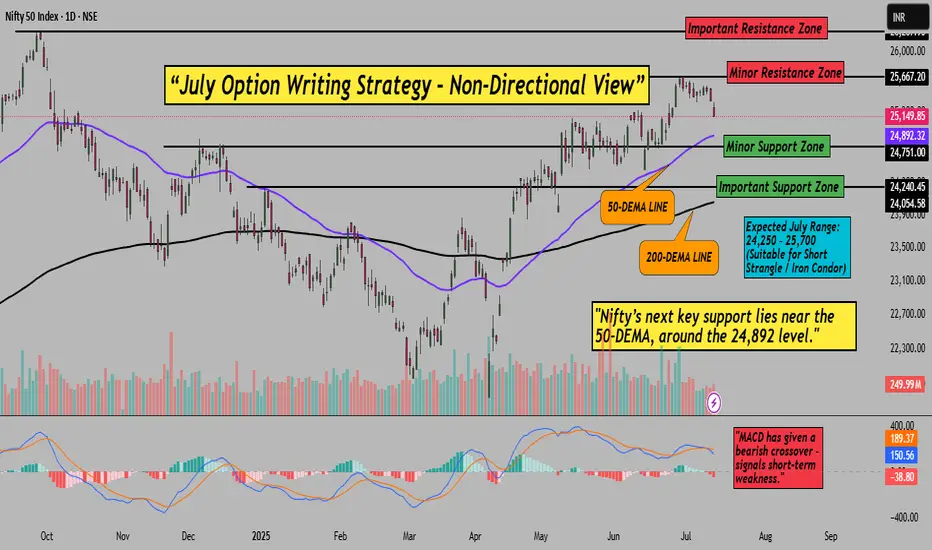
Nifty July Iron Condor Strategy – Premiums are Still Attractive!Hello Traders!
After a strong April, May and June where all three our option writing strategies gave full profits, we are back again with the July edition. Market is respecting the range beautifully, and we are again going with a non-directional Iron Condor setup.
Let’s walk through the logic and setup, based on the recent chart and market behaviour.
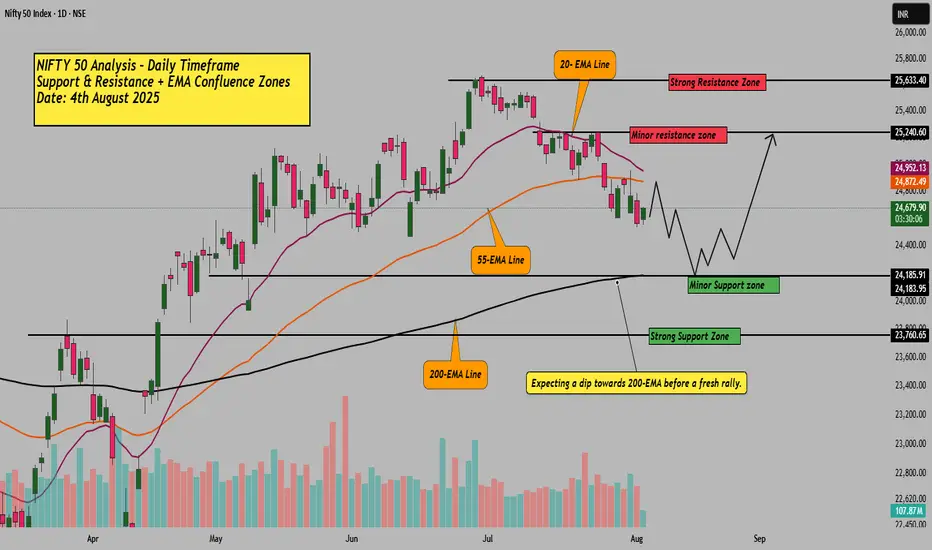
Why This Strategy Now? (Based on Chart Analysis)
Resistance Zone: 25,667–26,267 (two-layer zone, minor and major resistance)
Support Zone: 24,240–24,892 (50-DEMA tested, strong support)
Nifty is hovering inside the range – no clear trend, perfect for sideways strategy
MACD has given bearish crossover – adds pressure on upside
Strategy Setup (Iron Condor – 31st July Monthly Expiry)
Sell 24900 PE (2 lots)
Buy 24500 PE (2 lots)
Sell 25500 CE (2 lots)
Buy 25800 CE (2 lots)
Payoff Graph for Strategy:
Why This Works (Logic + Technical View)
Strategy revolves around the 24,750–25,650 zone where Nifty is stuck
Support well aligned to 50-DEMA at 24,892 and 24,240 (intermediate support)
Volatility is neutral, data is range-bound – ideal environment for iron condor writers
No major events or newsflow – market likely to stay inside band
Risk Management & Exit Points
Exit if Nifty gives a clean breakout above 25,700 or breakdown below 24,250
If strategy gives 40–50% max profit early, consider booking
Always keep an eye on VIX and OI buildup for major trend shifts
Rahul's Tip
This strategy has worked beautifully for last 3 months. If you’ve been with me, you know how well Iron Condors can work when market ranges. So we ride the same logic again, until the breakout comes.
Once again – this is a low risk, range-bound iron condor setup with good risk-to-reward.
Have you ever tried a short iron condor on NIFTY? What was your experience? Drop your thoughts below!
If you liked this post, don’t forget to LIKE and FOLLOW!
Regular updates coming with chart tracking, P&L changes and smart exits.
Disclaimer: This analysis is for educational purposes only. Please consult a financial advisor before making investment decisions.
Nifty AnalysisNifty formed Bullish engulfing candle and moved above key EMAs.
Call may be entered after retracement of 61.8% of recent swing.
Stoploss just below 38.2%.
Target till 25th July Gap down.
This gives 1:3 risk reward ratio.
Timeframe 1-5 days.

NIFTY Intraday Trade Setup For 30 Jul 2025NIFTY Intraday Trade Setup For 30 Jul 2025
Bullish-Above 24900
Invalid-Below 24850
T- 25100
Bearish-Below 24590
Invalid-Above 24640
T- 24290
NIFTY has closed on a positive note today. This does not mean that the short term trend has changed. Bullish sentiment confirmation will be when index closes above 50 EMA in daily TF and closes above PDH in daily TF. Tomorrow a bullish move can be expected above 24900 on a 15 Min candle close towards gap filling area. In case index closes below 24590 in 15 Min TF then index will head towards 24290.
In case of a big gap up/down, wait till 10 o'clock and mark the high and low of the trading range (5MIN). Trade on this range breakout.
==========
I am Not SEBI Registered
This is my personal analysis for my personal trading. Kindly consult your financial advisor before taking any actions based on this.

NIFTY Intraday Trade Setup For 28 Jul 2025NIFTY Intraday Trade Setup For 28 Jul 2025
Sell_1- From 24990
Invalid-Above 25040
T- 24800
Bearish-Below 24800
Invalid-Above 24850
T- 24620
NIFTY has closed on a bearish note, ended near lowest point of the week. Index has closed below 50 and 21 EMA both. Its sell on rise market till it is below 50 EMA. Support lies near 24150, 24450 will be a confluence zone in between. Following the sell on rise approach, On Monday 25k zone will be a resistance area to plan a short. On flat opening, below 24800 will be a simple short planning towards 24600 zone.
In case of a big gap up/down, wait till 10 o'clock and mark the high and low of the trading range (5MIN). Trade on this range breakout.
==========
I am Not SEBI Registered
This is my personal analysis for my personal trading. Kindly consult your financial advisor before taking any actions based on this.

Nifty Starts July Quietly; Sideways Action May ContinueNifty began the month on a subdued note, registering a net weekly loss of 176.80 points (-0.69%). Market volatility also eased, with the India VIX declining by 0.59% to 12.31, indicating reduced trader anxiety.
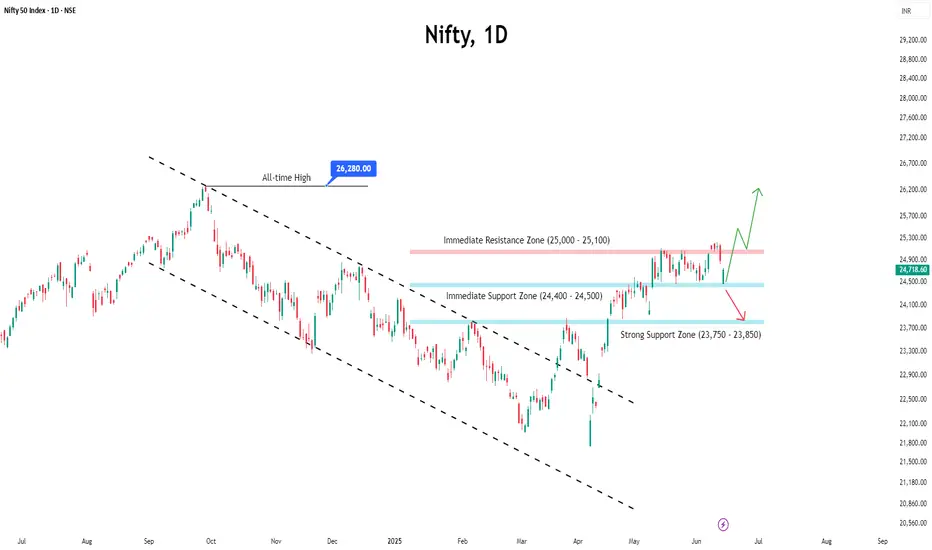
From a technical standpoint, an immediate resistance zone has developed between 25,500 and 25,650, while a key support range lies between 25,200 and 25,300.
Open Interest (OI) data adds weight to these levels, with a significant build-up of call writing at 25,500 suggesting strong resistance, and put writing at 25,200 indicating solid support.
Looking ahead, Nifty is expected to remain range-bound between these two zones unless a decisive breakout or breakdown occurs.

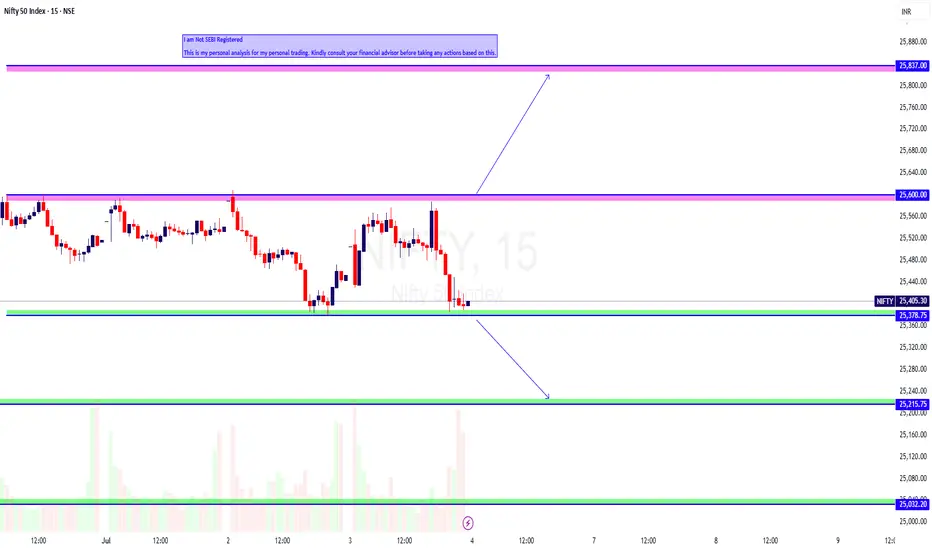
NIFTY Intraday Trade Setup For 4 Jul 2025NIFTY Intraday Trade Setup For 4 Jul 2025
Bullish-Above 25600
Invalid-Below 25550
T- 25837
Bearish-Below 25370
Invalid-Above 25420
T- 25215
NIFTY has closed on a slight bearish note with 0.19% cut today. Index has turned sell on rise since it has closed below PDL on 30 Jun. Buy on dip approach sentiment will be activated again if it closes above PDH in daily TF. Coming to Friday's trade setup, if index opens flat and a 15 Min candle closes above 25600 then will long , level has been tested multiple times in intraday. Short below 25370. A good flow below the same can be expected on flat opening.
In case of a big gap up/down, wait till 10 o'clock and mark the high and low of the trading range (5MIN). Trade on this range breakout.
==========
I am Not SEBI Registered
This is my personal analysis for my personal trading. Kindly consult your financial advisor before taking any actions based on this.
NIFTY Intraday Trade Setup For 30 Jun 2025NIFTY Intraday Trade Setup For 30 Jun 2025
Bullish-Above 25685
Invalid-Below 25635
T- 25885
Bearish-Below 25520
Invalid- Above 25570
T- 25340
NIFTY has closed on a bullish note last week. It gave a range breakout which was valid for more than a month. It is at a striking distance to ATH which may be taken out in the coming weeks. 25500 is a strong intraday support zone. We have planned a sell below the same (25520), but consider only in the second attempt. In case of a pullback breakout above 25685 we will long for the target of 25685. 25685-25930 will be a resistance zone in intraday.
In case of a big gap up/down, wait till 10 o'clock and mark the high and low of the trading range (5MIN). Trade on this range breakout.
==========
I am Not SEBI Registered
This is my personal analysis for my personal trading. Kindly consult your financial advisor before taking any actions based on this.

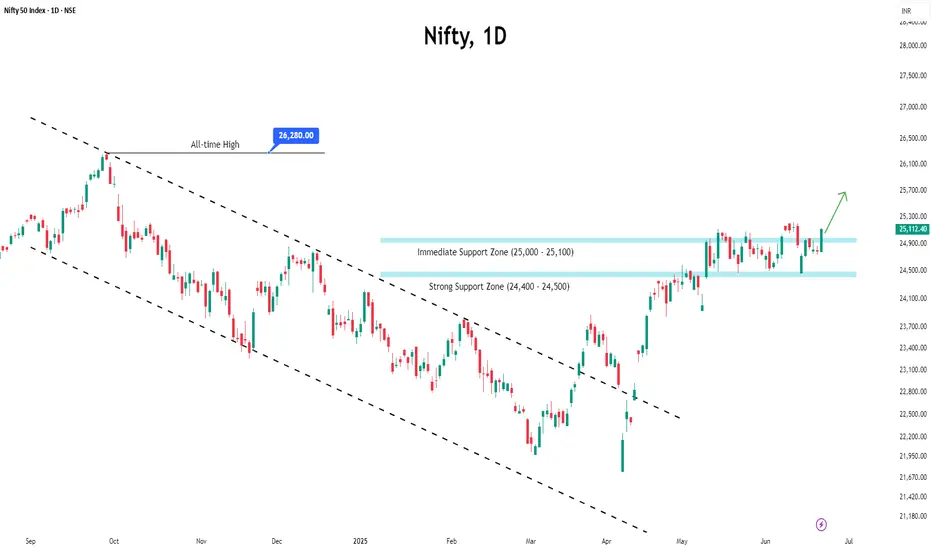
Nifty Continued to Rise, Bank Nifty Stands Tall at New Highs◉ Nifty Analysis NSE:NIFTY
Indian equity markets broke out of a five-week consolidation last week, powered by easing geopolitical tensions, which helped boost investor sentiment.
A Pole & Flag breakout on the charts signals a continuation of the uptrend, with strong bullish momentum building up.
Open Interest (OI) Snapshot
● 25,000 – Strong Base: Heavy put writing indicates strong support; bulls defending this level aggressively.
● 25,500 – Immediate Support: A secondary cushion with notable put buildup—short-term buyers watching this zone.
● 26,000 – Immediate Resistance Zone: Call writers active here; a breakout above this level could trigger a fresh leg up.
Outlook: The index looks set to maintain a bullish tone, with a possible move toward 26,000 in the coming sessions.
◉ Bank Nifty Analysis NSE:BANKNIFTY
The banking sector continues to lead the market’s strength, acting as a major driver behind the recent rally.
Fundamentally, optimism is being driven by lower funding costs, supported by banks cutting fixed deposit rates and the RBI’s recent cut in the Cash Reserve Ratio (CRR)—both of which have boosted liquidity and improved the outlook for lenders.
The index has confirmed a breakout from a Pole & Flag formation, aligning with Nifty’s bullish setup and further validating strength in the banking space.
Open Interest (OI) Snapshot
● 56,000 – Strong Support Zone: Significant put writing shows strong bullish conviction around this level.
● 57,000 – Immediate Support: Fresh positions being built; dip-buyers may step in here.
● 58,000 – Key Resistance Ahead: Call writers are holding the line—watch for breakout signals.
Outlook: As long as Bank Nifty holds above 57,000, the bullish momentum is expected to continue, with possible testing of 58,000 in the near term.

Nifty Eyes Upside as Bulls Take Charge Ahead of Expiry WeekThe Nifty closed around 25,112 on Friday, marking a 1.29% gain for the week and signalling strong bullish momentum. The rally was driven by broad-based buying, particularly in financial heavyweights like HDFC Bank, ICICI Bank, and Reliance Industries.
Despite lingering global uncertainties, market sentiment remained stable, with the India VIX closing at 13.67—reflecting subdued volatility and cautious optimism among participants.
In the derivatives space, the highest concentration of put writing at the 25,000 strike highlights strong immediate support, while the 25,500 level is emerging as a key resistance zone due to significant call writing activity.
Heading into the upcoming expiry week, the bullish trend is likely to continue, provided no major geopolitical shocks disrupt market sentiment.
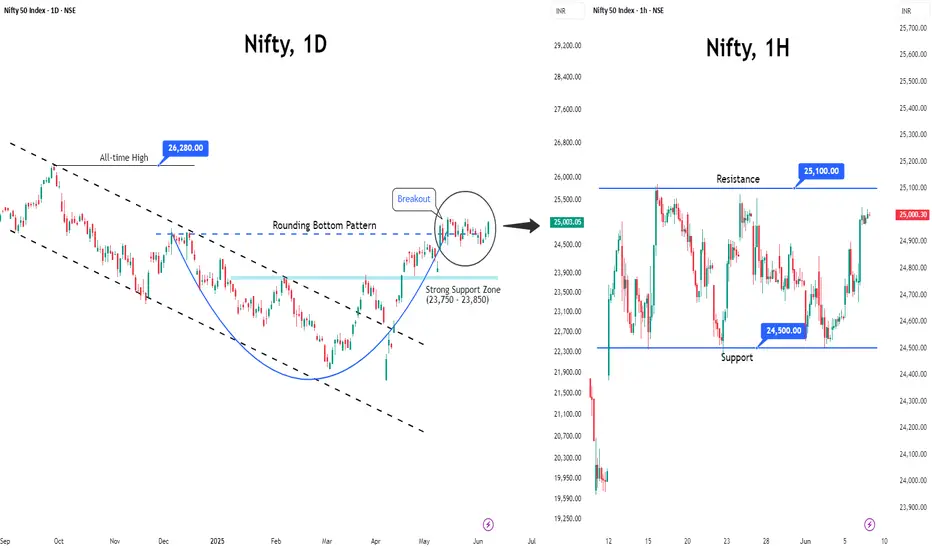
Nifty Weekly Outlook: Volatility Ahead Amid Global Tensions● Despite briefly breaking above the 25,100 resistance last week, Nifty failed to sustain the momentum and witnessed a corrective pullback towards the 24,500 level.
● Market volatility ticked up, with India VIX rising by 3.08% to 15.08 on a weekly basis, reflecting growing investor nervousness.
● Geopolitical tensions—particularly the escalating conflict between Israel and Iran—are weighing on global sentiment, and Indian equities are not immune to this uncertainty. However, relative strength in the Indian markets suggests that they may continue to outperform global peers in the near term.
● For the upcoming week, Nifty is expected to remain highly volatile, with wide-range oscillations likely. A directional trend may only emerge if Nifty decisively breaches 25,100 on the upside or breaks below the key support at 24,500.
● Options data indicates that the 25,000 level will act as a strong resistance, while 24,500 remains a crucial support zone.
● Importantly, if the index opens below 24,400 at the start of the week, it could invite further selling pressure, tipping the balance in favor of the bears.
● Given the global headwinds and sensitive technical setup, traders are advised to stay cautious as heightened volatility could dominate the week ahead.
Bulls on Standby: Can Nifty Unleash Its Next Leg Higher?As anticipated, Nifty consolidated within a 600-point range between 24,500 and 25,100 last week, ending with a modest weekly gain of around 1%.
Volatility eased as well, with India VIX declining by 9% to close at 14.63, reflecting improved market stability.
Open Interest (OI) data indicates immediate support at 24,800, backed by the highest concentration of put writing.
Looking ahead, there is a strong possibility that Nifty may breach the 25,100 resistance level in the coming sessions, which could trigger a swift rally toward the 25,500 mark.
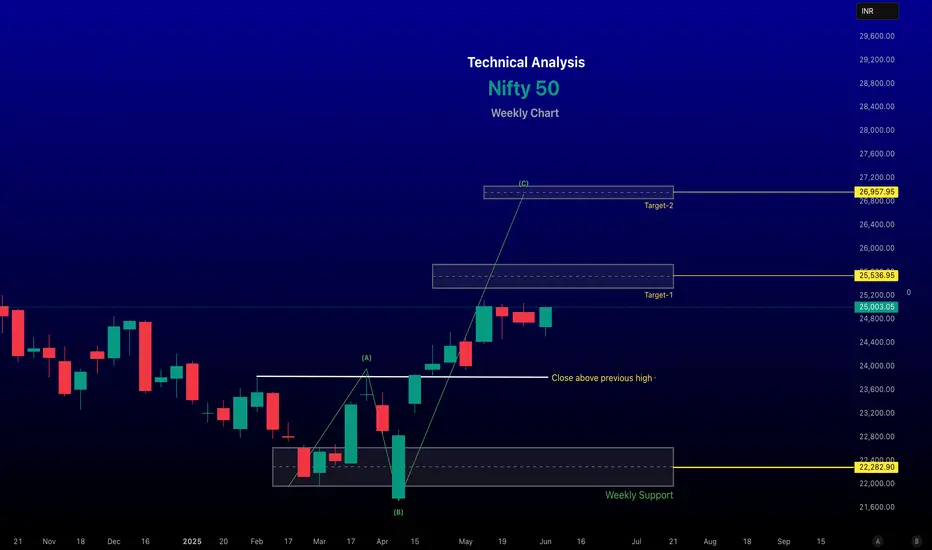
Nifty 50 Weekly Technical Analysis for June 09–13, 2025~~ Technical Analysis ~~
Short-Term (Daily/Weekly):
The Nifty 50 is currently trading within an ascending channel on the daily/weekly chart, indicating a bullish structure. However, it faces resistance in the 25,050–25,070 range. A breakout above this could target 25,300–25,600, while a drop below 24,700 may signal short-term weakness.
Recent suggest the index is testing key support levels, with the 200-day Exponential Moving Average (EMA) and a major trend line around 23,300–23,600 acting as critical support. A break below this could indicate a bearish shift.
The Relative Strength Index (RSI) on the daily chart has previously hit oversold levels (below 30) in March 2025, suggesting potential for a bounce if similar conditions reoccur.
-- Disclaimer --
This analysis is based on recent technical data and market sentiment from web sources. It is for informational and educational purposes only and not financial advice. Trading involves high risks, and past performance does not guarantee future results. Always conduct your own research or consult a SEBI-registered advisor before trading.
#Boost and comment will be highly appreciated
Nifty Outlook: Sideways Action Likely as June OpensAs anticipated last week, Nifty traded sideways, showing limited movement.
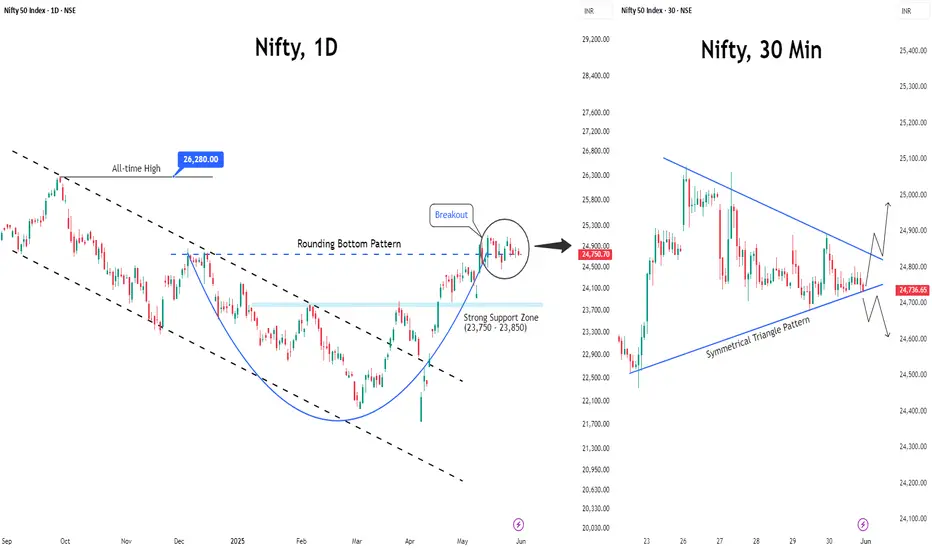
The current technical setup indicates the index may continue to remain range-bound in the upcoming week.
On the 30-minute chart, a symmetrical triangle pattern has formed, suggesting that a breakout in either direction could lead to a swift, short-term move.
Key Levels to Watch
Support: 24,500
Resistance: 25,100 – 25,150
A decisive breakout above 25,100, confirmed by two consecutive closes, could pave the way for a rally toward the 25,500 mark.
Meanwhile, Foreign Institutional Investors (FIIs) have cut their long positions to nearly half of April–May levels, reflecting a more cautious stance. Still, their net buying in the previous months, along with upcoming catalysts like the RBI policy announcement on June 6 and the progress of the monsoon, could potentially reignite market momentum.
Nifty Intraday Level for 27-May-25Nifty closed at resistance level and formed Double Top Reversal Pattern may seen downside if resistance not broken else above resistance seen upsideknifty
Bearish < 24950
Bullish > 25125
Wait for Proper Rejection/Pattern :
@Support : Bullish
@Resistance : Bearish
Use Sl Trailing to reduce Risk
*All views for educational purpose only
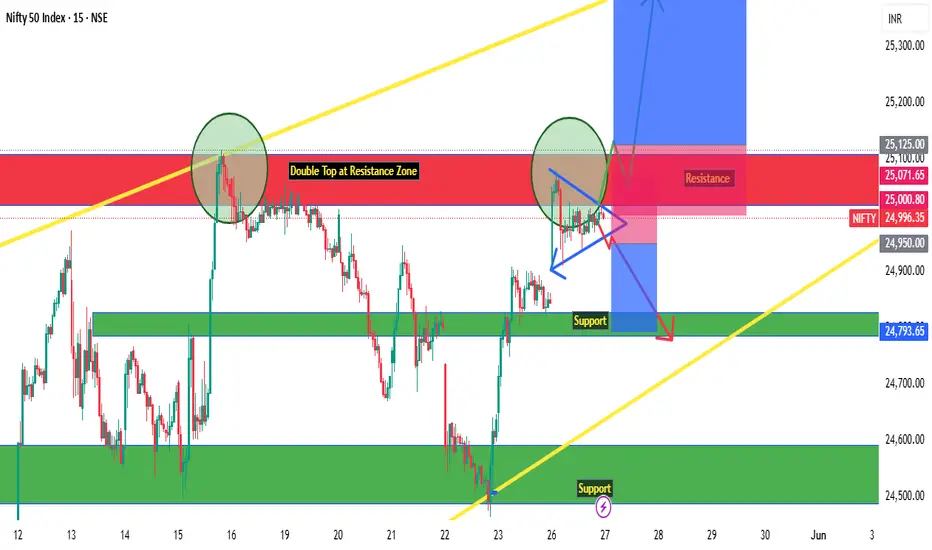
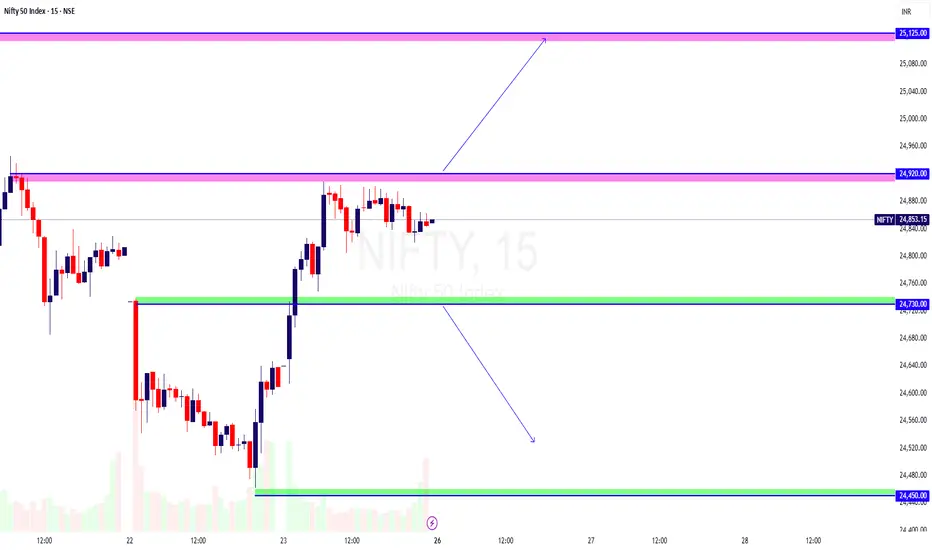
NIFTY Intraday Trade Setup For 26 May 2025Key Levels are 24920 and 24730. For directional trade one should wait for this range to break either side. Hourly resistance lies near 25125, breakout of which will take NIFTY towards 25550.
I am Not SEBI Registered
This is my personal analysis for my personal trading. Kindly consult your financial advisor before taking any actions based on this.
Nifty to Stay in Pause Mode Ahead of Expiry WeekAfter a strong run, the Nifty rally seems to be losing steam and has now slipped into consolidation mode. With the monthly derivatives expiry coming up next week, the market is likely to remain range-bound.
Options data suggests that Nifty has carved out a trading range between 24,500 and 25,100. Until we see a decisive move beyond either end of this 600-point band, don’t expect a strong directional trend.
A clear breakout above 25,100 could reignite bullish momentum, while a breach below 24,500 might invite fresh selling pressure. Until then, it’s all about sideways action and expiry-driven volatility.
