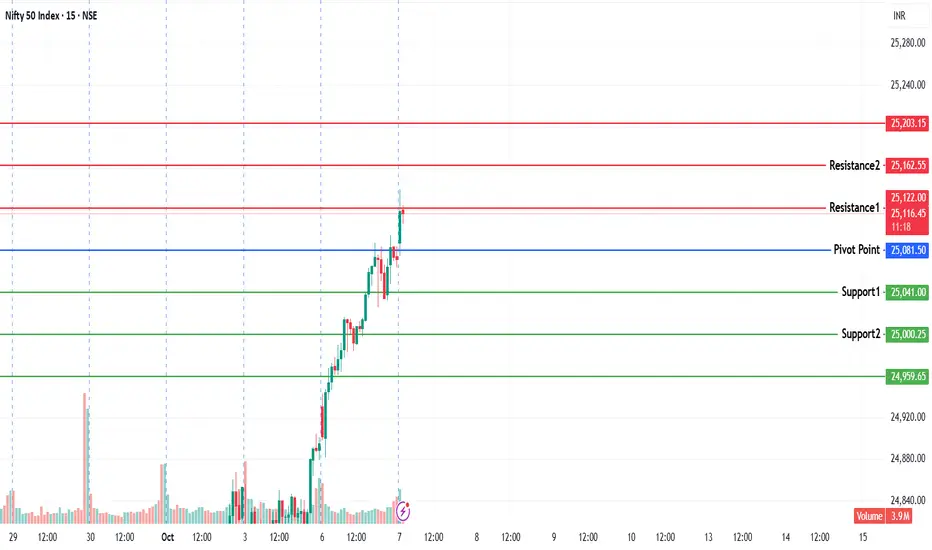
NIFTY KEY LEVELS FOR 07.10.2025 NIFTY KEY LEVELS FOR 07.10.2025
RTF: 3 Minutes
If the candle stays above the pivot point, it is considered a bullish bias; if it remains below, it indicates a bearish bias. Price may reverse near Resistance 1 or Support 1. If it moves further, the next potential reversal zone is near Resistance 2 or Support 2. If these levels are also broken, we can expect the trend.
When a support or resistance level is broken, it often reverses its role; a broken resistance becomes the new support, and a broken support becomes the new resistance.
If the range(R2-S2) is narrow, the market may become volatile or trend strongly. If the range is wide, the market is more likely to remain sideways
please like and share my idea if you find it helpful
📢 Disclaimer
I am not a SEBI-registered financial adviser.
The information, views, and ideas shared here are purely for educational and informational purposes only. They are not intended as investment advice or a recommendation to buy, sell, or hold any financial instruments.
Please consult with your SEBI-registered financial advisor before making any trading or investment decisions.
Trading and investing in the stock market involves risk, and you should do your own research and analysis. You are solely responsible for any decisions made based on this research.
Niftyoutlook
NIFTY : Trading levels and Plan for 07-Oct-2025NIFTY TRADING PLAN – 07-Oct-2025
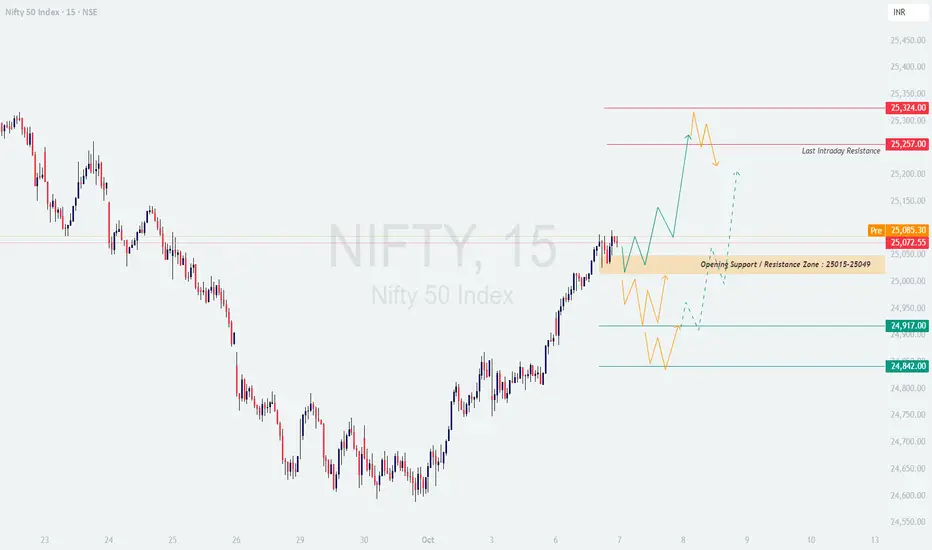
Nifty closed at 25,072, showing mild consolidation after a strong upside stretch over the past few sessions. The price is currently hovering near a short-term equilibrium band of 25,015 – 25,049, which will act as the first control zone for tomorrow’s intraday direction.
📊 Key Technical Levels:
Opening Support / Resistance Zone: 25,015 – 25,049
Last Intraday Resistance: 25,257
Major Resistance: 25,324
Last Intraday Support: 24,917
Major Support: 24,842
🚀 Scenario 1: Gap Up Opening (100+ points)
If Nifty opens above 25,150, the immediate upside target becomes the 25,257 resistance zone.
A strong breakout with volume above 25,257 can extend the rally toward 25,324 — this zone may act as a short-term supply region.
However, if early buying fades near 25,257–25,324, profit booking pressure could emerge, pulling prices back to the 25,050 zone.
Aggressive traders should wait for a 15-min candle close above 25,257 to confirm breakout strength before taking long positions.
📘 Educational Note: Gap-ups near resistance are often emotional reactions to overnight sentiment. Always validate breakouts with strong volume and sustained price action instead of chasing the open.
⚖️ Scenario 2: Flat Opening (within ±100 points)
A flat opening near 25,050 will keep Nifty inside the Opening Support/Resistance zone (25,015 – 25,049) .
Sustained trading above 25,049 will keep intraday momentum positive, with potential targets of 25,150 → 25,257.
On the downside, a breakdown below 25,015 may drag the index towards 24,917, where dip buyers could step in.
Let the first 30 minutes define direction — avoid premature trades during choppy early candles.
📘 Educational Note: Flat openings often test traders’ patience. The best trades come after early volatility settles and the breakout/breakdown direction becomes clear.
📉 Scenario 3: Gap Down Opening (100+ points)
If Nifty opens near 24,950 or below, it will test the Last Intraday Support at 24,917 .
A breakdown below 24,917 could extend weakness towards the 24,842 zone, which is a crucial support for bulls to defend.
If prices hold 24,842 and show a reversal candle pattern (like bullish engulfing or hammer), expect a rebound back toward 25,000+.
Avoid aggressive shorts below 24,842 without confirmation, as this level can trigger a sharp short-covering rally.
📘 Educational Note: Gap-downs often attract panic selling — but smart traders wait for support confirmation before taking fresh positions. Watch candle structure and volume behavior carefully.
🛡️ Risk Management Tips for Options Traders
⏱️ Avoid trading the first 15–30 minutes; allow volatility to stabilize.
🛑 Use hourly candle close as SL validation instead of reacting to intraday spikes.
💡 Near support/resistance zones, use Bull Call / Bear Put spreads instead of naked options to reduce theta risk.
💰 Maintain a 1:2 or higher Risk-Reward Ratio ; never enter trades without clear R:R visibility.
🔄 Trail profits once Nifty moves 40–60 points in your favor to lock gains.
🚫 Risk only 2%–3% of total capital per trade for consistent longevity.
📌 Summary & Conclusion
Bullish Bias: Above 25,257, targets 25,324 → 25,400.
Neutral Zone: Between 25,015 – 25,049, expect sideways consolidation until breakout.
Bearish Bias: Below 24,917, weakness may extend towards 24,842.
📈 Nifty remains in a short-term bullish structure, but traders should respect the overhead resistance near 25,257–25,324. The 25,015 zone acts as the short-term pivot for directional clarity. Disciplined entries, patience, and position sizing will be key to riding tomorrow’s move effectively.
⚠️ Disclaimer: This analysis is for educational purposes only. I am not a SEBI-registered analyst. Please conduct your own analysis or consult a financial advisor before making trading decisions.
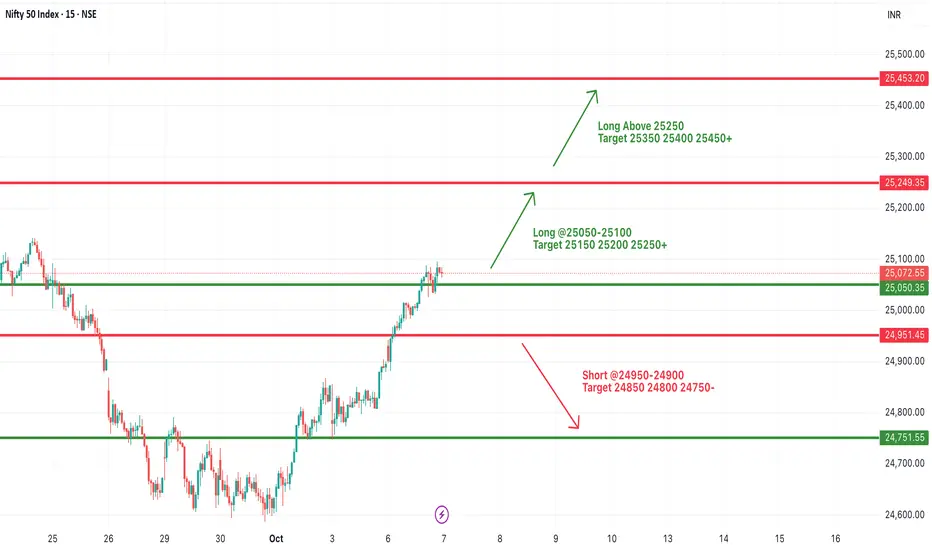
#NIFTY Intraday Support and Resistance Levels - 07/10/2025Nifty is likely to open with a gap-up around the 25,100 level, continuing its strong upward momentum from the previous sessions. The index has shown consistent higher lows, indicating strong buying interest and a positive undertone in the market.
If Nifty sustains above 25,050–25,100, it can extend the rally toward 25,150, 25,200, and 25,250+. A breakout above 25,250 will further strengthen the bullish trend, potentially leading to higher targets near 25,350–25,450+.
On the downside, immediate support is placed at 24,950–24,900. A breakdown below this zone may invite mild profit booking, taking the index lower toward 24,850 and 24,750-.
Overall, the sentiment remains bullish with a gap-up opening, and traders should look for buying opportunities on dips while maintaining a strict stop-loss below 24,900 for intraday setups.
NIFTY KEY LEVELS FOR 06.10.2025NIFTY KEY LEVELS FOR 06.10.2025
RTF: 3 Minutes
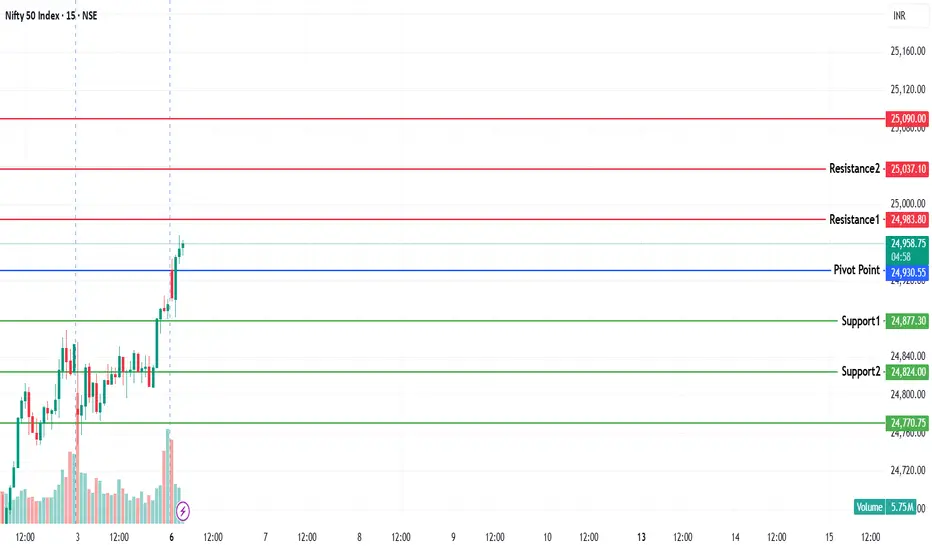
If the candle stays above the pivot point, it is considered a bullish bias; if it remains below, it indicates a bearish bias. Price may reverse near Resistance 1 or Support 1. If it moves further, the next potential reversal zone is near Resistance 2 or Support 2. If these levels are also broken, we can expect the trend.
When a support or resistance level is broken, it often reverses its role; a broken resistance becomes the new support, and a broken support becomes the new resistance.
If the range(R2-S2) is narrow, the market may become volatile or trend strongly. If the range is wide, the market is more likely to remain sideways
please like and share my idea if you find it helpful
📢 Disclaimer
I am not a SEBI-registered financial adviser.
The information, views, and ideas shared here are purely for educational and informational purposes only. They are not intended as investment advice or a recommendation to buy, sell, or hold any financial instruments.
Please consult with your SEBI-registered financial advisor before making any trading or investment decisions.
Trading and investing in the stock market involves risk, and you should do your own research and analysis. You are solely responsible for any decisions made based on this research.
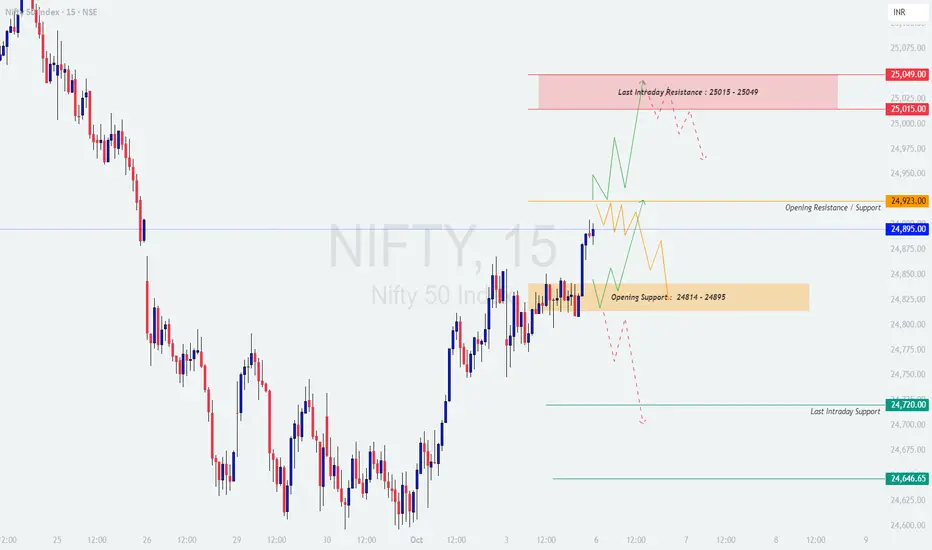
NIFTY : Trading levels and plan for 06-Oct-2025NIFTY TRADING PLAN – 06-Oct-2025
Nifty closed at 24,895, showing strong recovery momentum but still trading near crucial resistance and support levels. Tomorrow’s opening and follow-up price action will be key in determining short-term direction.
📌 Key Levels to Watch:
Opening Support Zone: 24,814 – 24,895
Opening Resistance / Support: 24,923
Last Intraday Resistance: 25,015 – 25,049
Last Intraday Support: 24,720 & 24,646
🚀 Scenario 1: Gap Up Opening (100+ points)
If Nifty opens above 25,000, it will be very close to Last Intraday Resistance (25,015 – 25,049) .
Sustained price action above 25,049 could trigger further momentum towards 25,100 – 25,150 levels.
However, if rejection occurs around resistance, expect profit booking back towards 24,950 – 24,923.
Traders should avoid chasing the gap-up and instead look for either a breakout confirmation or rejection signals to enter.
👉 Educational Note: Gap-ups near resistance zones often trap late buyers. Always wait for a retest before committing to a trade.
⚖️ Scenario 2: Flat Opening (within ±100 points)
A flat start near 24,850 – 24,900 will keep Nifty inside the Opening Support Zone (24,814 – 24,895) and just below 24,923 Resistance .
A breakout above 24,923 can fuel a rally towards 25,015 – 25,049, with further extension possible if momentum is strong.
On the downside, failure to hold above 24,814 may pull prices back to 24,720 or even 24,646.
Traders should adopt a wait-and-watch approach until the range between 24,814 – 24,923 is broken.
👉 Educational Note: Flat openings usually create range-bound trades early in the session. Focus on range breakouts to avoid getting chopped in sideways action.
📉 Scenario 3: Gap Down Opening (100+ points)
If Nifty opens near or below 24,750 – 24,720, the Last Intraday Support (24,720) will be tested immediately.
A breakdown below 24,720 could extend weakness towards 24,646 – 24,600.
However, if support holds at 24,720 – 24,646, a sharp short-covering rally back towards 24,850 – 24,900 is possible.
Patience will be key – wait for confirmation whether support sustains or breaks before taking positions.
👉 Educational Note: Gap-downs often trigger panic selling, but they can also present excellent reversal opportunities if support holds firmly.
🛡️ Risk Management Tips for Options Traders
⏳ Avoid taking aggressive positions in the first 15–30 minutes; let volatility settle.
🛑 Place stop losses based on 15-min or hourly candle closes , not just wicks.
🎯 Use option spreads (Bull Call, Bear Put) to manage premium decay.
📉 Always maintain at least a 1:2 Risk-Reward ratio .
💰 Book partial profits at key levels to protect capital.
🧘 Never risk more than 2–3% of capital on a single trade.
📌 Summary & Conclusion
Bullish Bias: Above 24,923, targets 25,015 → 25,049 → 25,100+.
Neutral Zone: Between 24,814 – 24,923, expect consolidation.
Bearish Bias: Below 24,720, weakness towards 24,646 – 24,600.
📊 Nifty is currently at a decision-making level. Breakout above resistance can extend bullish momentum, while breakdown below support may invite selling pressure. The best approach is to stay patient, follow confirmation signals, and manage risk with discipline.
⚠️ Disclaimer: This analysis is purely for educational purposes. I am not a SEBI-registered analyst. Please do your own research or consult with a financial advisor before making trading decisions.
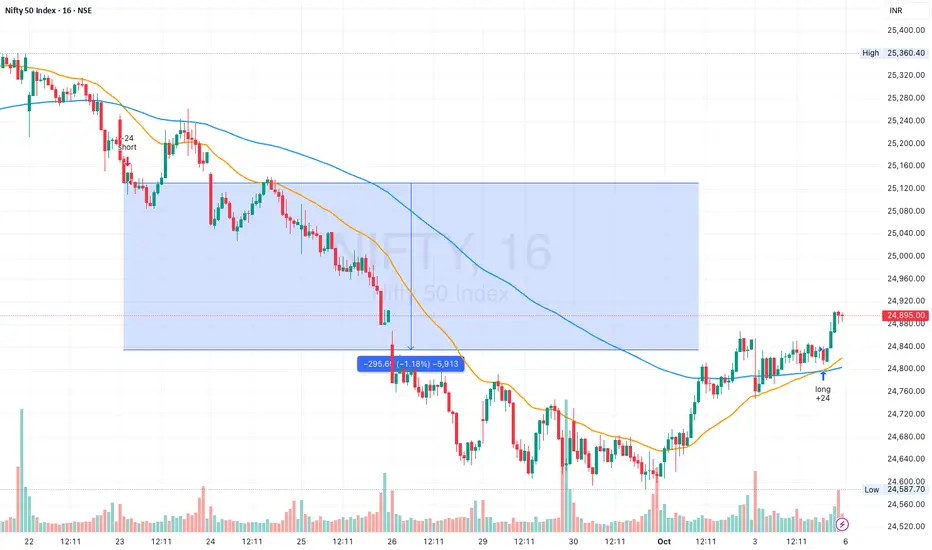
03 Oct 205 - Nifty is now Long, hope we get a new swing highNifty Stance Bullish 🐂
The last EMA crossover signal occurred on 23rd September, at which point we had gone short on the Nifty. The long signal was triggered today, on October 3rd, at 13:47, resulting in a profit of 295 points.
I did not think that we would get a long signal that soon, hoping that we could fall a bit more, especially to the 24400 levels, but the markets had other plans.
From here, Nifty needs to break the resistances at 24931 and 25003 to reach the 25219 levels, which also means it will surpass the last short signal in the 25132 zone. The recent swing high of 25448, if broken, could lead to a superb short-covering rally that could even help us take out the ATH, but let us hope that we go there as slowly as possible so that we don't fall back sharply as we did in the last 10 sessions.
Valuations are improving for select stocks, and this also means it's a favorable buying opportunity. Let us also not forget that FIIs will only invest in Indian stocks if the comparable value improves relative to global peers.
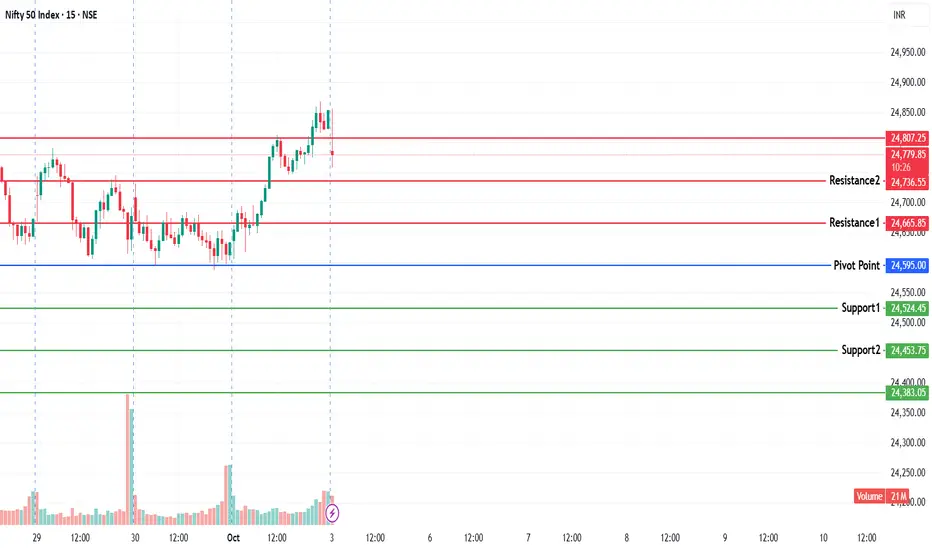
NIFTY KEY LEVELS FOR 03.10.2025NIFTY KEY LEVELS FOR 03.10.2025
RTF: 3 Minutes
If the candle stays above the pivot point, it is considered a bullish bias; if it remains below, it indicates a bearish bias. Price may reverse near Resistance 1 or Support 1. If it moves further, the next potential reversal zone is near Resistance 2 or Support 2. If these levels are also broken, we can expect the trend.
When a support or resistance level is broken, it often reverses its role; a broken resistance becomes the new support, and a broken support becomes the new resistance.
If the range(R2-S2) is narrow, the market may become volatile or trend strongly. If the range is wide, the market is more likely to remain sideways
please like and share my idea if you find it helpful
📢 Disclaimer
I am not a SEBI-registered financial adviser.
The information, views, and ideas shared here are purely for educational and informational purposes only. They are not intended as investment advice or a recommendation to buy, sell, or hold any financial instruments.
Please consult with your SEBI-registered financial advisor before making any trading or investment decisions.
Trading and investing in the stock market involves risk, and you should do your own research and analysis. You are solely responsible for any decisions made based on this research.
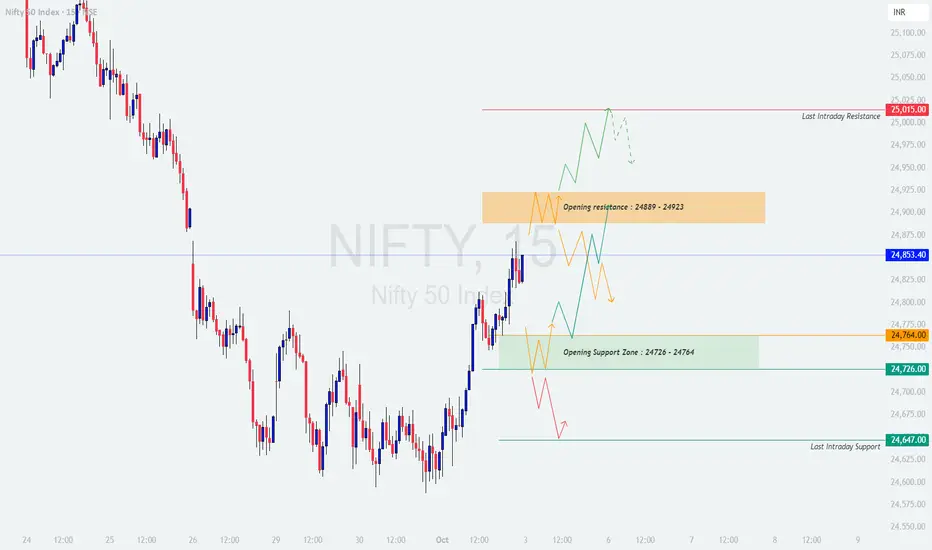
NIFTY : Trading levels and plan for 03-Oct-2025NIFTY TRADING PLAN – 03-Oct-2025
Nifty closed at 24,853.40, recovering from recent declines and now trading near crucial resistance and support zones. Tomorrow’s movement will largely depend on whether the index can break above 24,889 – 24,923 (Opening Resistance Zone) or hold below 24,726 – 24,764 (Opening Support Zone).
📌 Key Levels to Watch:
Opening Resistance Zone: 24,889 – 24,923
Last Intraday Resistance: 25,015
Opening Support Zone: 24,726 – 24,764
Last Intraday Support: 24,647
🚀 Scenario 1: Gap Up Opening (100+ points)
If Nifty opens near or above 24,950 – 25,000, it will directly challenge the Last Intraday Resistance (25,015) .
A sustained move above 25,015 could extend momentum towards 25,100+ levels, signaling strength.
However, if prices face rejection near 25,015, expect profit booking with pullback towards 24,900 – 24,850.
Traders should avoid chasing at higher openings and instead wait for confirmation of sustained breakout before entering fresh longs.
👉 Educational Note: Gap-up openings near resistance zones often trap impatient buyers. It is safer to wait for retests before committing capital.
⚖️ Scenario 2: Flat Opening (within ±100 points)
A flat start near 24,800 – 24,850 will keep Nifty between its Opening Resistance Zone (24,889 – 24,923) and Opening Support Zone (24,726 – 24,764) .
A decisive breakout above 24,923 may fuel momentum towards 25,015, with scope for extension to 25,100.
On the other hand, a breakdown below 24,726 could drag the index back to 24,647.
Expect sideways choppiness unless one side breaks decisively with volume confirmation.
👉 Educational Note: Flat openings indicate market indecision. Traders should focus on range breakout opportunities rather than anticipating moves.
📉 Scenario 3: Gap Down Opening (100+ points)
If Nifty opens near 24,700 – 24,650, it will test the Opening Support Zone (24,726 – 24,764) and may even challenge the Last Intraday Support (24,647) .
Breakdown below 24,647 could invite further weakness towards 24,550 – 24,500.
However, if the support zone holds, a rebound towards 24,800 – 24,850 is possible, triggering short covering.
Traders should wait for the first 15–30 mins to confirm whether supports sustain before taking trades.
👉 Educational Note: Gap-downs create panic. Disciplined traders wait for either breakdown confirmation or a sharp recovery signal to trade with better risk-reward.
🛡️ Risk Management Tips for Options Traders
⏳ Avoid trading aggressively in the first 15–30 minutes after opening.
🛑 Always keep stop losses based on 15-min/hourly candle close.
🎯 Use option spreads (Bull Call / Bear Put) to minimize premium decay risk.
📉 Maintain a minimum 1:2 Risk-Reward ratio on every trade.
💰 Book partial profits at key levels to protect gains.
🧘 Never risk more than 2–3% of total capital on a single trade.
📌 Summary & Conclusion
Bullish Bias: Above 24,923, targets 25,015 → 25,100.
Neutral Zone: Between 24,726 – 24,923, expect sideways consolidation.
Bearish Bias: Below 24,647, weakness towards 24,550 – 24,500 possible.
📊 Nifty is at a crucial juncture. Breakout above resistance can fuel bullish momentum, while breakdown below support may trigger renewed selling pressure. Traders should remain patient, disciplined, and trade only on confirmation of breakout/breakdown with volume.
⚠️ Disclaimer: This analysis is for educational purposes only. I am not a SEBI-registered analyst. Please do your own research or consult with a financial advisor before making trading decisions.
Nifty 50: Genuine Rally or Selloff Setup?The Nifty 50 Index went up, but this upward move was likely just a temporary correction, not the start of a new, long-term rise.
Bottom (Wave W): The index first hit a low around 24,377
Bounce (Wave X): It then went up to a high near 25,448 . This rise was a clear, three-part corrective move (like an ABC pattern) that stayed inside a rising channel .
Clue: Because the move from the bottom (W) to the peak (X) was corrective, it suggests the overall trend is still bearish (downward).
Points to look at:
1. Reversal: The index is currently around 24,836 and is starting to turn down from the top of that rising channel. This suggests the temporary rise is over.
2. Projected Drop (Wave Y): The main prediction is a significant drop (Wave Y) that will likely break the previous low of 24,377 .
3. Target: This decline is expected to head toward the lower blue trendline on the chart, completing a larger WXY corrective pattern.
4. Projection: Ending point of wave (Y) can act as the ride for the new impulse cycle.
5. Bearish Stance: Traders should be cautiously bearish (expecting the price to fall).
6. Price action perspective: Previous swing is bearish, better to look at short positions for safe entry.
7. Selling Opportunities: Any small upward movements (retracements) are seen as good selling opportunities (betting on the price going down), as long as the price doesn't break above the recent highs or the channel ceiling.24,300 is indeed a strong demand zone.
Stay tuned!
Money Dictators :)

NIFTY KEY LEVELS FOR 01.10.2025NIFTY KEY LEVELS FOR 01.10.2025
RTF: 3 Minutes
If the candle stays above the pivot point, it is considered a bullish bias; if it remains below, it indicates a bearish bias. Price may reverse near Resistance 1 or Support 1. If it moves further, the next potential reversal zone is near Resistance 2 or Support 2. If these levels are also broken, we can expect the trend.
When a support or resistance level is broken, it often reverses its role; a broken resistance becomes the new support, and a broken support becomes the new resistance.
If the range(R2-S2) is narrow, the market may become volatile or trend strongly. If the range is wide, the market is more likely to remain sideways
please like and share my idea if you find it helpful
📢 Disclaimer
I am not a SEBI-registered financial adviser.
The information, views, and ideas shared here are purely for educational and informational purposes only. They are not intended as investment advice or a recommendation to buy, sell, or hold any financial instruments.
Please consult with your SEBI-registered financial advisor before making any trading or investment decisions.
Trading and investing in the stock market involves risk, and you should do your own research and analysis. You are solely responsible for any decisions made based on this research.
NIFTY KEY LEVELS FOR 30.09.2025NIFTY KEY LEVELS FOR 30.09.2025
RTF: 3 Minutes
If the candle stays above the pivot point, it is considered a bullish bias; if it remains below, it indicates a bearish bias. Price may reverse near Resistance 1 or Support 1. If it moves further, the next potential reversal zone is near Resistance 2 or Support 2. If these levels are also broken, we can expect the trend.
When a support or resistance level is broken, it often reverses its role; a broken resistance becomes the new support, and a broken support becomes the new resistance.
If the range(R2-S2) is narrow, the market may become volatile or trend strongly. If the range is wide, the market is more likely to remain sideways
please like and share my idea if you find it helpful
📢 Disclaimer
I am not a SEBI-registered financial adviser.
The information, views, and ideas shared here are purely for educational and informational purposes only. They are not intended as investment advice or a recommendation to buy, sell, or hold any financial instruments.
Please consult with your SEBI-registered financial advisor before making any trading or investment decisions.
Trading and investing in the stock market involves risk, and you should do your own research and analysis. You are solely responsible for any decisions made based on this research.
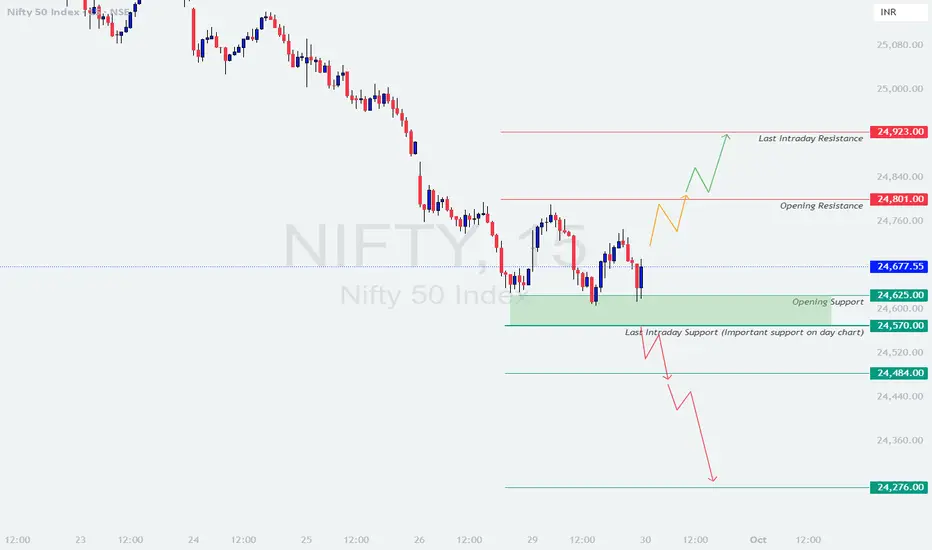
NIFTY : Trading levels and Plan for 30-09-2025NIFTY TRADING PLAN – 30-Sep-2025
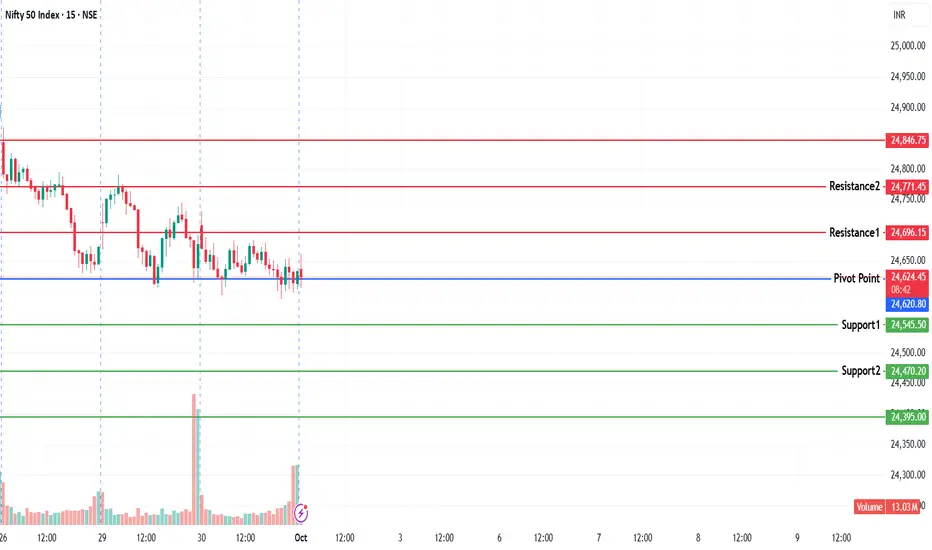
Nifty closed at 24,677.55, recovering slightly after testing crucial supports. For tomorrow’s session, the index is positioned between 24,801 (Opening Resistance) and 24,570 (Last Intraday Support). These levels will be pivotal in shaping intraday moves.
📌 Key Levels to Watch:
Last Intraday Resistance: 24,923
Opening Resistance: 24,801
Current Market Level (CMP): 24,677
Opening Support: 24,625
Last Intraday Support (Crucial on daily chart): 24,570
Extended Support Levels: 24,484 → 24,276
🚀 Scenario 1: Gap Up Opening (100+ points)
If Nifty opens near 24,780 – 24,850, it will be very close to the Opening Resistance at 24,801 .
Sustained move above 24,801 may trigger bullish momentum, leading towards 24,923.
A breakout above 24,923 could extend gains towards 25,000+ zones, but traders must confirm strength with follow-up buying.
However, rejection around 24,801 – 24,923 may attract intraday profit booking, dragging Nifty back towards 24,700 – 24,625.
👉 Educational Note: Gap-ups tend to trap aggressive buyers if resistance zones are not broken decisively. Always wait for an hourly close above resistance before committing to fresh longs.
⚖️ Scenario 2: Flat Opening (within ±100 points)
A flat opening near 24,650 – 24,700 will likely keep Nifty in a consolidation phase.
On the upside, a push towards 24,801 needs to be watched closely. If crossed, 24,923 becomes the immediate target.
On the downside, failure to hold 24,625 will invite pressure towards 24,570.
Sustained weakness below 24,570 will likely lead to an extended decline towards 24,484 → 24,276.
👉 Educational Note: Flat openings usually indicate indecision. Such days often turn into range-bound markets until a breakout confirms direction.
📉 Scenario 3: Gap Down Opening (100+ points)
If Nifty opens around 24,550 – 24,500, it will be close to the Last Intraday Support at 24,570 .
A breakdown below 24,570 may extend the decline to 24,484, and if that fails to hold, next support lies at 24,276.
If 24,570 holds firmly, expect a rebound towards 24,625 → 24,700, driven by short covering.
Hourly close below 24,570 is the confirmation for a bearish continuation.
👉 Educational Note: Gap-downs often trigger panic selling in the first hour. Smart traders wait for support to be tested before entering trades to avoid false breakdowns.
🛡️ Risk Management Tips for Options Traders
⏳ Avoid aggressive trades in the first 15–30 mins; let the market settle.
🛑 Always place stop losses on a closing basis (15-min/hourly candle) .
🎯 Use option spreads (Bull Call / Bear Put) to minimize time decay.
⚖️ Stick to a 1:2 or higher risk-reward ratio .
💰 Book partial profits at key levels instead of waiting for extremes.
🧘 Maintain discipline—capital preservation is more important than chasing every move.
📌 Summary & Conclusion
Bullish Bias: Above 24,801 → 24,923, next target 25,000+.
Neutral Zone: Between 24,625 – 24,801, expect sideways consolidation.
Bearish Bias: Below 24,570, expect weakness towards 24,484 → 24,276.
📊 Nifty is trading in a tight band with critical support at 24,570 and resistance at 24,801. A decisive move beyond these levels will guide intraday momentum. Traders should stay patient and trade only on confirmation.
⚠️ Disclaimer: This trading plan is for educational purposes only. I am not a SEBI-registered analyst. Please do your own analysis or consult a financial advisor before making trading decisions.
NIFTY KEY LEVELS FOR 29.09.2025NIFTY KEY LEVELS FOR 29.09.2025
RTF: 3 Minutes
If the candle stays above the pivot point, it is considered a bullish bias; if it remains below, it indicates a bearish bias. Price may reverse near Resistance 1 or Support 1. If it moves further, the next potential reversal zone is near Resistance 2 or Support 2. If these levels are also broken, we can expect the trend.
When a support or resistance level is broken, it often reverses its role; a broken resistance becomes the new support, and a broken support becomes the new resistance.
If the range(R2-S2) is narrow, the market may become volatile or trend strongly. If the range is wide, the market is more likely to remain sideways
please like and share my idea if you find it helpful
📢 Disclaimer
I am not a SEBI-registered financial adviser.
The information, views, and ideas shared here are purely for educational and informational purposes only. They are not intended as investment advice or a recommendation to buy, sell, or hold any financial instruments.
Please consult with your SEBI-registered financial advisor before making any trading or investment decisions.
Trading and investing in the stock market involves risk, and you should do your own research and analysis. You are solely responsible for any decisions made based on this research.
NIFTY : Trading levels and plan for 29-Sep-2025NIFTY TRADING PLAN – 29-Sep-2025
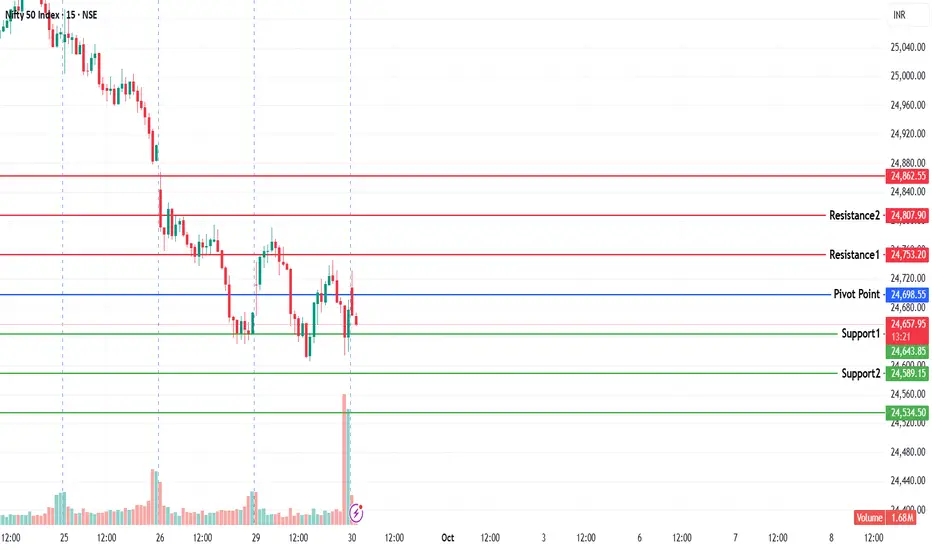
Nifty closed at 24,673.10, consolidating near the Opening Support Zone (24,625 – 24,650) . Price action has weakened in recent sessions, and the index is at a crucial stage where either a relief bounce or further downside may unfold.
📌 Key Levels to Watch:
Last Intraday Resistance: 24,923
Opening Resistance: 24,801
Opening Support: 24,625 – 24,650
Last Intraday Support (Important Day Chart Support): 24,570
Next Major Support: 24,484
Lower Extension Support: 24,276
🚀 Scenario 1: Gap Up Opening (100+ points)
If Nifty opens near 24,770 – 24,820, it will immediately test the Opening Resistance at 24,801 .
Sustaining above 24,801 can invite strength and push the index towards 24,923 (Last Intraday Resistance) .
A breakout above 24,923 may trigger momentum buying and extend the rally further.
If rejection occurs near 24,801, prices may retest 24,650 – 24,625 zone, turning it into a demand area.
👉 Educational Note: Gap-ups require confirmation candles. Enter only if the index sustains above resistance with volume support, as failed gap-ups often reverse quickly.
⚖️ Scenario 2: Flat Opening (within ±100 points)
A flat start around 24,650 – 24,700 keeps Nifty inside the Opening Support Zone (24,625 – 24,650) .
Holding above this zone can attract fresh buying interest, aiming for 24,801 → 24,923 on the upside.
Failure to hold above 24,625 may bring weakness towards 24,570 (Last Intraday Support) .
A close below 24,570 will confirm bearish continuation and may extend selling to 24,484.
👉 Educational Note: Flat openings are ideal for observing initial price behavior. Traders should wait for a breakout of the first 15-minute candle to gauge intraday direction.
📉 Scenario 3: Gap Down Opening (100+ points)
If Nifty opens near or below 24,550 – 24,500, it will test Last Intraday Support at 24,570 right from the start.
A breakdown below 24,570 may accelerate selling towards 24,484 → 24,276 .
However, if 24,570 holds firm, a relief bounce back towards 24,650 – 24,801 is possible on short covering.
Sustained trading below 24,484 would signal stronger bearish control, dragging markets lower.
👉 Educational Note: Gap-downs can trigger panic selling. Safer entries occur when price retests support levels and shows rejection candles, avoiding entry in the first impulsive drop.
🛡️ Risk Management Tips for Options Traders
Avoid trading in the first 15–30 minutes to escape false breakouts/breakdowns.
Always place stop losses on a closing basis of 15-min or hourly candles .
Use spread strategies (Bull Call / Bear Put spreads) instead of naked options near crucial levels.
Respect the risk-to-reward ratio of 1:2 —avoid trades where the stop is too wide.
Scale into trades instead of going all-in; partial booking ensures safety in volatile sessions.
Protect capital first—opportunity will always come back, but capital once lost is hard to recover.
📌 Summary & Conclusion
Bullish Bias: Above 24,801, target 24,923.
Neutral Zone: Between 24,625 – 24,801, expect range-bound moves.
Bearish Bias: Below 24,570, weakness may drag Nifty to 24,484 → 24,276.
📊 Nifty is at a critical support-resistance junction . The reaction near 24,801 (resistance) and 24,570 (support) will decide whether a bounce-back rally unfolds or fresh downside emerges. Traders should maintain discipline and respect levels strictly.
⚠️ Disclaimer: This trading plan is for educational purposes only. I am not a SEBI-registered analyst. Please do your own research or consult a financial advisor before trading.

NIFTY KEY LEVELS FOR 26.09.2025NIFTY KEY LEVELS FOR 26.09.2025
RTF: 3 Minutes
If the candle stays above the pivot point, it is considered a bullish bias; if it remains below, it indicates a bearish bias. Price may reverse near Resistance 1 or Support 1. If it moves further, the next potential reversal zone is near Resistance 2 or Support 2. If these levels are also broken, we can expect the trend.
When a support or resistance level is broken, it often reverses its role; a broken resistance becomes the new support, and a broken support becomes the new resistance.
If the range(R2-S2) is narrow, the market may become volatile or trend strongly. If the range is wide, the market is more likely to remain sideways
please like and share my idea if you find it helpful
📢 Disclaimer
I am not a SEBI-registered financial adviser.
The information, views, and ideas shared here are purely for educational and informational purposes only. They are not intended as investment advice or a recommendation to buy, sell, or hold any financial instruments.
Please consult with your SEBI-registered financial advisor before making any trading or investment decisions.
Trading and investing in the stock market involves risk, and you should do your own research and analysis. You are solely responsible for any decisions made based on this research.
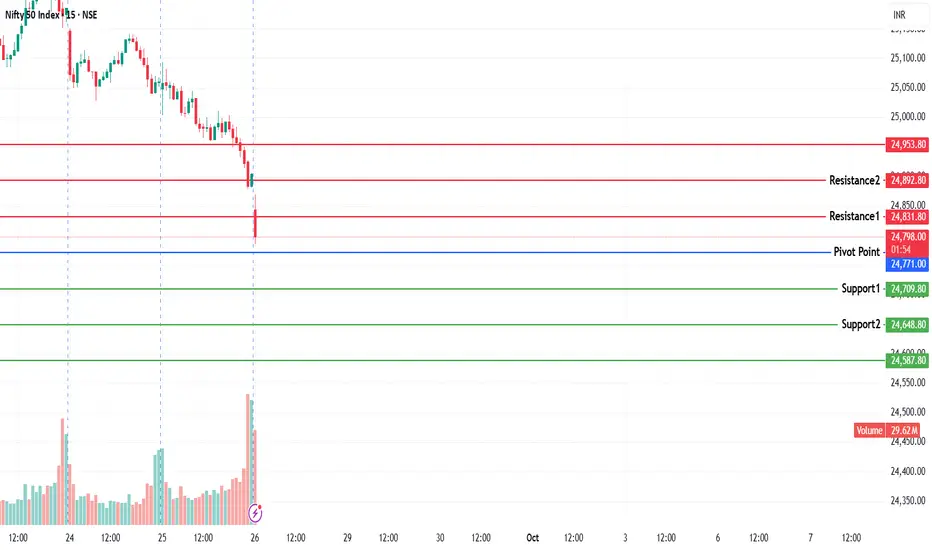
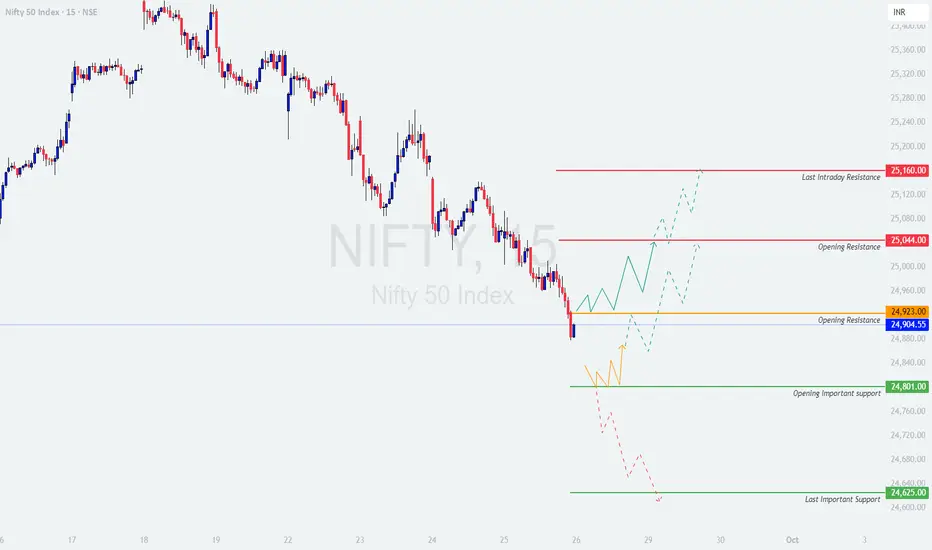
NIFTY : Trading levels and Plan for 26-Sep-2025NIFTY TRADING PLAN – 26-Sep-2025
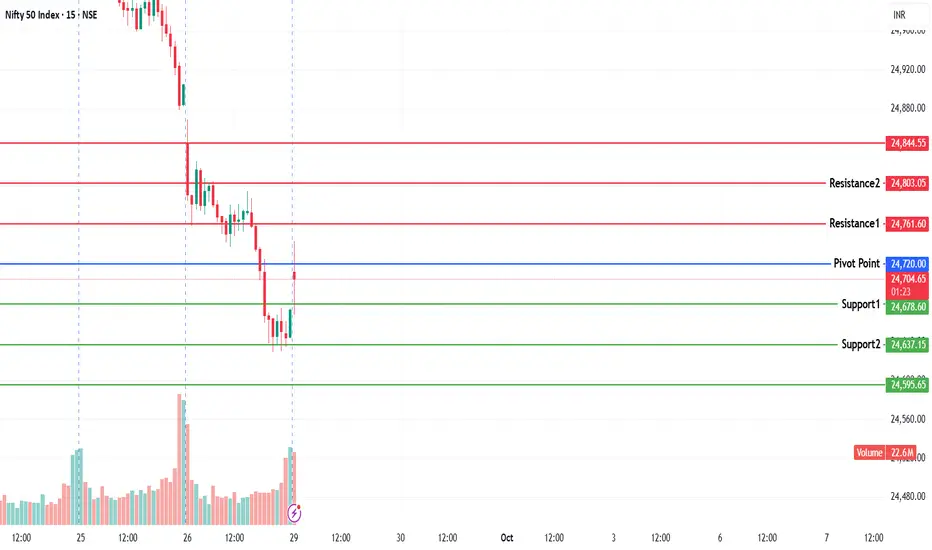
Nifty closed at 24,904.55, very close to the Opening Resistance Zone at 24,904 – 24,923 . Tomorrow’s opening will be crucial in determining whether bulls regain control or bears extend pressure further.
📌 Key Levels to Watch:
Opening Resistance: 24,904 – 24,923
Immediate Resistance: 25,044
Last Intraday Resistance: 25,160
Opening Important Support: 24,801
Last Important Support: 24,625
🚀 Scenario 1: Gap Up Opening (100+ points)
If Nifty opens near or above 25,000 – 25,050, it will immediately test the Opening Resistance at 25,044 .
Sustaining above 25,044 can invite further upside towards 25,160 (Last Intraday Resistance) .
A breakout above 25,160 may trigger fresh momentum buying, potentially extending towards higher zones.
However, failure to hold above 25,044 may attract selling pressure and drag prices back into the 24,904 – 24,923 consolidation zone.
👉 Educational Note: Gap-ups often trap late buyers. Always look for follow-through candles above resistance before adding long positions.
⚖️ Scenario 2: Flat Opening (within ±100 points)
A flat start around 24,850 – 24,950 will keep Nifty in the Opening Resistance zone (24,904 – 24,923) .
Sustaining above 24,923 will give buyers an edge, opening the path towards 25,044 → 25,160.
On the flip side, if the index struggles and slips below 24,904, weakness may extend towards 24,801 (Opening Important Support) .
Traders should be prepared for range-bound price action until either side decisively breaks.
👉 Educational Note: Flat openings offer better clarity as both buyers and sellers test their levels naturally, reducing false breakouts.
📉 Scenario 3: Gap Down Opening (100+ points)
If Nifty opens below 24,800, it will directly test the Opening Important Support at 24,801 .
A breakdown below this level can extend bearishness towards 24,625 (Last Important Support) .
If buyers defend 24,801 – 24,625, a relief rally back to 24,904 is possible through short-covering.
But sustained trading below 24,625 may accelerate selling pressure, weakening market sentiment further.
👉 Educational Note: Gap-downs are usually panic-driven. Safer trades emerge after waiting for confirmation at key supports instead of chasing the first move.
🛡️ Risk Management Tips for Options Traders
Wait for the first 15–30 minutes before entering trades to avoid being trapped by initial volatility.
Use hourly candle close to validate stop losses instead of reacting to intraday spikes.
Avoid naked call/put buying near resistance/support; instead, use spreads (Bull Call / Bear Put).
Keep a minimum 1:2 risk-to-reward ratio for every trade.
Book partial profits on the way instead of holding full lots till the final target.
Always position size carefully—never risk more than 2% of capital in a single trade.
📌 Summary & Conclusion
Bullish View: Above 25,044, momentum may extend to 25,160.
Range-Bound Zone: Between 24,904 – 24,923, expect consolidation until breakout.
Bearish View: Below 24,801, weakness may drag Nifty towards 24,625.
📊 Nifty is trading around a decisive resistance zone. The first 30 minutes will be crucial to determine whether bulls can push above 25,044 or bears take charge below 24,801. Patience and disciplined risk management are key.
⚠️ Disclaimer: This trading plan is for educational purposes only. I am not a SEBI-registered analyst. Please do your own analysis or consult a financial advisor before trading.
NIFTY KEY LEVELS FOR 25.09.2025NIFTY KEY LEVELS FOR 25.09.2025
RTF: 3 Minutes
If the candle stays above the pivot point, it is considered a bullish bias; if it remains below, it indicates a bearish bias. Price may reverse near Resistance 1 or Support 1. If it moves further, the next potential reversal zone is near Resistance 2 or Support 2. If these levels are also broken, we can expect the trend.
When a support or resistance level is broken, it often reverses its role; a broken resistance becomes the new support, and a broken support becomes the new resistance.
If the range(R2-S2) is narrow, the market may become volatile or trend strongly. If the range is wide, the market is more likely to remain sideways
please like and share my idea if you find it helpful
📢 Disclaimer
I am not a SEBI-registered financial adviser.
The information, views, and ideas shared here are purely for educational and informational purposes only. They are not intended as investment advice or a recommendation to buy, sell, or hold any financial instruments.
Please consult with your SEBI-registered financial advisor before making any trading or investment decisions.
Trading and investing in the stock market involves risk, and you should do your own research and analysis. You are solely responsible for any decisions made based on this research.
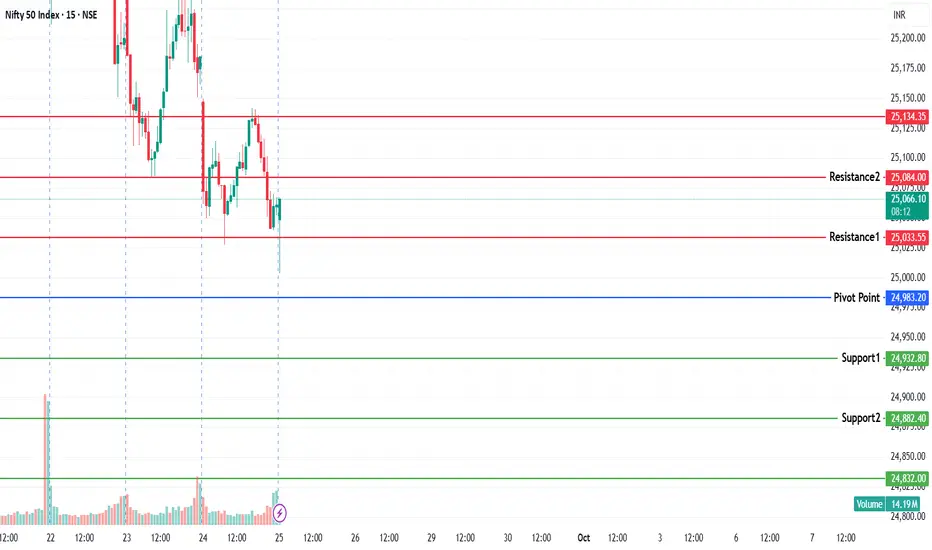
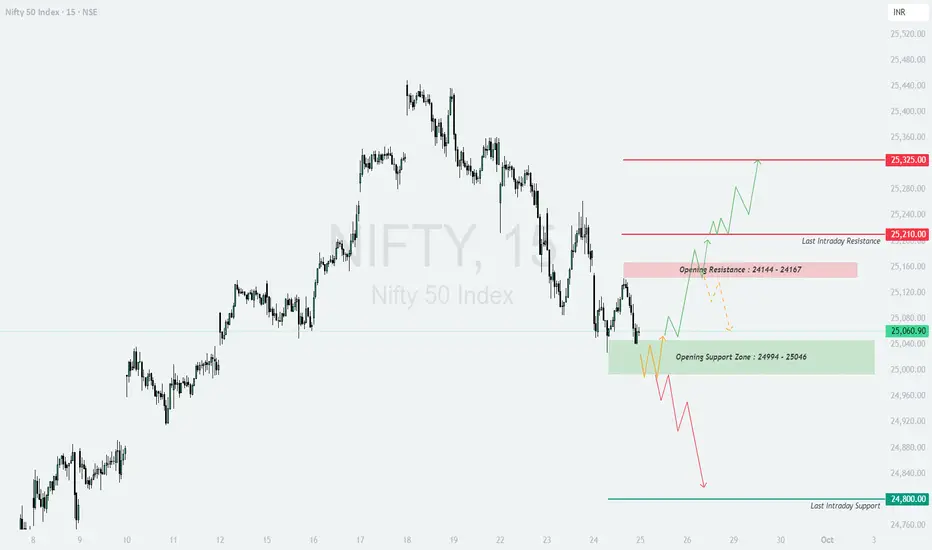
NIFTY : Trading levels and Plan for 26-Sep-2025NIFTY TRADING PLAN – 25-Sep-2025
Nifty closed around 25,060.90, and the chart shows critical levels for the upcoming session. Traders should focus on the Opening Support Zone: 24,994 – 25,046 and Opening Resistance Zone: 25,144 – 25,167 . Major intraday boundaries are set at 24,800 (Support) and 25,325 (Resistance) .
🚀 Scenario 1: Gap Up Opening (100+ points)
If Nifty opens above 25,160+, it will directly enter the Opening Resistance Zone . Traders should watch whether price sustains above this zone or shows rejection.
Sustaining above 25,167 can lead to bullish momentum towards the last intraday resistance at 25,210 and further extension to 25,325 .
If rejection occurs, price may slip back to the support zone of 25,046–24,994, where buying interest may re-emerge.
👉 Educational Note: A strong gap-up often traps late buyers. Wait for the first 15–30 minutes to confirm if the breakout sustains before entering.
⚖️ Scenario 2: Flat Opening (within ±100 points)
A flat start near 25,060 means price will hover close to the Opening Support Zone .
Holding above 25,046 can trigger an upward move towards 25,144–25,167 resistance. If broken, it opens the path for 25,210 → 25,325.
On the downside, failure to hold 25,046 may bring quick selling towards 24,994, and extended weakness can test the last intraday support of 24,800.
👉 Educational Note: Flat openings are usually safer for directional trades since they allow traders to align with intraday trend rather than chasing gaps.
📉 Scenario 3: Gap Down Opening (100+ points)
A gap-down below 24,960 will pressure the market, pushing it closer to the Opening Support Zone (24,994–25,046) .
If Nifty breaks below 24,994 and sustains, expect selling pressure towards the last intraday support at 24,800 .
However, if support holds, a sharp short-covering bounce may lift Nifty back towards 25,046 → 25,144 levels.
👉 Educational Note: Gap-down openings are often emotional reactions to global cues. Avoid panic entries; instead, wait for price to show whether the support zone holds.
🛡️ Risk Management Tips for Options Traders
Always define your stop-loss on hourly closing basis to avoid noise from smaller candles.
Avoid over-leveraging; trade with limited lots suitable for your capital.
Do not chase gaps. Let the first 30 minutes decide market direction.
Prefer spreads (like Bull Call or Bear Put Spreads) near resistance/support zones to manage premium decay.
Keep risk-to-reward at least 1:2 before entering trades.
📌 Summary & Conclusion
Bullish Trigger: Above 25,167, expect momentum towards 25,210 → 25,325.
Neutral Zone: Between 25,046 – 25,144, price may consolidate before choosing direction.
Bearish Trigger: Below 24,994, weakness may extend towards 24,800.
Traders should remain flexible and adapt to intraday price action. Waiting for confirmation after the open will help in avoiding false breakouts and improve probability of success.
⚠️ Disclaimer: This analysis is purely for educational purposes. I am not a SEBI-registered analyst. Traders are advised to do their own research or consult with a financial advisor before making trading decisions.
NIFTY KEY LEVELS FOR 24.09.2025NIFTY KEY LEVELS FOR 24.09.2025
RTF: 3 Minutes
If the candle stays above the pivot point, it is considered a bullish bias; if it remains below, it indicates a bearish bias. Price may reverse near Resistance 1 or Support 1. If it moves further, the next potential reversal zone is near Resistance 2 or Support 2. If these levels are also broken, we can expect the trend.
When a support or resistance level is broken, it often reverses its role; a broken resistance becomes the new support, and a broken support becomes the new resistance.
If the range(R2-S2) is narrow, the market may become volatile or trend strongly. If the range is wide, the market is more likely to remain sideways
please like and share my idea if you find it helpful
📢 Disclaimer
I am not a SEBI-registered financial adviser.
The information, views, and ideas shared here are purely for educational and informational purposes only. They are not intended as investment advice or a recommendation to buy, sell, or hold any financial instruments.
Please consult with your SEBI-registered financial advisor before making any trading or investment decisions.
Trading and investing in the stock market involves risk, and you should do your own research and analysis. You are solely responsible for any decisions made based on this research.
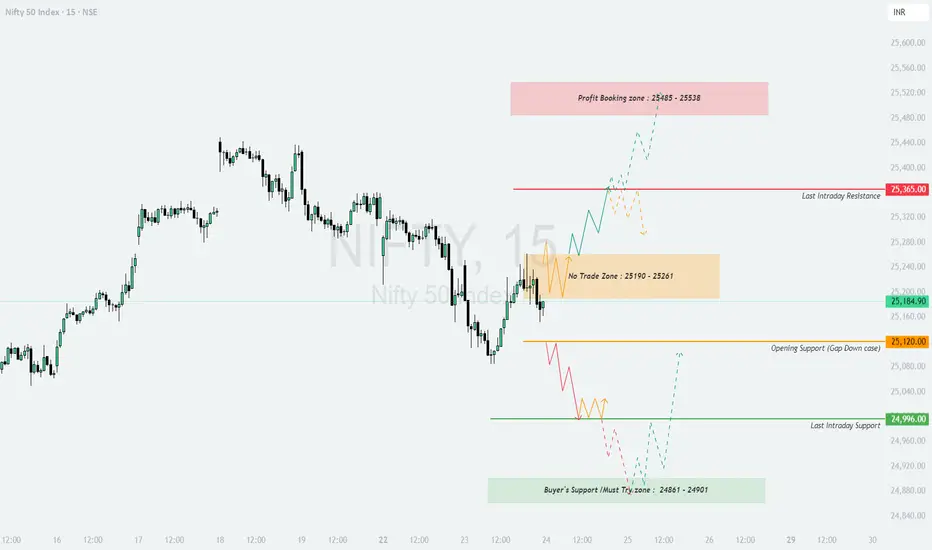
NIFTY : Trading levels and Plan for 24-Sep-2025NIFTY TRADING PLAN – 24-Sep-2025
📌 Key Levels to Watch :
🟥 25,485 – 25,538 → Profit Booking Zone
🟥 25,365 → Last Intraday Resistance
🟧 25,190 – 25,261 → No Trade Zone
🟧 25,120 → Opening Support (Gap Down case)
🟩 24,996 → Last Intraday Support
🟩 24,861 – 24,901 → Buyer’s Must Try Zone
🚀 Gap Up Opening (100+ points above previous close)
If Nifty opens above 25,261, immediate resistance lies near 25,365. Sustained price action above this level can open the door to the Profit Booking Zone (25,485 – 25,538) .
Traders can consider long trades above 25,365, but profit booking is advisable once prices approach the upper band.
However, if Nifty fails to sustain above 25,365, a pullback toward the No Trade Zone (25,190 – 25,261) is possible.
📚 Educational Note: Gap-up openings near resistance levels can create false breakouts. Always wait for a strong candle close above resistance to confirm momentum.
⚖️ Flat Opening (within 100 points range)
If Nifty opens inside the 25,190 – 25,261 No Trade Zone, avoid aggressive entries as price action may remain choppy.
A breakout above 25,261 with strength may push the index toward 25,365 and higher levels.
A breakdown below 25,190 can drag the index toward 25,120 and 24,996 supports.
📚 Educational Note: Flat openings inside congestion zones are best avoided until the market provides a clear breakout direction. Patience often saves capital in such situations.
⚠️ Gap Down Opening (100+ points below previous close)
If Nifty opens below 25,120, weakness can extend toward the Last Intraday Support at 24,996.
A further drop could test the Buyer’s Must Try Zone (24,861 – 24,901) , where strong buying interest may emerge.
Reversal signals here can be used for small long attempts with a strict stop loss. If this zone fails, deeper downside may unfold.
📚 Educational Note: Gap downs often create panic selling, but supports like the Buyer’s Zone provide opportunity for sharp intraday reversals. Focus on confirmation before entering.
💡 Risk Management Tips for Options Traders :
❌ Avoid trading inside the No Trade Zone (25,190 – 25,261) to prevent whipsaws.
⏳ Wait for the first 15–30 minutes to let the market settle before entering trades.
📌 Use ATM or slightly ITM options for better risk-reward during directional moves.
🔒 Always keep stop-losses in place and never risk more than 2% of trading capital per trade.
🛡️ Consider spreads (Bull Call / Bear Put) on volatile days to minimize premium erosion.
✅ Summary & Conclusion :
A Gap Up above 25,261 can extend toward 25,365 and the Profit Booking Zone, but requires confirmation.
A Flat Opening inside 25,190 – 25,261 is a no-trade area; wait for breakout or breakdown.
A Gap Down below 25,120 may test 24,996 and the Buyer’s Support Zone (24,861 – 24,901).
The focus should remain on respecting key levels, avoiding noise, and trading only confirmed setups.
⚠️ Disclaimer : This analysis is purely for educational purposes. I am not a SEBI-registered analyst . Please consult a financial advisor or do your own research before taking trading decisions.
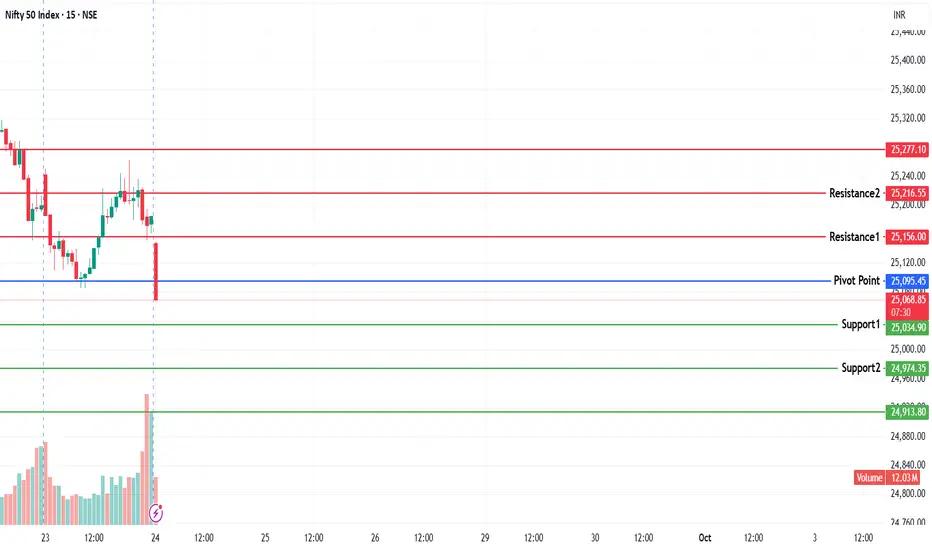
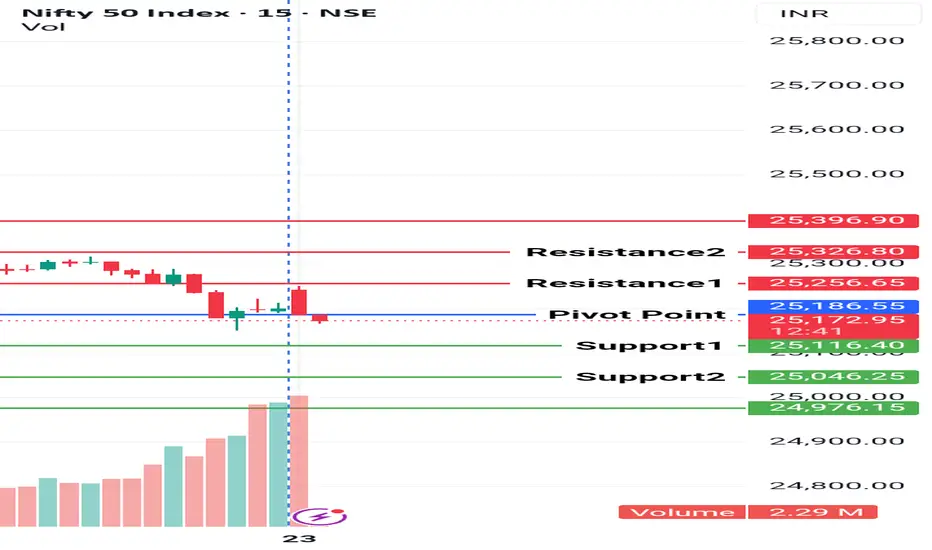
Nifty key levels for 23.09.2025NIFTY KEY LEVELS FOR 23.09.2025
RTF: 3 Minutes
If the candle stays above the pivot point, it is considered a bullish bias; if it remains below, it indicates a bearish bias. Price may reverse near Resistance 1 or Support 1. If it moves further, the next potential reversal zone is near Resistance 2 or Support 2. If these levels are also broken, we can expect the trend.
When a support or resistance level is broken, it often reverses its role; a broken resistance becomes the new support, and a broken support becomes the new resistance.
If the range (R2-S2) is narrow, the market may become volatile or trend strongly. If the range is wide, the market is more likely to remain sideways.
please like and share my idea if you find it helpful
Disclaimer
The idea is for educational purpose only..
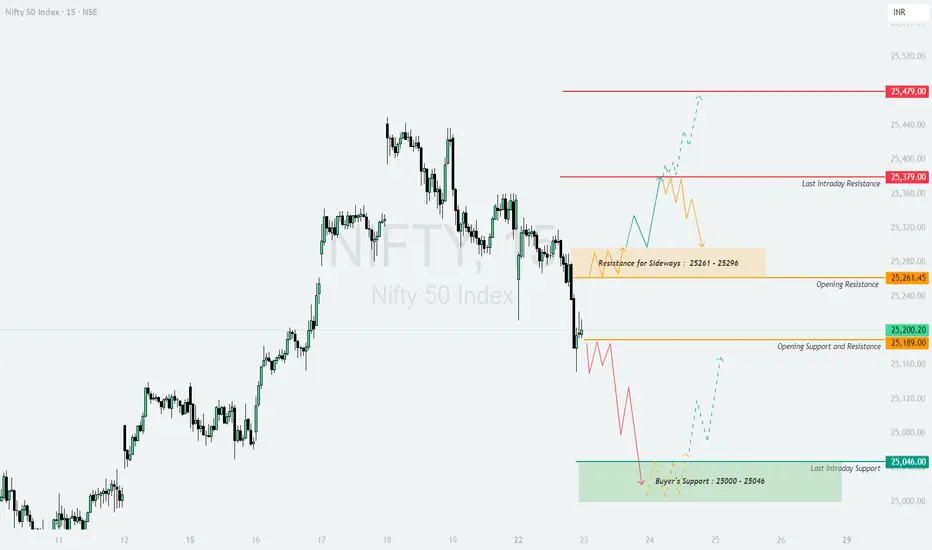
NIFTY : Trading levels and plan for 23-Sep-2025NIFTY TRADING PLAN – 23-Sep-2025
Nifty closed near 25,200, holding around the critical zone of 25,189–25,200, with multiple resistances above and strong support below.
Opening Resistance: 25,261
Sideways Resistance Zone: 25,261–25,296
Last Intraday Resistance: 25,379
Major Resistance: 25,479
Opening Support: 25,189
Last Intraday Support (Buyers’ Zone): 25,000–25,046
With a gap opening threshold of 100+ points, let’s look at the trading scenarios in detail:
🚀 Gap Up Opening (100+ points above previous close)
If Nifty opens near or above 25,300–25,320, it will enter a test zone of 25,261–25,296.
A sustained breakout above 25,296 may invite momentum buying towards 25,379, and a further extension can take it towards 25,479.
If Nifty fails to sustain above 25,296, then a pullback towards 25,261–25,200 can occur. This retracement may offer intraday shorting opportunities.
👉 Traders should avoid chasing the initial spike. Waiting for 15–30 minutes for confirmation will help avoid false breakouts.
⚖️ Flat Opening (near 25,180–25,220 zone)
In case of a flat start, the immediate play will be between 25,189 (support) and 25,261 (resistance).
A decisive move above 25,261 can attract bullish momentum towards 25,296–25,379.
Conversely, slipping below 25,189 may drag Nifty back towards 25,046, which is a critical buyer’s zone.
👉 This is the best scenario for breakout traders, as both sides provide clear risk-reward setups depending on the direction chosen by the market.
📉 Gap Down Opening (100+ points below previous close)
If Nifty opens near or below 25,100, immediate pressure will shift focus to the 25,000–25,046 buyer’s support zone.
A quick bounce from this zone can trigger a recovery rally back towards 25,189–25,261.
However, if Nifty breaks below 25,000 and sustains, it will trigger strong bearish momentum, possibly extending the fall towards 24,950–24,880 levels.
👉 In this setup, option traders can look for put buying opportunities but must keep stop-losses tight, as volatility will be high around psychological levels like 25,000.
🛡️ Risk Management & Option Trading Tips
Always allow the first 15–30 minutes for market direction to settle before taking trades.
Trade near support/resistance zones; avoid entries in the middle range.
Follow hourly candle closing for breakout confirmations.
Keep a 1:2 minimum risk-reward ratio to filter low-quality trades.
In options trading, avoid over-leveraging as premiums decay quickly on sideways days.
Respect levels like 25,000, which act as strong psychological supports/resistances.
📌 Summary & Conclusion
Above 25,296, bullish momentum may extend towards 25,379–25,479 🚀.
Flat openings will revolve around 25,189–25,261 levels, offering breakout trades ⚖️.
Below 25,000, deeper bearish pressure may emerge, targeting 24,950–24,880 📉.
Discipline, patience, and waiting for price confirmation at key levels will be crucial for success.
⚠️ Disclaimer
I am not a SEBI-registered analyst. This analysis is only for educational purposes. Please do your own research or consult a financial advisor before making any trading decisions.
Nifty weekly expiry analysis for 23/09/2025.Nifty has created 3 consecutive red candle on the daily charts and might touch its 20 EMA.
Market is around the All time high levels and chances of profit booking are there.
Today, nifty has closed 125 points lower than the pervious close.
Major Resistance levels :- 25311, 25438
Support levels :- 25094, 25010
On the hourly charts, the market seems to be taking rejection from the hourly 20 ema and it trading between 20 and 50 EMA.
It is trading in a close parallel channel range. If it remains in the range avoid trading or scalp as per the risk appetite.
Though nifty has taking down the 50 EMA and there are chance of it tested the higher moving averages soon.
Tomorrow is nifty weekly expiry. Wait and watch for the price action near the price levels before entering a trade.
