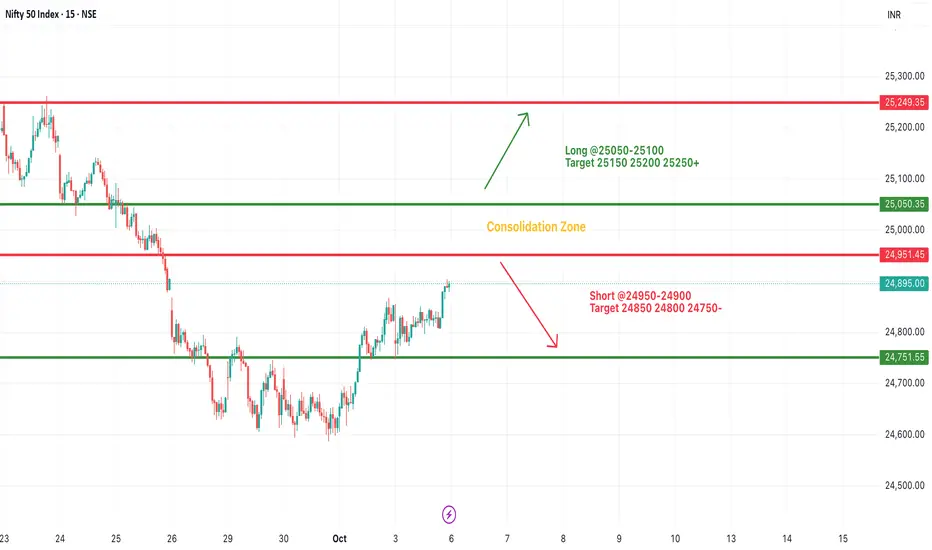
#NIFTY Intraday Support and Resistance Levels - 06/10/2025Nifty is expected to open flat near the 24,900 level, indicating a balanced sentiment between buyers and sellers after recent positive momentum. The index is currently hovering close to its upper consolidation zone, and today’s session will be crucial to determine whether it breaks above resistance or faces selling pressure.
A sustained move above 24,950–25,100 could trigger a strong upside rally toward 25,150, 25,200, and 25,250+, marking a potential continuation of the recovery trend. On the downside, a rejection from the upper band may lead to a pullback toward 24,850, 24,800, and 24,750 levels.
Overall, the short-term outlook remains cautiously bullish as long as Nifty holds above the 24,750 support zone. Traders should focus on breakout confirmations from the current consolidation range to capture directional intraday moves.
Niftyprediction
NIFTY : Trading levels and plan for 06-Oct-2025NIFTY TRADING PLAN – 06-Oct-2025
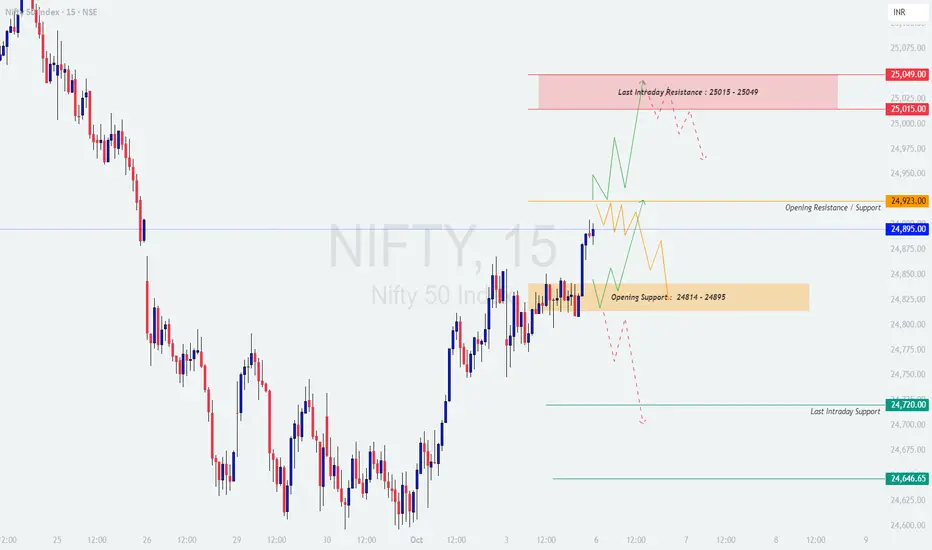
Nifty closed at 24,895, showing strong recovery momentum but still trading near crucial resistance and support levels. Tomorrow’s opening and follow-up price action will be key in determining short-term direction.
📌 Key Levels to Watch:
Opening Support Zone: 24,814 – 24,895
Opening Resistance / Support: 24,923
Last Intraday Resistance: 25,015 – 25,049
Last Intraday Support: 24,720 & 24,646
🚀 Scenario 1: Gap Up Opening (100+ points)
If Nifty opens above 25,000, it will be very close to Last Intraday Resistance (25,015 – 25,049) .
Sustained price action above 25,049 could trigger further momentum towards 25,100 – 25,150 levels.
However, if rejection occurs around resistance, expect profit booking back towards 24,950 – 24,923.
Traders should avoid chasing the gap-up and instead look for either a breakout confirmation or rejection signals to enter.
👉 Educational Note: Gap-ups near resistance zones often trap late buyers. Always wait for a retest before committing to a trade.
⚖️ Scenario 2: Flat Opening (within ±100 points)
A flat start near 24,850 – 24,900 will keep Nifty inside the Opening Support Zone (24,814 – 24,895) and just below 24,923 Resistance .
A breakout above 24,923 can fuel a rally towards 25,015 – 25,049, with further extension possible if momentum is strong.
On the downside, failure to hold above 24,814 may pull prices back to 24,720 or even 24,646.
Traders should adopt a wait-and-watch approach until the range between 24,814 – 24,923 is broken.
👉 Educational Note: Flat openings usually create range-bound trades early in the session. Focus on range breakouts to avoid getting chopped in sideways action.
📉 Scenario 3: Gap Down Opening (100+ points)
If Nifty opens near or below 24,750 – 24,720, the Last Intraday Support (24,720) will be tested immediately.
A breakdown below 24,720 could extend weakness towards 24,646 – 24,600.
However, if support holds at 24,720 – 24,646, a sharp short-covering rally back towards 24,850 – 24,900 is possible.
Patience will be key – wait for confirmation whether support sustains or breaks before taking positions.
👉 Educational Note: Gap-downs often trigger panic selling, but they can also present excellent reversal opportunities if support holds firmly.
🛡️ Risk Management Tips for Options Traders
⏳ Avoid taking aggressive positions in the first 15–30 minutes; let volatility settle.
🛑 Place stop losses based on 15-min or hourly candle closes , not just wicks.
🎯 Use option spreads (Bull Call, Bear Put) to manage premium decay.
📉 Always maintain at least a 1:2 Risk-Reward ratio .
💰 Book partial profits at key levels to protect capital.
🧘 Never risk more than 2–3% of capital on a single trade.
📌 Summary & Conclusion
Bullish Bias: Above 24,923, targets 25,015 → 25,049 → 25,100+.
Neutral Zone: Between 24,814 – 24,923, expect consolidation.
Bearish Bias: Below 24,720, weakness towards 24,646 – 24,600.
📊 Nifty is currently at a decision-making level. Breakout above resistance can extend bullish momentum, while breakdown below support may invite selling pressure. The best approach is to stay patient, follow confirmation signals, and manage risk with discipline.
⚠️ Disclaimer: This analysis is purely for educational purposes. I am not a SEBI-registered analyst. Please do your own research or consult with a financial advisor before making trading decisions.
Short term trend opens up in Nifty So on Thursday we studied that NSE:NIFTY would remain sideways with a bullish tone.
And that’s exactly what happened on Friday.
Nifty traded within a range in the first half and then moved up sharply in the second half, closing +57 points higher.
Closing above the previous day’s high is definitely a good price action sign.
But ideally, buyers’ volume should have matched that momentum too.
On Friday, buyers’ volume was up — but not strong enough to suggest a sharp move ahead. In fact, on the last 15-minute candle, sellers’ volume was higher by 10 million.
However, on short-term charts, net volume has turned green, which means any dip till 24800 will likely be bought quickly.
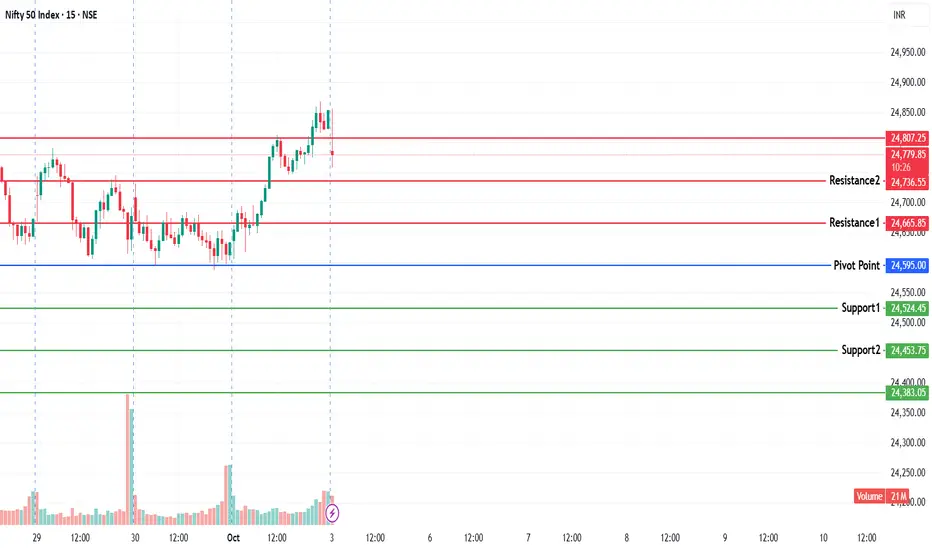
Now, Nifty’s Pivot stands at 24848. A drop below this could lead to another range-bound session tomorrow, with support at 24800.
Resistance for the day would be 24925, and any meaningful move will only come if this level is broken and sustained for at least one hour.
Since PP is tight, if a breakout happens with strong buyers’ volume, we could see a sharp rally upward.
For FnO stocks, we’ll continue tracking NSE:BSE and NSE:BHARATFORG .
Sector-wise, #Shipbuilding, #NBFC, and #AutoParts are looking good.
That’s all for the day. Take care and have a profitable tomorrow.
---
📊 Levels at a glance:
Pivot: 24848
Support: 24800
Resistance: 24925 (sustain > 1H = breakout)
Pivot Percentile: Tight (sharp rally possible on volume breakout)
Bias: Sideways to bullish, buy dips above pivot
Sectors to watch: Shipbuilding, NBFC, Auto Parts
FnO Focus: #BSE, #BHARATFORG

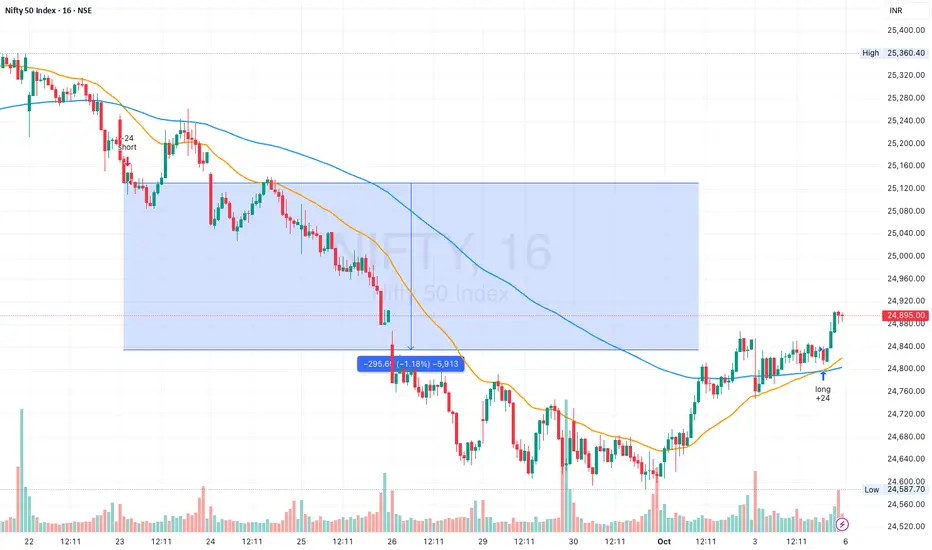
03 Oct 205 - Nifty is now Long, hope we get a new swing highNifty Stance Bullish 🐂
The last EMA crossover signal occurred on 23rd September, at which point we had gone short on the Nifty. The long signal was triggered today, on October 3rd, at 13:47, resulting in a profit of 295 points.
I did not think that we would get a long signal that soon, hoping that we could fall a bit more, especially to the 24400 levels, but the markets had other plans.
From here, Nifty needs to break the resistances at 24931 and 25003 to reach the 25219 levels, which also means it will surpass the last short signal in the 25132 zone. The recent swing high of 25448, if broken, could lead to a superb short-covering rally that could even help us take out the ATH, but let us hope that we go there as slowly as possible so that we don't fall back sharply as we did in the last 10 sessions.
Valuations are improving for select stocks, and this also means it's a favorable buying opportunity. Let us also not forget that FIIs will only invest in Indian stocks if the comparable value improves relative to global peers.
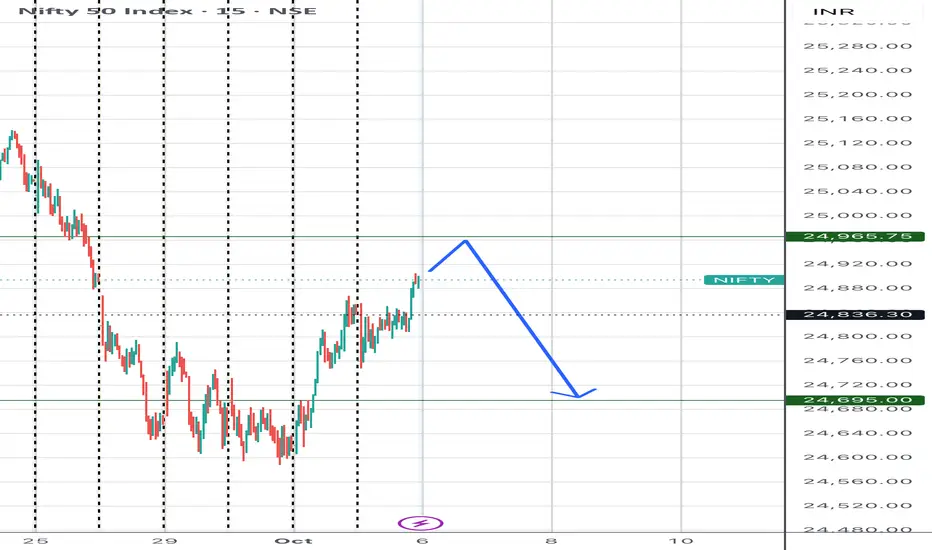
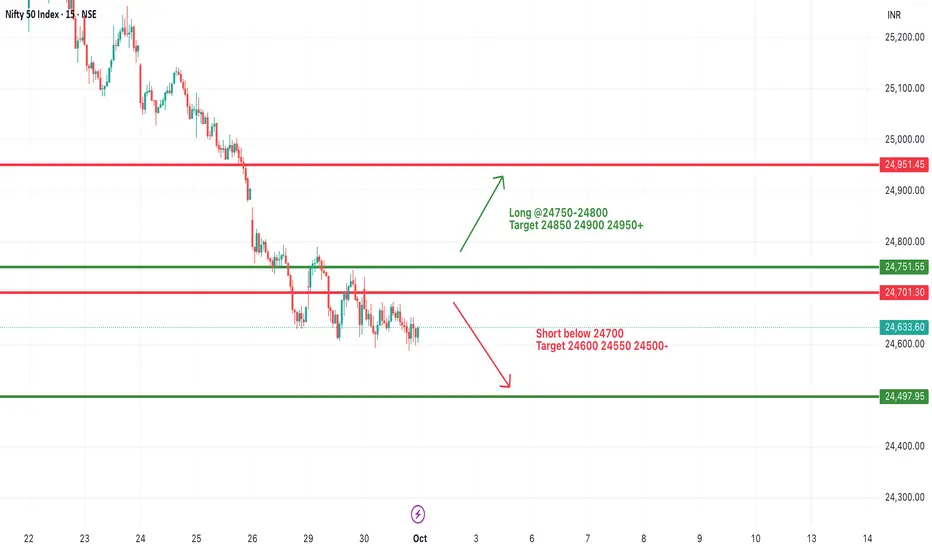
Nifty next week move Nifty next week move from 5 Oct 2025 .
Nifty might open higher then touch 24965 level then we can plan for short trade if we gets any entry bassed on 15min 9Ema cross over or Mss.
To target 24695.
Let see what happens next in nifty
NIFTY KEY LEVELS FOR 03.10.2025NIFTY KEY LEVELS FOR 03.10.2025
RTF: 3 Minutes
If the candle stays above the pivot point, it is considered a bullish bias; if it remains below, it indicates a bearish bias. Price may reverse near Resistance 1 or Support 1. If it moves further, the next potential reversal zone is near Resistance 2 or Support 2. If these levels are also broken, we can expect the trend.
When a support or resistance level is broken, it often reverses its role; a broken resistance becomes the new support, and a broken support becomes the new resistance.
If the range(R2-S2) is narrow, the market may become volatile or trend strongly. If the range is wide, the market is more likely to remain sideways
please like and share my idea if you find it helpful
📢 Disclaimer
I am not a SEBI-registered financial adviser.
The information, views, and ideas shared here are purely for educational and informational purposes only. They are not intended as investment advice or a recommendation to buy, sell, or hold any financial instruments.
Please consult with your SEBI-registered financial advisor before making any trading or investment decisions.
Trading and investing in the stock market involves risk, and you should do your own research and analysis. You are solely responsible for any decisions made based on this research.
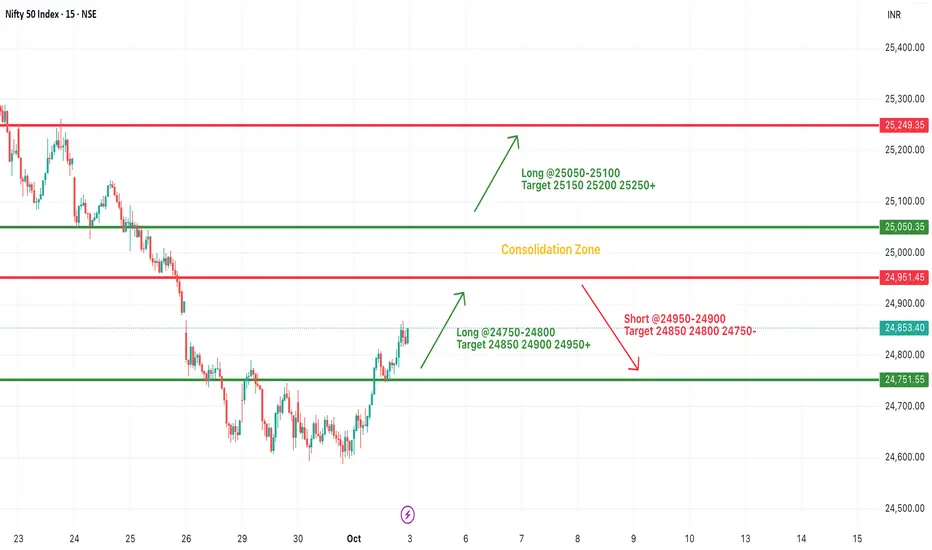
#NIFTY Intraday Support and Resistance Levels - 03/10/2025Nifty is set to open with a gap-up near the 24,950 level, placing it close to a key resistance zone. If the index sustains above 24,950–25,000, it can trigger further upside momentum toward 25,050, 25,150, and 25,200+. A breakout above 25,250 will strengthen the bullish sentiment, potentially extending the move toward 25,300–25,350 levels.
On the downside, immediate support lies around 24,850–24,800, and a failure to hold these levels may lead to profit booking. A break below 24,750 could invite selling pressure, dragging the index toward 24,700 and 24,650-.
Overall, with a gap-up opening near resistance, today’s session is likely to remain volatile. Sustaining above 24,950 will favor bulls, while rejection from this level may bring quick reversals. Traders should focus on breakout confirmations with strict stop-losses.
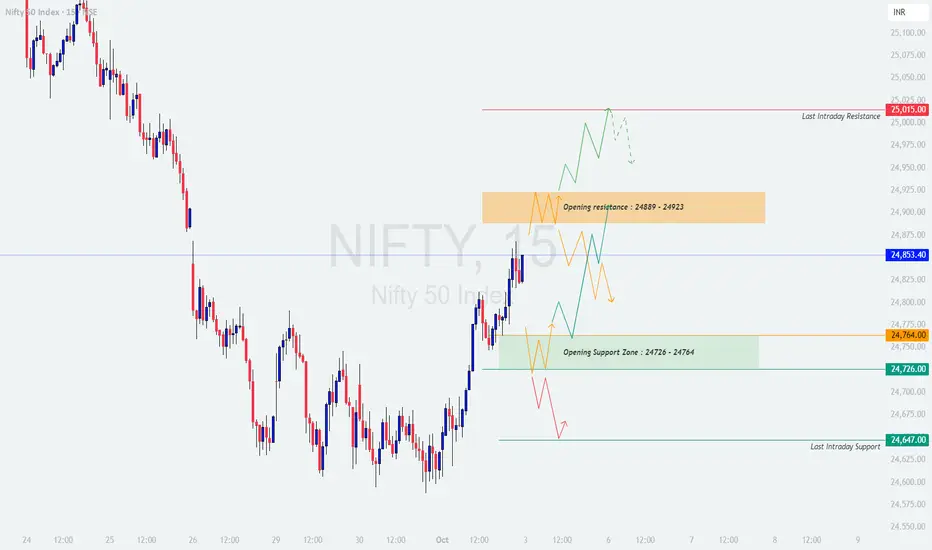
NIFTY : Trading levels and plan for 03-Oct-2025NIFTY TRADING PLAN – 03-Oct-2025
Nifty closed at 24,853.40, recovering from recent declines and now trading near crucial resistance and support zones. Tomorrow’s movement will largely depend on whether the index can break above 24,889 – 24,923 (Opening Resistance Zone) or hold below 24,726 – 24,764 (Opening Support Zone).
📌 Key Levels to Watch:
Opening Resistance Zone: 24,889 – 24,923
Last Intraday Resistance: 25,015
Opening Support Zone: 24,726 – 24,764
Last Intraday Support: 24,647
🚀 Scenario 1: Gap Up Opening (100+ points)
If Nifty opens near or above 24,950 – 25,000, it will directly challenge the Last Intraday Resistance (25,015) .
A sustained move above 25,015 could extend momentum towards 25,100+ levels, signaling strength.
However, if prices face rejection near 25,015, expect profit booking with pullback towards 24,900 – 24,850.
Traders should avoid chasing at higher openings and instead wait for confirmation of sustained breakout before entering fresh longs.
👉 Educational Note: Gap-up openings near resistance zones often trap impatient buyers. It is safer to wait for retests before committing capital.
⚖️ Scenario 2: Flat Opening (within ±100 points)
A flat start near 24,800 – 24,850 will keep Nifty between its Opening Resistance Zone (24,889 – 24,923) and Opening Support Zone (24,726 – 24,764) .
A decisive breakout above 24,923 may fuel momentum towards 25,015, with scope for extension to 25,100.
On the other hand, a breakdown below 24,726 could drag the index back to 24,647.
Expect sideways choppiness unless one side breaks decisively with volume confirmation.
👉 Educational Note: Flat openings indicate market indecision. Traders should focus on range breakout opportunities rather than anticipating moves.
📉 Scenario 3: Gap Down Opening (100+ points)
If Nifty opens near 24,700 – 24,650, it will test the Opening Support Zone (24,726 – 24,764) and may even challenge the Last Intraday Support (24,647) .
Breakdown below 24,647 could invite further weakness towards 24,550 – 24,500.
However, if the support zone holds, a rebound towards 24,800 – 24,850 is possible, triggering short covering.
Traders should wait for the first 15–30 mins to confirm whether supports sustain before taking trades.
👉 Educational Note: Gap-downs create panic. Disciplined traders wait for either breakdown confirmation or a sharp recovery signal to trade with better risk-reward.
🛡️ Risk Management Tips for Options Traders
⏳ Avoid trading aggressively in the first 15–30 minutes after opening.
🛑 Always keep stop losses based on 15-min/hourly candle close.
🎯 Use option spreads (Bull Call / Bear Put) to minimize premium decay risk.
📉 Maintain a minimum 1:2 Risk-Reward ratio on every trade.
💰 Book partial profits at key levels to protect gains.
🧘 Never risk more than 2–3% of total capital on a single trade.
📌 Summary & Conclusion
Bullish Bias: Above 24,923, targets 25,015 → 25,100.
Neutral Zone: Between 24,726 – 24,923, expect sideways consolidation.
Bearish Bias: Below 24,647, weakness towards 24,550 – 24,500 possible.
📊 Nifty is at a crucial juncture. Breakout above resistance can fuel bullish momentum, while breakdown below support may trigger renewed selling pressure. Traders should remain patient, disciplined, and trade only on confirmation of breakout/breakdown with volume.
⚠️ Disclaimer: This analysis is for educational purposes only. I am not a SEBI-registered analyst. Please do your own research or consult with a financial advisor before making trading decisions.
Nifty to be bearish this next days or notNifty was bullish on the last trading day.
But i am looking for a bearish days to target liquidity below 24530.
Till this liquidity below 24530 is not taken
I will not plan a long trade or wait for confirmation again if nifty wants to go up or not.

Nifty 50: Genuine Rally or Selloff Setup?The Nifty 50 Index went up, but this upward move was likely just a temporary correction, not the start of a new, long-term rise.
Bottom (Wave W): The index first hit a low around 24,377
Bounce (Wave X): It then went up to a high near 25,448 . This rise was a clear, three-part corrective move (like an ABC pattern) that stayed inside a rising channel .
Clue: Because the move from the bottom (W) to the peak (X) was corrective, it suggests the overall trend is still bearish (downward).
Points to look at:
1. Reversal: The index is currently around 24,836 and is starting to turn down from the top of that rising channel. This suggests the temporary rise is over.
2. Projected Drop (Wave Y): The main prediction is a significant drop (Wave Y) that will likely break the previous low of 24,377 .
3. Target: This decline is expected to head toward the lower blue trendline on the chart, completing a larger WXY corrective pattern.
4. Projection: Ending point of wave (Y) can act as the ride for the new impulse cycle.
5. Bearish Stance: Traders should be cautiously bearish (expecting the price to fall).
6. Price action perspective: Previous swing is bearish, better to look at short positions for safe entry.
7. Selling Opportunities: Any small upward movements (retracements) are seen as good selling opportunities (betting on the price going down), as long as the price doesn't break above the recent highs or the channel ceiling.24,300 is indeed a strong demand zone.
Stay tuned!
Money Dictators :)

NIFTY KEY LEVELS FOR 01.10.2025NIFTY KEY LEVELS FOR 01.10.2025
RTF: 3 Minutes
If the candle stays above the pivot point, it is considered a bullish bias; if it remains below, it indicates a bearish bias. Price may reverse near Resistance 1 or Support 1. If it moves further, the next potential reversal zone is near Resistance 2 or Support 2. If these levels are also broken, we can expect the trend.
When a support or resistance level is broken, it often reverses its role; a broken resistance becomes the new support, and a broken support becomes the new resistance.
If the range(R2-S2) is narrow, the market may become volatile or trend strongly. If the range is wide, the market is more likely to remain sideways
please like and share my idea if you find it helpful
📢 Disclaimer
I am not a SEBI-registered financial adviser.
The information, views, and ideas shared here are purely for educational and informational purposes only. They are not intended as investment advice or a recommendation to buy, sell, or hold any financial instruments.
Please consult with your SEBI-registered financial advisor before making any trading or investment decisions.
Trading and investing in the stock market involves risk, and you should do your own research and analysis. You are solely responsible for any decisions made based on this research.
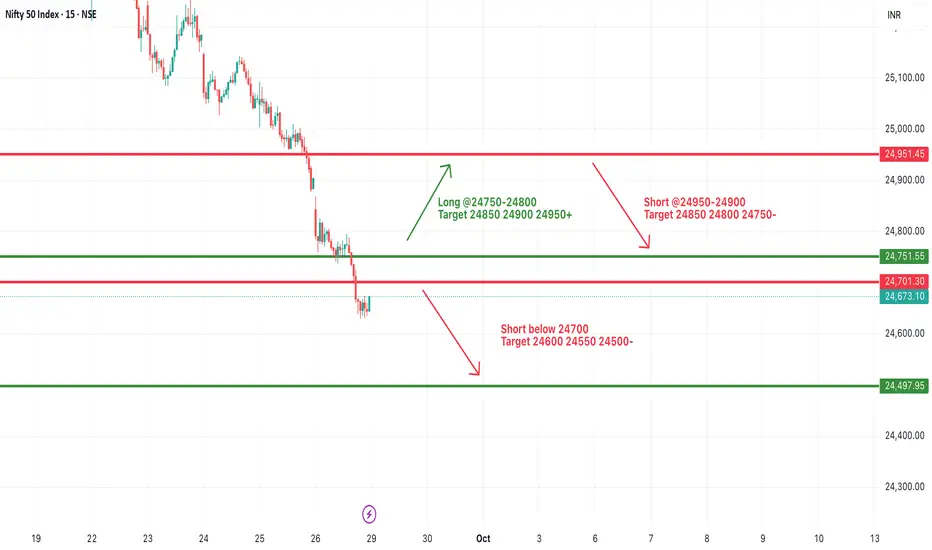
#NIFTY Intraday Support and Resistance Levels - 01/10/2025Nifty is expected to witness a slightly gap-up opening near the 24,700 level, which will be crucial to watch as it aligns with an immediate resistance zone. Sustaining above 24,750–24,800 may trigger upward momentum, pushing the index toward 24,850, 24,900, and 24,950+. A breakout above these levels will strengthen the bullish sentiment and may open the way for higher levels.
On the downside, if Nifty fails to hold above 24,700 and slips below 24,650–24,600, it could invite selling pressure. In such a case, the index may drift lower toward 24,550 and further to 24,500-. A deeper breakdown below 24,500 can extend the weakness and confirm continuation of the broader downtrend.
Overall, Nifty remains in a cautious zone, and the movement around 24,700 will decide whether the day favors a recovery bounce or continuation of weakness. Traders should stay alert around these levels with strict stop-losses.
[INTRADAY] #BANKNIFTY PE & CE Levels(01/10/2025)Bank Nifty is expected to open flat around the 54,650–54,700 zone, signaling consolidation after recent volatility. The index is trading close to crucial support and resistance levels, and today’s movement will depend on which side breaks first.
On the upside, sustaining above 54,550–54,600 can trigger further momentum, taking the index toward 54,750, 54,850, and 54,950+. A strong breakout above 55,050 will add more strength and may push Bank Nifty toward higher levels.
On the downside, a break below 54,450–54,400 can lead to selling pressure, dragging the index to 54,250, 54,150, and 54,050-. Weakness below these levels can extend the downtrend.
Overall, Bank Nifty is likely to trade within a defined range in the early session. A breakout on either side will set the trend for the day, and traders should maintain strict stop-losses with a focus on key levels

JSWENERGY Quarterly Breakout#jswenergy Strong Breakout and Sustaining strongly on Quarterly Chart.
Good to Hold for Swing, Short and Long-term #Investment.
Strong on Technical's.
Charts never Disappoint me !

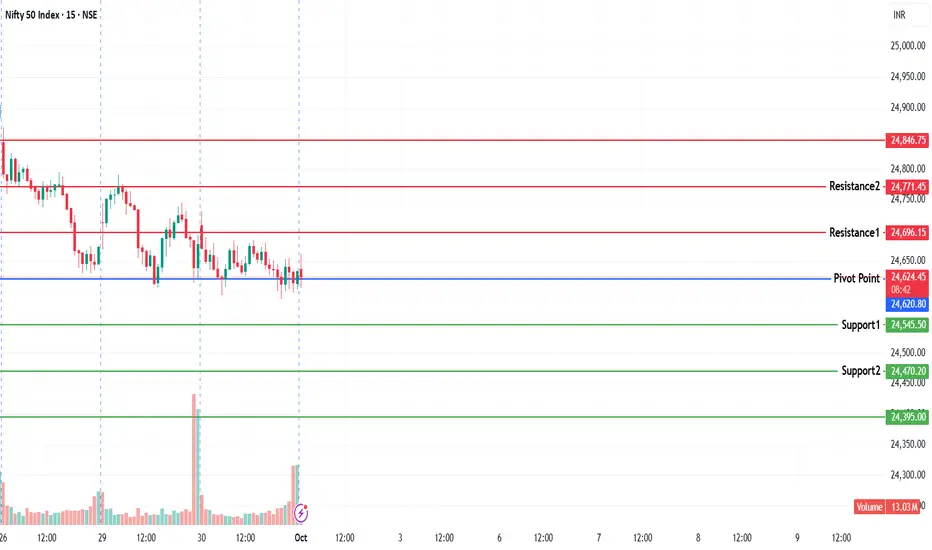
Accumulation in Nifty seen again! This is the 2nd straight session where NSE:NIFTY price closed below the day low but buyers’ volume was higher.
Red candle + green volume = a clear institutional accumulation footprint.
On top of that, the retailers index is going down, which confirms the view even more.
Normally, after yesterday’s strong buyers’ volume, we should have seen a bounce in the index today. But thanks to the weekly + monthly expiry, price was suppressed.
That suppression means one thing – the market can pop out anytime.
Remember the 3-step process I shared before:
1. Accumulation
2. Manipulation
3. Distribution (uptrend)
Right now we’re in the accumulation phase. A manipulation phase cannot be ruled out – it could come as a direct drop or a bounce with sell-on-rise characteristics. So, watch closely over the next 2–3 days.
Personally, I think from next week we’ll enter the 3rd phase – distribution or simply, the uptrend. Until then, accumulating dips whenever buyers’ volume is up is the right strategy. That’s exactly what I’m doing.
Now for tomorrow:
– Pivot is at 24644, PP is 0.13%
– If index opens above the pivot and holds on the hourly chart, we can see a sharp move to 24760 / 24880
– Downside support is at 24570
Sector-wise, PSU Banks and Metals are looking strong.
I’m holding NSE:HINDZINC and added NSE:REDINGTON today. I won’t be adding more until market breadth improves.
That’s all for today. Take care. Have a profitable tomorrow.
---
📊 Levels at a glance:
Pivot: 24644
Support: 24570
Resistance 1: 24760
Resistance 2: 24880
Pivot Percentile: 0.13% (sharp move possible)
Bias: Accumulation phase, buy dips on buyers’ volume uptick
Sectors to watch: NSE:CNXPSUBANK , NSE:CNXMETAL
NIFTY KEY LEVELS FOR 30.09.2025NIFTY KEY LEVELS FOR 30.09.2025
RTF: 3 Minutes
If the candle stays above the pivot point, it is considered a bullish bias; if it remains below, it indicates a bearish bias. Price may reverse near Resistance 1 or Support 1. If it moves further, the next potential reversal zone is near Resistance 2 or Support 2. If these levels are also broken, we can expect the trend.
When a support or resistance level is broken, it often reverses its role; a broken resistance becomes the new support, and a broken support becomes the new resistance.
If the range(R2-S2) is narrow, the market may become volatile or trend strongly. If the range is wide, the market is more likely to remain sideways
please like and share my idea if you find it helpful
📢 Disclaimer
I am not a SEBI-registered financial adviser.
The information, views, and ideas shared here are purely for educational and informational purposes only. They are not intended as investment advice or a recommendation to buy, sell, or hold any financial instruments.
Please consult with your SEBI-registered financial advisor before making any trading or investment decisions.
Trading and investing in the stock market involves risk, and you should do your own research and analysis. You are solely responsible for any decisions made based on this research.
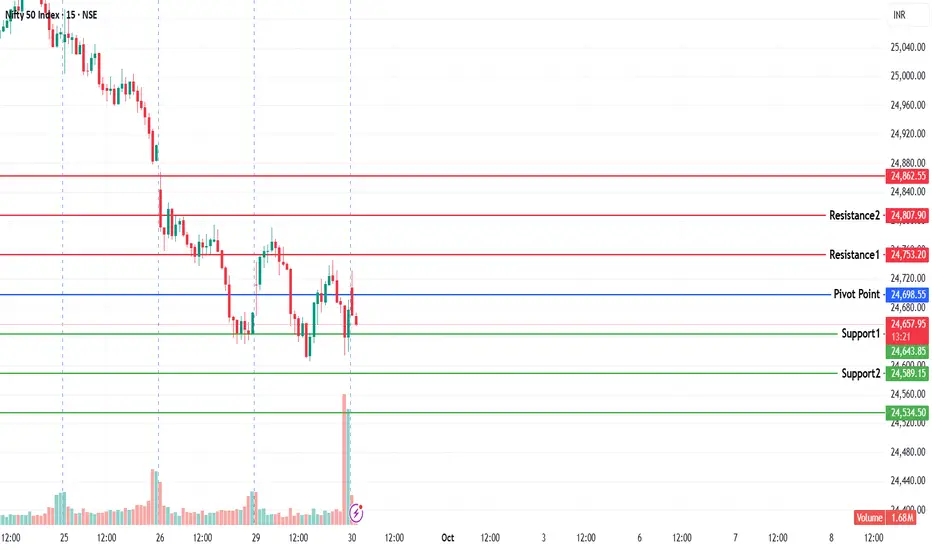
#NIFTY Intraday Support and Resistance Levels - 30/09/2025Nifty is likely to see a flat opening around the 24,700 zone, indicating indecision after the recent downtrend. The index is trading near a crucial support and resistance zone, suggesting that today’s session could remain range-bound with opportunities for both intraday buyers and sellers.
On the upside, a move above 24,750–24,800 can trigger a bounce toward 24,850, 24,900, and 24,950+. Sustaining above these levels may bring short-covering and provide momentum to bulls.
On the downside, a breakdown below 24,700 followed by weakness under 24,650–24,600 can drag the index lower toward 24,550 and 24,500-. If selling pressure increases, further downside cannot be ruled out.
Overall, Nifty is consolidating in a narrow range with sellers holding dominance. Traders should stay cautious, follow breakout levels, and manage risk with strict stop-losses.

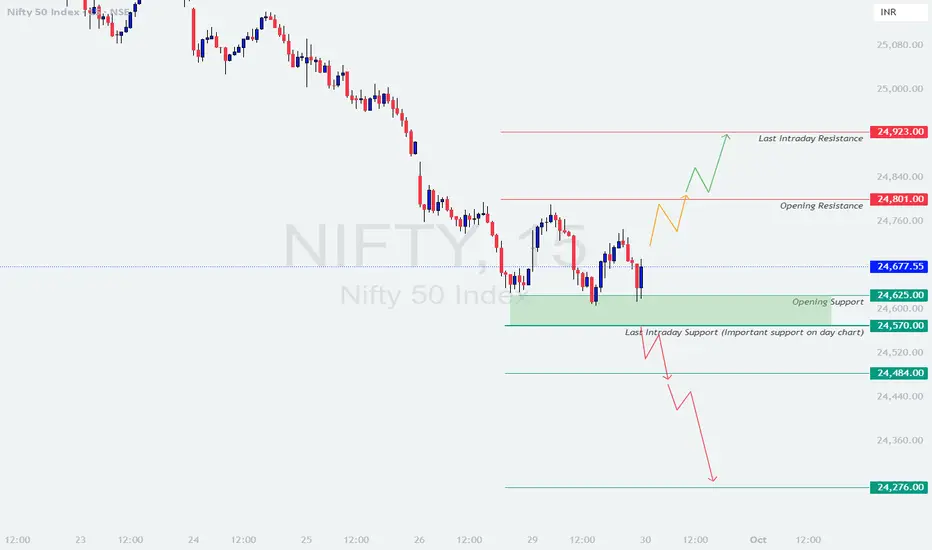
NIFTY : Trading levels and Plan for 30-09-2025NIFTY TRADING PLAN – 30-Sep-2025
Nifty closed at 24,677.55, recovering slightly after testing crucial supports. For tomorrow’s session, the index is positioned between 24,801 (Opening Resistance) and 24,570 (Last Intraday Support). These levels will be pivotal in shaping intraday moves.
📌 Key Levels to Watch:
Last Intraday Resistance: 24,923
Opening Resistance: 24,801
Current Market Level (CMP): 24,677
Opening Support: 24,625
Last Intraday Support (Crucial on daily chart): 24,570
Extended Support Levels: 24,484 → 24,276
🚀 Scenario 1: Gap Up Opening (100+ points)
If Nifty opens near 24,780 – 24,850, it will be very close to the Opening Resistance at 24,801 .
Sustained move above 24,801 may trigger bullish momentum, leading towards 24,923.
A breakout above 24,923 could extend gains towards 25,000+ zones, but traders must confirm strength with follow-up buying.
However, rejection around 24,801 – 24,923 may attract intraday profit booking, dragging Nifty back towards 24,700 – 24,625.
👉 Educational Note: Gap-ups tend to trap aggressive buyers if resistance zones are not broken decisively. Always wait for an hourly close above resistance before committing to fresh longs.
⚖️ Scenario 2: Flat Opening (within ±100 points)
A flat opening near 24,650 – 24,700 will likely keep Nifty in a consolidation phase.
On the upside, a push towards 24,801 needs to be watched closely. If crossed, 24,923 becomes the immediate target.
On the downside, failure to hold 24,625 will invite pressure towards 24,570.
Sustained weakness below 24,570 will likely lead to an extended decline towards 24,484 → 24,276.
👉 Educational Note: Flat openings usually indicate indecision. Such days often turn into range-bound markets until a breakout confirms direction.
📉 Scenario 3: Gap Down Opening (100+ points)
If Nifty opens around 24,550 – 24,500, it will be close to the Last Intraday Support at 24,570 .
A breakdown below 24,570 may extend the decline to 24,484, and if that fails to hold, next support lies at 24,276.
If 24,570 holds firmly, expect a rebound towards 24,625 → 24,700, driven by short covering.
Hourly close below 24,570 is the confirmation for a bearish continuation.
👉 Educational Note: Gap-downs often trigger panic selling in the first hour. Smart traders wait for support to be tested before entering trades to avoid false breakdowns.
🛡️ Risk Management Tips for Options Traders
⏳ Avoid aggressive trades in the first 15–30 mins; let the market settle.
🛑 Always place stop losses on a closing basis (15-min/hourly candle) .
🎯 Use option spreads (Bull Call / Bear Put) to minimize time decay.
⚖️ Stick to a 1:2 or higher risk-reward ratio .
💰 Book partial profits at key levels instead of waiting for extremes.
🧘 Maintain discipline—capital preservation is more important than chasing every move.
📌 Summary & Conclusion
Bullish Bias: Above 24,801 → 24,923, next target 25,000+.
Neutral Zone: Between 24,625 – 24,801, expect sideways consolidation.
Bearish Bias: Below 24,570, expect weakness towards 24,484 → 24,276.
📊 Nifty is trading in a tight band with critical support at 24,570 and resistance at 24,801. A decisive move beyond these levels will guide intraday momentum. Traders should stay patient and trade only on confirmation.
⚠️ Disclaimer: This trading plan is for educational purposes only. I am not a SEBI-registered analyst. Please do your own analysis or consult a financial advisor before making trading decisions.
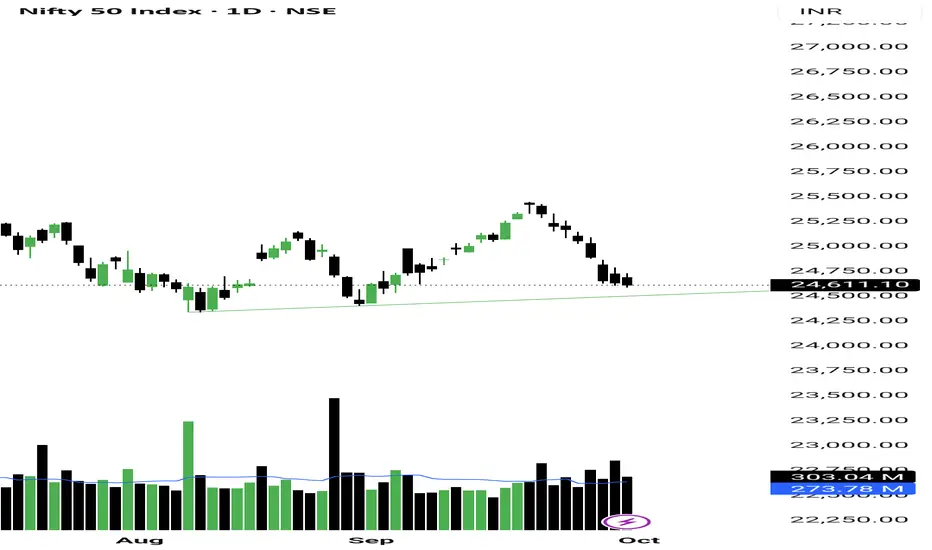
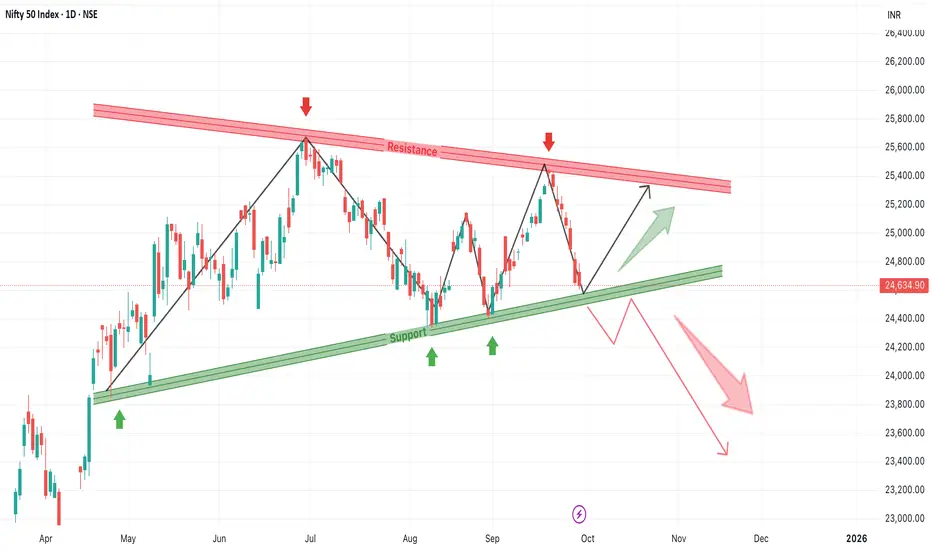
Nifty 50 – Triangle Structure Holding Critical Support ZoneThe daily chart of Nifty 50 shows a well-formed symmetrical triangle pattern. Price is currently hovering around the lower ascending trendline, which has acted as a strong support multiple times in the past. Market participants should closely monitor this zone as the next move will set the tone for October.
1. Symmetrical Triangle with Tightening Range
Nifty has been forming lower highs and higher lows since May, leading to the development of a large symmetrical triangle pattern. The converging trendlines indicate that volatility compression is taking place, often a precursor to a big breakout or breakdown move.
2. Support Zone Holding Around 24,600
Currently, the index is testing the crucial ascending support line, which has been respected at least 4 times in recent months (as shown by green arrows). A bounce from here would indicate continued buyer interest and maintain the bullish structure intact.
3. Upside Scenario – Reversal from Support
If Nifty manages to hold above this support zone and begins a reversal, we can expect a relief rally toward the falling resistance trendline. This could lead to a price retest near 25,300–25,400, which is also the previous swing high. A clean breakout above this zone could trigger a new upward trend.
4. Downside Scenario – Breakdown Below Support
On the contrary, if price breaks and closes below the 24,600 support zone, it may trigger panic selling. The chart indicates a large red arrow projection in this case, suggesting a move toward the 23,800–23,400 zone initially. A breakdown from symmetrical triangles often results in sharp directional moves.
5. Risk Management Is Critical
At this stage, traders must stay non-directional and reactive rather than anticipatory. Wait for either a confirmation bounce from support or a clear breakdown. False moves are common near the apex of a triangle. Risk should be tightly managed with stop-losses below support for long positions, and above resistance for short positions.
6. Pattern Psychology – Buyers vs Sellers at War
This pattern is a classic indecision structure, where neither bulls nor bears are in full control. The resolution from this zone will reflect market sentiment for Q4 2025. Keep an eye on macro triggers, earnings season, or global cues, which could act as catalysts for the next breakout or breakdown.
Nifty is ready for 26000We are expecting Nifty to reverse from the important demand zone of 25050.
After the reversal, we can expect Nifty to reach above 26000. RSI is also indicating the reversal signal on the 30-minute timeframe.

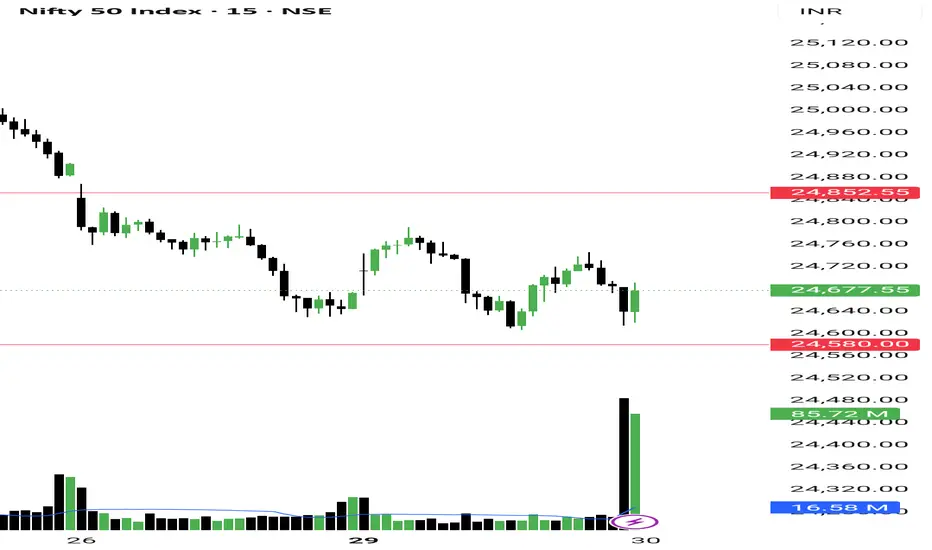
Nifty Down but Buyers Volume is Back! So as we studied, NSE:NIFTY gave a chance to Sell-on-Rise. The index went up to the day high and then dropped.
But here’s the interesting part – even though price fell, the candle closed red, and it ended below Friday’s low, the buyers’ volume was still higher by 60 million.
That’s a classic sign of accumulation!
So yes, I’ve entered the first batch of index longs. Even if it dips further, I’ll be accumulating more.
Now let’s check the data for tomorrow:
- Pivot is now at 24677, and PP is 0.17
- Retail index down but buyers’ volume up = classic sign of institutional accumulation!
My plan for tomorrow is simple – I’ll add more to the longs I bought today if Nifty opens above the pivot.
The upside target is resistance at 24850.
Support is at 24580.
On the equity side – yes, we saw a sell-off on Friday and swing supports were broken. But today, stocks didn’t get any strong follow-up. I see this as manipulation and liquidity grabbing.
That’s why I didn’t sell anything yet. In fact, I’ve added more to my holdings – NSE:KROSS and NSE:HINDZINC .
For tomorrow, I’ll be focusing on #Commodity sector. And from now on, I’ll also start hunting for my Earning Pivot setups since quarterly results are here.
That’s all for the day. Take care and have a profitable tomorrow.
---
📊 Levels at a glance:
Pivot: 24677
Support: 24580
Resistance: 24850
Pivot Percentile: 0.17 (supports accumulation view)
Bias: Long buildup, add more if above pivot
Sectors to watch: Commodities, Earnings Pivot setups
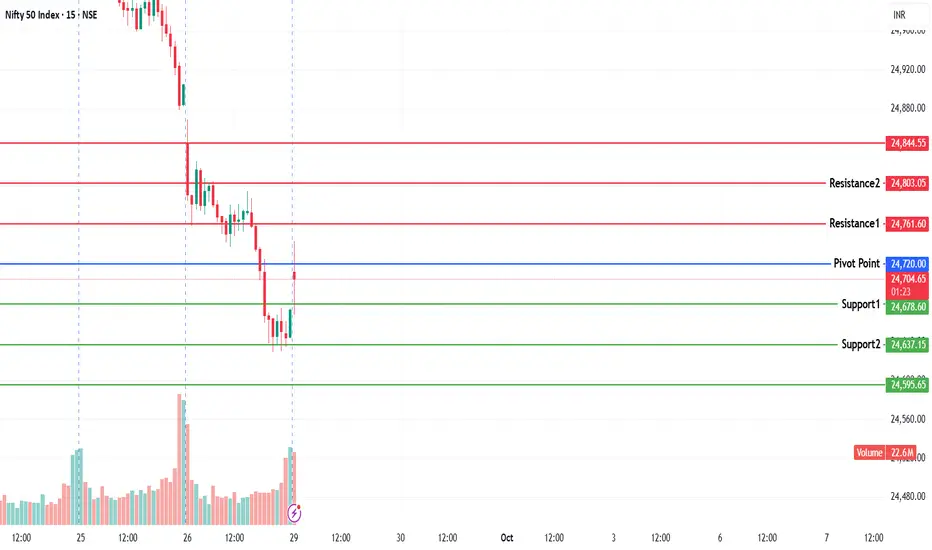
NIFTY KEY LEVELS FOR 29.09.2025NIFTY KEY LEVELS FOR 29.09.2025
RTF: 3 Minutes
If the candle stays above the pivot point, it is considered a bullish bias; if it remains below, it indicates a bearish bias. Price may reverse near Resistance 1 or Support 1. If it moves further, the next potential reversal zone is near Resistance 2 or Support 2. If these levels are also broken, we can expect the trend.
When a support or resistance level is broken, it often reverses its role; a broken resistance becomes the new support, and a broken support becomes the new resistance.
If the range(R2-S2) is narrow, the market may become volatile or trend strongly. If the range is wide, the market is more likely to remain sideways
please like and share my idea if you find it helpful
📢 Disclaimer
I am not a SEBI-registered financial adviser.
The information, views, and ideas shared here are purely for educational and informational purposes only. They are not intended as investment advice or a recommendation to buy, sell, or hold any financial instruments.
Please consult with your SEBI-registered financial advisor before making any trading or investment decisions.
Trading and investing in the stock market involves risk, and you should do your own research and analysis. You are solely responsible for any decisions made based on this research.
#NIFTY Intraday Support and Resistance Levels - 29/09/2025Nifty is expected to open around the 24,750 zone today, which is a crucial resistance area after the recent downtrend. If the index sustains above 24,750–24,800, then a small relief rally could be seen toward 24,850, 24,900, and 24,950+. However, this upside may remain limited as the broader structure is still weak.
On the downside, if Nifty slips below 24,700, selling pressure may resume, dragging the index toward 24,600, 24,550, and 24,500-. This indicates that the index is still in a corrective phase, and unless a strong breakout is seen, rallies could face selling at higher levels. Traders should be cautious near 24,750 resistance and manage trades with strict stop-losses, favoring short setups on breakdowns for safer opportunities.