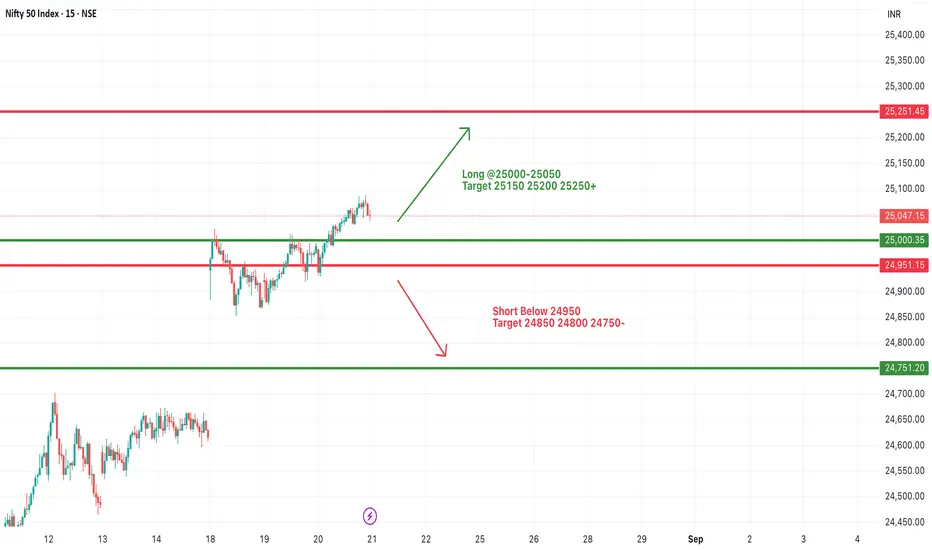
#NIFTY Intraday Support and Resistance Levels - 21/08/2025For today’s session, Nifty is likely to witness a slightly gap-up opening around the 251,00 mark, indicating a positive start. The 25,000–25,050 zone will be crucial for intraday traders as sustaining above this level could extend the upward momentum. If Nifty manages to hold and trade firmly above this zone, upside targets are seen at 25,150, 25,200, and 25,250+, which could further strengthen the bullish sentiment.
On the other hand, if Nifty slips below 24,950, a reversal short opportunity may emerge, leading to downside targets at 24,850, 24,800, and 24,750. This will act as a key support area, and breaking it may trigger further weakness.
Overall, the day’s bias remains cautiously positive with a gap-up start, but traders should keep a close watch on the 25,000 pivot zone for clear intraday direction. A strict stop-loss and disciplined approach is essential as Nifty is trading near crucial breakout and reversal levels.
Niftyprediction
Market breadth improved. Positive Nifty. So as we analysed yesterday – NSE:NIFTY gave a good move today. The higher buyers’ volume from yesterday reflected well and the index managed to close above the critical resistance of 25000.
But here’s the catch – even with such a strong closing, there’s no sign of fresh buying in Nifty. Today’s move was mostly due to short covering.
If we look at the data, most of the buying in the market is coming from retailers’ SIP flows. Mutual funds are doing the bulk of the buying, while FIIs continue to short and remain heavily bearish on Index Futures.
The good part is – all that FII selling is being absorbed by DIIs.
Now let’s talk about tomorrow's market view:
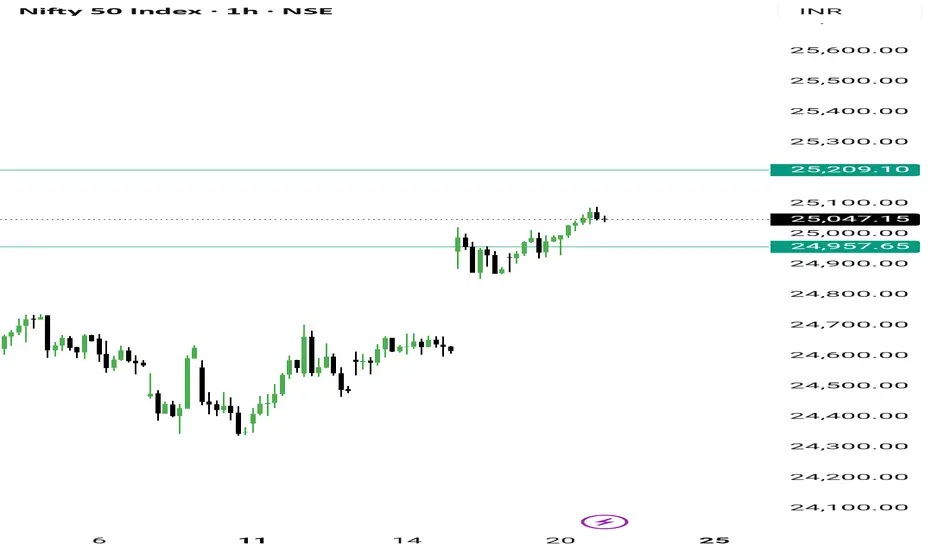
Nifty’s pivot has moved slightly higher to 25023 – that’s a positive sign. Pivot percentile is tight at 0.11%, which usually signals that a sharp move is coming.
Buyers also beat sellers by 41 million in volume – again, a good signal.
So tomorrow, two scenarios to watch:
1. If the market opens above the pivot and sustains, a sharp move can come.
2. If it touches support at 24950, bounces back, and sustains above the pivot for an hour – then also a sharp upside is likely.
But remember, if Nifty opens below the pivot and stays under 25009, we could see a quick downside spike. Since tomorrow is expiry, I’m keeping both possibilities in mind.
That said, my view remains bullish. If any opposite move comes, I’ll treat it as a buying opportunity – no need to panic.
Next resistance is at 25222 and support is at 24950. Market breadth is also positive.
NSE:BANKNIFTY is facing resistance at 56098. Only a break above this can give momentum. One point to note – sellers’ volume in BankNifty was 5 million higher than buyers today, so keep that in mind for tomorrow.
On the sectoral side – NSE:CNXFINANCE and Fertilizers look good for tomorrow. And IT – like I mentioned earlier – when the market bounces, NSE:CNXIT will be the first to move up with strength. It’s already performing well, so keep a close watch there.
How my recent trades performed today:
1. NSE:OLAELEC up 18.69% 🚀
2. #ANTHEM gave 4%+ intraday
3. NSE:GODFRYPHLP up 12.83%
4. #SWIGGY up 2.77%
That’s it for today. Take care and have a profitable tomorrow.
Nifty AnalysisThis is Nifty Analysis for Thursday 21st Aug 2025. Its Weekly Expiry day and may be volatile. Option buyers need to be cautious and safe traders may avoid this day.
Nifty formed a bullish candle and moved up by 0.28% on Wednesday. Nifty is above short term EMAs in Daily timeframe, but is around resistance and psychological level 25,000. This strategy is a risky one.
Trade Strategy 1: Enter Long position (Call Option) after retracement confirmation around previous day low - around 24,930. Stoploss just below 24,850. Target 1 just below previous day close 25,038. This gives 1 is to 1.5 risk reward ratio. Target 2 around previous day high 25,088. This gives 1 is to 2 risk reward ratio.
Safe traders may consider Trailing Stoploss after 1 is to 1 risk reward ratio is achieved.
Note - This is for educational purposes only and not a trade recommendation. I am not SEBI registered. Kindly do your own research before doing any financial transaction.

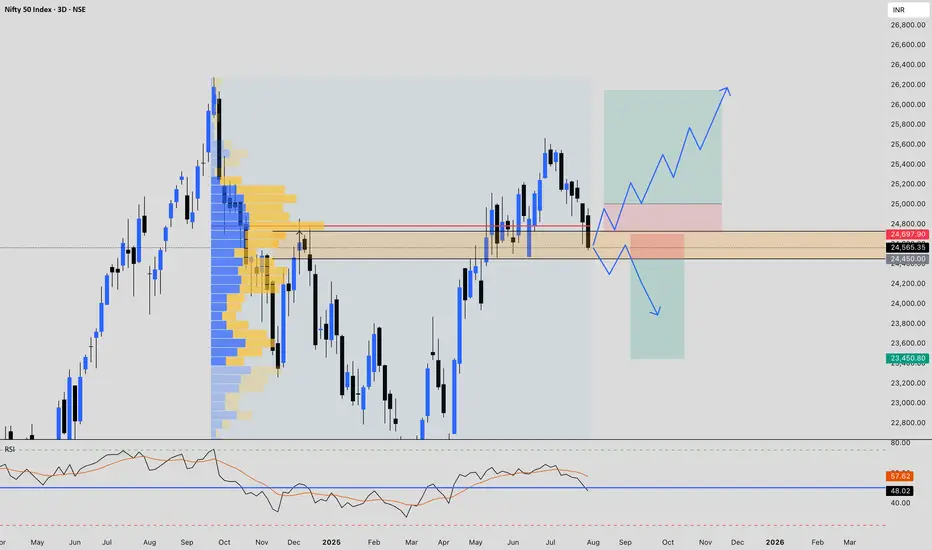
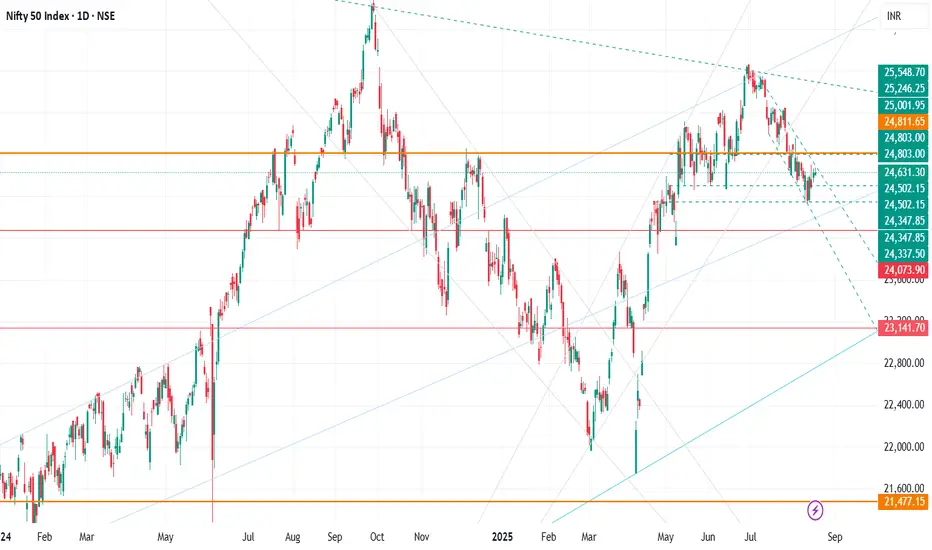
NIFTY: Expectation for August Month | Bounce Back or Crash?⚡️Price Analysis:
- If nifty is able to re-claim the 25000 zone within next week (8th Aug, 25) then a New ATH can be expected by the end of this year.
- But, price continues to show weakness then further downside and consolidation will be expected around the lower levels.
- Bullish view can be made if price starts to show good reaction from the currently marked golden zone.
- Bearish view below 24450 only after confirmation.
- Either side good momentum can be expected in coming days.
⚠️ Disclaimer: This is NOT a buy/sell recommendation. This post is meant for learning purposes only. Views are personal. Please, do your due diligence before investing.⚠️
💬 Share your thoughts in the comments below! ✌️
🔥 Trade Safe! ✅ 🚀
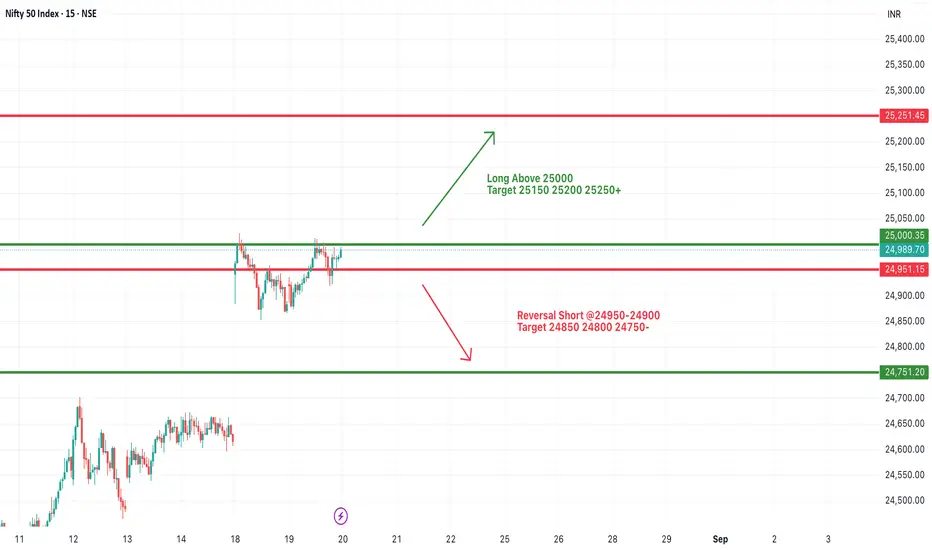
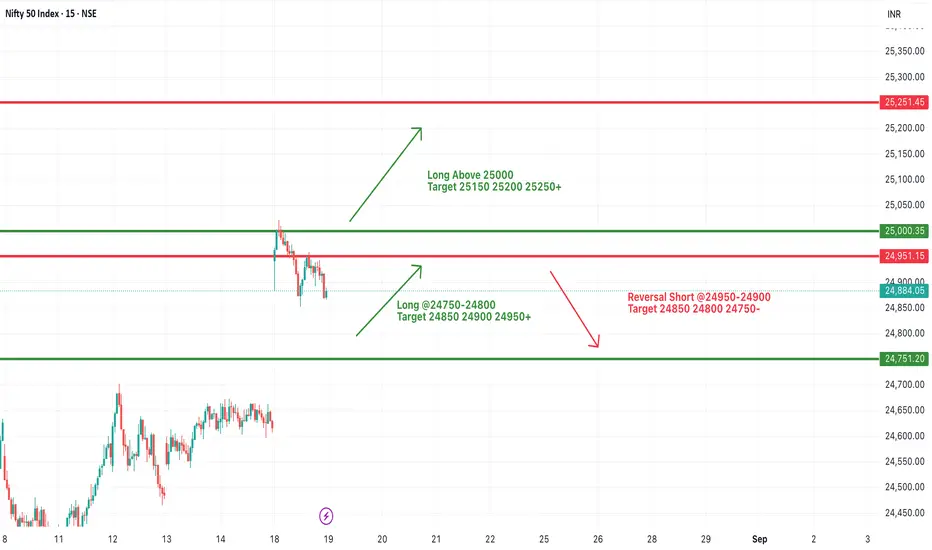
#NIFTY Intraday Support and Resistance Levels - 20/08/2025Nifty is expected to open on a flat note around the 25,000 level, which will act as a crucial pivot for intraday direction. If the index sustains above the 25,000 mark after the opening, we can expect a positive momentum to build up, leading towards the upside targets of 25,150, 25,200, and 25,250+. A sustained breakout and follow-up buying above 25,250 could further strengthen the bullish sentiment for the short term.
On the contrary, if Nifty fails to hold above 25,000 and starts trading below 24,950–24,900, then a reversal short setup may get activated. In such a case, downside levels of 24,850, 24,800, and 24,750 could be tested, and weakness may extend further if selling pressure increases.
Overall, the 25,000 zone will act as the key decision point for today’s session. Traders should closely monitor price action around this level and trade with strict stop-losses to manage risk effectively.
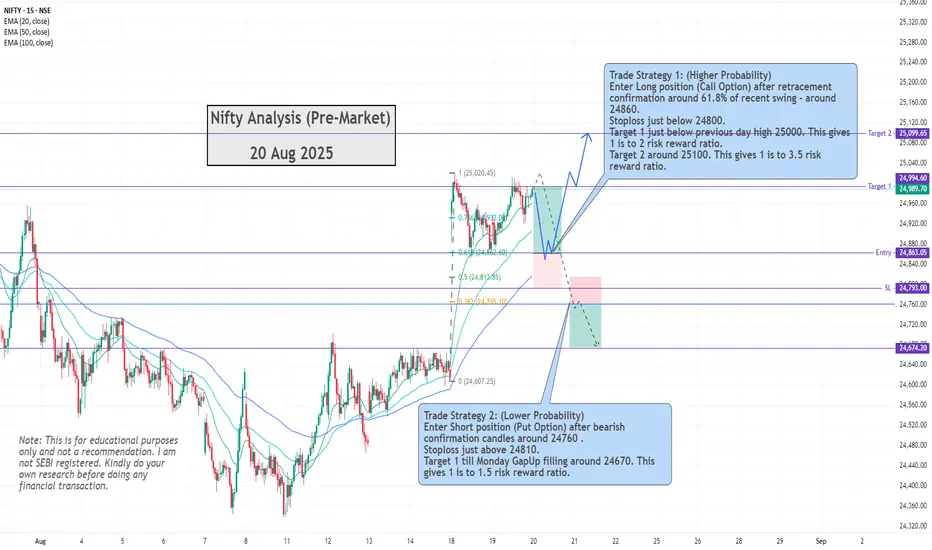
Nifty AnalysisThis is Nifty Analysis for Wednesday 20th Aug 2025.
Nifty formed a bullish candle and moved up by 0.4% on Tuesday. Nifty is above short term EMAs in Daily timeframe, but is near immediate resistance and psychological level 25,000. Though short term Technicals indicate bullishness, wait for a pullback and enter trade. These 2 strategies may work best for Tuesday.
Trade Strategy 1: (Higher Probability)
Enter Long position (Call Option) after retracement confirmation around 61.8% of recent swing - around 24,860. Stoploss just below 24,800. Target 1 just below previous day high 25,000. This gives 1 is to 2 risk reward ratio. Target 2 is around 25100. This gives 1 is to 3.5 risk reward ratio.
Trade Strategy 2: (Lower Probability)
Enter Short position (Put Option) after bearish confirmation candles around 24,760 . Stoploss just above 24,810. Target 1 till Monday Gap Up filling around 24,670. This gives 1 is to 1.5 risk reward ratio.
Safe traders may consider Trailing Stoploss after 1 is to 1 risk reward ratio is achieved.
Note: This is for educational purposes only and not a trade recommendation. I am not SEBI registered. Kindly do your own research before doing any financial transaction.
#NIFTY Intraday Support and Resistance Levels - 19/08/2025Nifty is expected to open with a gap-up today, reflecting positive sentiment in the market. If the index sustains above the 24,750–24,800 zone, fresh upside momentum can take it towards 24,850, 24,900, and 24,950+. A strong breakout above the 25,000 level may open the path for further targets at 25,150, 25,200, and 25,250+.
On the flip side, if Nifty faces rejection near 24,950–24,900, a reversal short opportunity may emerge, dragging it back towards 24,850, 24,800, and possibly 24,750-.
Overall, the bias remains positive with a gap-up start, but traders should keep a close eye on the 24,950–25,000 resistance zone for possible reversals.
A dip is possible in Nifty but will be Buyable So just like we expected a sharp move, it came in the form of a big Gap Up today.
But as I had mentioned, sellers volume was heavier than buyers, and that clearly reflected – NSE:NIFTY slipped from the day high and even closed below the open.
Because of today’s Gap Up, the Pivot distance has widened and is now at 24917. Pivot percentile is 0.16%.
Today’s candle is a squat one, but buyers volume is still higher than sellers by over 37 million.
And like I said earlier, a shakeout was clearly visible on the chart and ideally, a sharp move should have come after that. But the opposite happened.
Which makes me believe that the shakeout is still pending.
Second thing, after breaking 24470 support, Nifty should have taken the next support around 24200, but without taking support it just moved up.
So in short, a dip is still possible.
My view: A pullback with a bullish undertone. Meaning Nifty may see some dip, but individual stocks can still perform well.
For this week, Nifty support is 24650 and resistance is 25000.
NSE:BANKNIFTY also has a pending shakeout. Support is at 55360. But we are seeing some traction in PSU and private banks.
Talking about sectors – #Auto and #Cement look good technically. Keep an eye there.
My recent trades performance:
1. HEROMOTOCO +5.86%
2. UNOMINDA +6.13%
3. NSE:MARUTI fresh high with +8.75% upside
4. NSE:HYUNDAI +8.15%
5. DMART +4.58%
That’s all for today. Take care and have a profitable tomorrow.
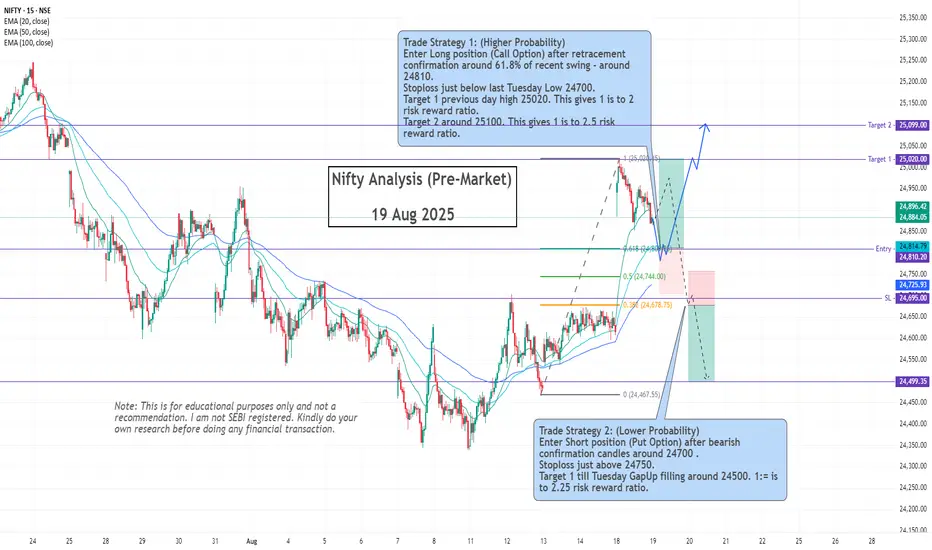
Nifty AnalysisThis is Nifty Analysis for Tuesday 19th Aug 2025.
Nifty opened Gap Up and moved up by 1% on Monday due to the new events (GST, Rating Upgrade). Nifty formed a red candle but has higher high and higher Low formation. It is above short term EMAs in Daily timeframe.
These 2 strategies may work best for Tuesday.
Trade Strategy 1: (Higher Probability)
Enter Long position (Call Option) after retracement confirmation around 61.8% of recent swing - around 24,810. Stoploss just below last Tuesday Low 24,700.
Target 1 previous day high 25,020. This gives 1 is to 2 risk reward ratio. Target 2 around 25,100. This gives 1 is to 2.5 risk reward ratio.
Trade Strategy 2: (Lower Probability)
Enter Short position (Put Option) after bearish confirmation candles around 24,700 . Stoploss just above 24,750. Target 1 till Tuesday Gap Up filling around 24,500. This gives 1 is to 2.25 risk reward ratio.
Safe traders may consider Trailing Stoploss after 1 is to 1 risk reward ratio is achieved.
Note: This is for educational purposes only and not a trade recommendation. I am not SEBI registered. Kindly do your own research before doing any financial transaction.
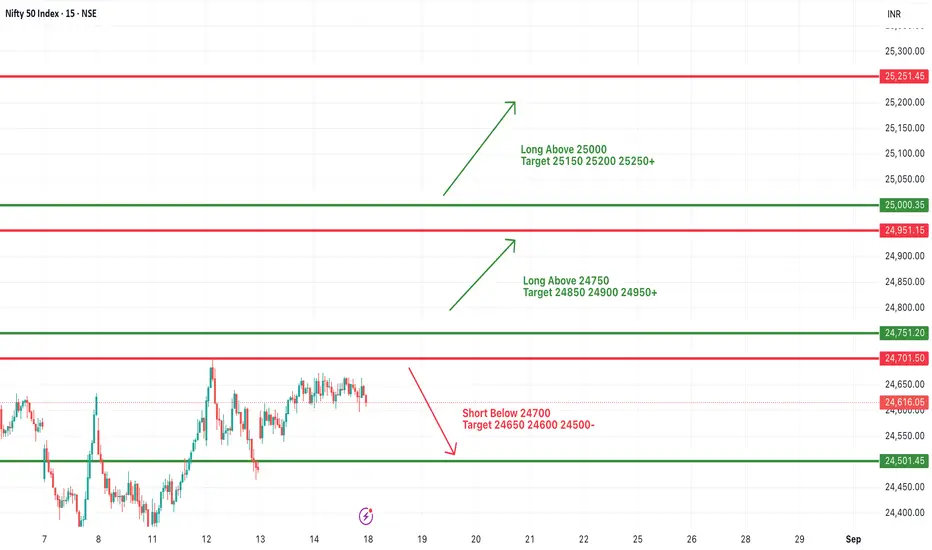
#NIFTY Intraday Support and Resistance Levels - 18/08/2025Nifty is likely to open with a gap-up above the 24,750 level, indicating bullish momentum at the start of the session. If the index sustains above this level, further upside movement towards 24,850, 24,900, and 24,950+ can be expected. A strong breakout above 25,000 could extend the rally towards 25,150, 25,200, and 25,250+.
On the downside, immediate support lies near 24,700, and a break below 24,700 may lead to some profit booking, dragging the index towards 24,650, 24,600, and 24,500-. However, as long as Nifty trades above 24,750, the bias remains positive with dips likely to be bought into.
Overall, the sentiment is bullish, and traders should trail their stop losses while riding the upside move.
A dip will be buying opportunity in Nifty So on Thursday I was expecting a sharp move, but NSE:NIFTY just gave a small bounce and stopped. Still, it managed an upmove which was good to see.
Because of this, Nifty’s pivot shifted slightly higher to 24634 and the pivot percentile has tightened a lot – now at just 0.1%.
In such a setup, the market can open with a strong gap up, or if it opens above the pivot point, then a sharp move can be expected.
But there is a concern – on Thursday sellers were heavy with 22 million volume against buyers. This can reflect tomorrow and we might see a shakeout.
Support is placed at 24533 and resistance at 24700.
My view – bullish. If there’s any dip within this support-resistance range, I’ll consider it as a buying opportunity.
NSE:BANKNIFTY also looks ready with support at 55011.
Talking about sectors, #Financial stocks should be on the radar.
I'm holding NSE:UNOMINDA , NSE:CAPLIPOINT NSE:ATHERENERG , AND NSE:RELIANCE
That’s all for today. Take care. Have a profitable week ahead.

Nifty Trend on Daily Charts - Sideways PatternNifty is Trading in A channel downwards, Where it meet these levels as-
S1- 24530
S2- 24460
R1 - 24710
R2- 24820
Market trend nutral, sideways pattern for 5-6 sessions.
Note & Disclaimer -
I am not a SEBI registered advisor. The above data is for informational purposes only and not a recommendation to buy or sell.
Always conduct your own due diligence (DYOR) and consult with a SEBI-registered advisor before making any trading or investment decisions.
14 Aug 2025 - Change of stance on Nifty at 24500 levelsNifty Stance Bullish 🐂
Nifty changed its stance from bearish to bullish on 12th August, Tuesday. If you are following me on Trading view, you would have got the email once this EMA crossover happened. Interestingly, Nifty made this reversal after a decent trend of 473 points.
Even though the reversal came, Nifty is still unable to break out from the resistance level of 24620. We are still hovering around 40 points away from the last crossover signal at 24580.
US markets, which are hitting a new high every day, compare this to our markets, which are tired and lacking momentum. We might need fresh triggers to escape from these levels and the US-India trade deal could be a big reason.
A possible trigger could be either a monetary policy relaxation (reduction of repo rates) or a fiscal policy relaxation (decrease in taxes) to boost production/consumption. We cannot reduce our repo rates, as the current 5.5% rate is only 1% higher than the US Fed rate of 4.5%. If we reduce our repo further, our debt and money market will crash, which points us to the only option of a tax cut.

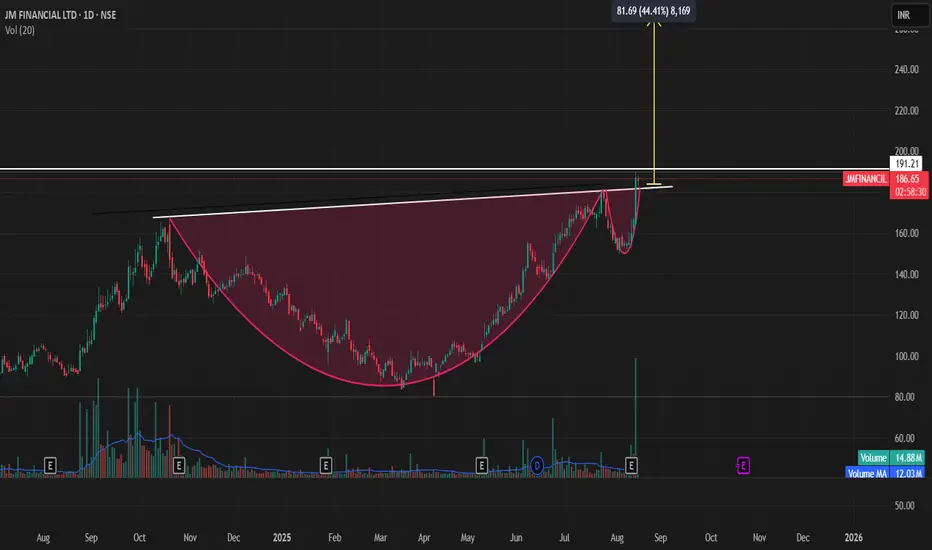
JM Financial is forming a perfect Cup and Handle pattern
**JM Financial** is forming a **perfect Cup and Handle pattern**. A **buying opportunity** may emerge if the stock **opens and closes above ₹190**.
**Current Market Price (CMP): ₹186**
**Target: ₹257**
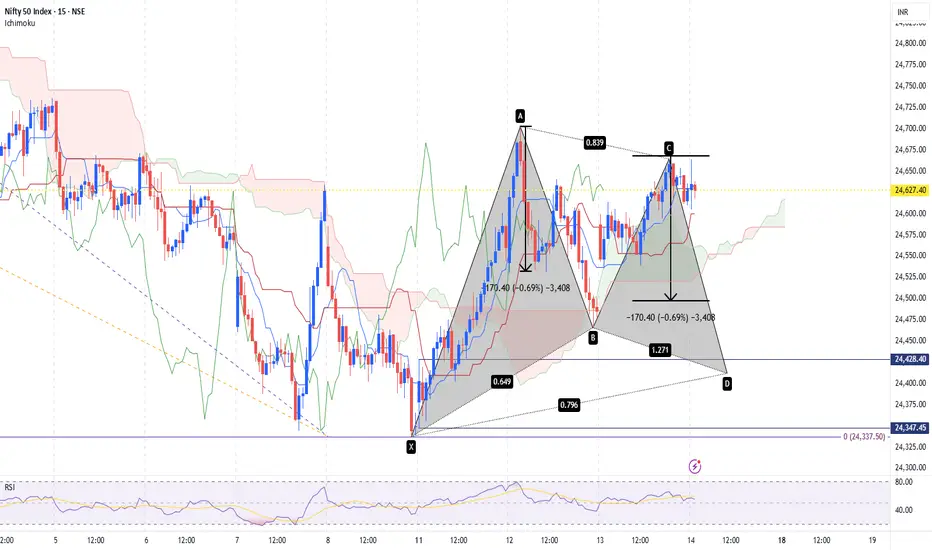
Nifty Viewusing Two Step Fibo strategy, gartley in other words
combining with symmetric price concept
eyeing for 2 target levels
1 - 24500
2 - 24400
lets wait n watch price action
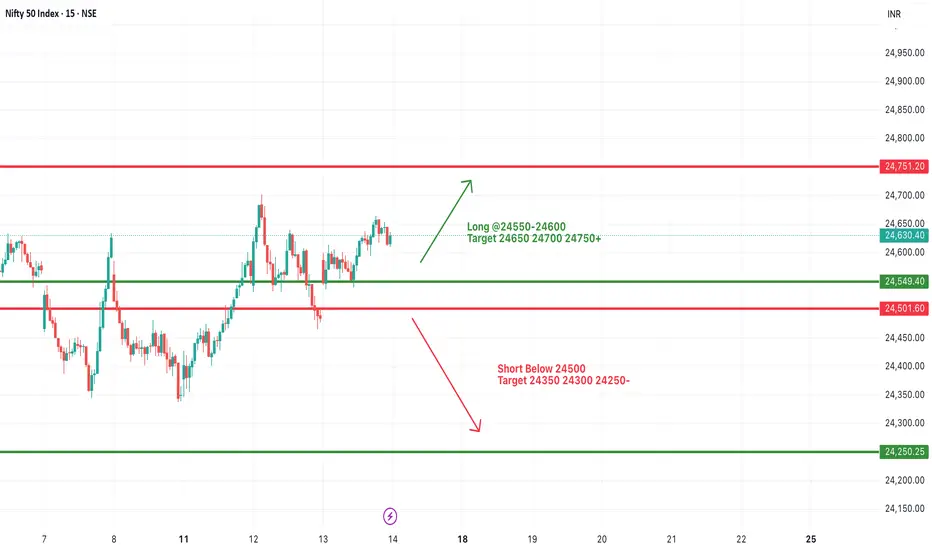
#NIFTY Intraday Support and Resistance Levels - 14/08/2025Nifty is expected to open slightly gap-down today, indicating a cautious start to the session. The immediate support lies around 24,550–24,500, which will be a key zone to watch. A sustained break below this zone could accelerate selling pressure, dragging the index toward 24,350, 24,300, and further down to 24,250-.
On the upside, if Nifty manages to hold above the 24,550–24,600 range, buying interest may emerge, pushing it toward 24,650, 24,700, and 24,750+. The overall sentiment remains neutral-to-cautious, and price action near 24,550 will likely dictate the intraday trend. Traders should focus on quick, well-timed trades with strict stop losses, as volatility around the key levels may lead to sudden reversals.
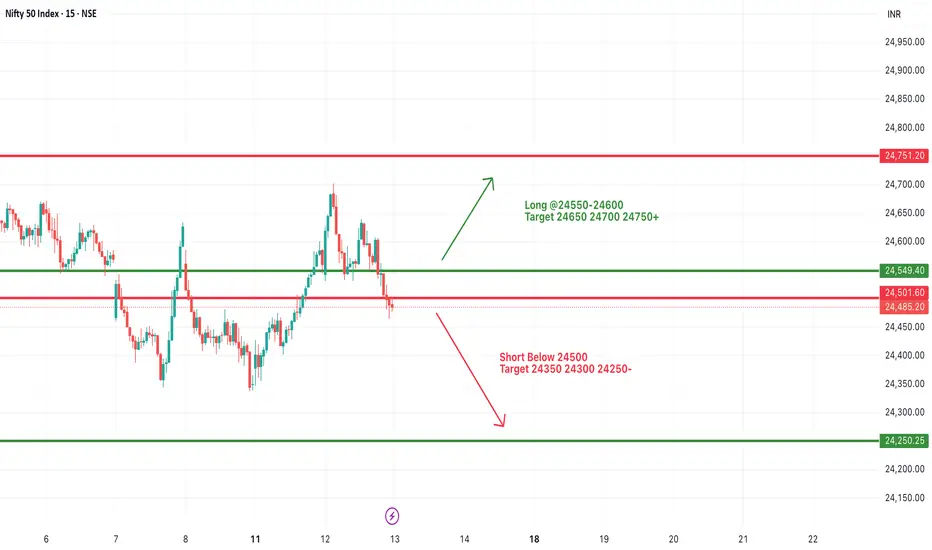
#NIFTY Intraday Support and Resistance Levels - 13/08/2025Nifty is likely to witness a gap-up opening today, indicating a positive start to the session. The 24,550–24,600 zone will act as a crucial breakout area. Sustaining above this range could trigger further bullish momentum, with upside targets at 24,650, 24,700, and 24,750+. A strong close above 24,750 may even extend gains further in the coming sessions.
However, if Nifty fails to hold above 24,550 and slips below 24,500, weakness could set in, opening the path towards 24,350, 24,300, and 24,250-. This makes the 24,550 mark a key pivot point for deciding the intraday bias. Traders should focus on price action around these levels and maintain strict stop losses to manage risk effectively.
August 13, 2025 trading plan prediction for tomorrow24,728 –
Above: 10m closing → Short Cover Zone.
Below: 10m hold PE → Safe Zone for Puts.
24,628 –
Above: 10m hold CE → Entry Level for Calls.
Below: 10m hold PE → Risky Zone for Puts.
24,528 –
Above: Positive trade bias.
Below: Negative trade bias.
24,428 –
Above Opening S1: 10m hold CE → Bullish bias.
Below Opening R1: 10m hold PE → Bearish bias.
24,330 –
Above: 10m hold CE → Buy Level for Calls.
Below: 10m hold PE → Sell Level for Puts.
24,210 –
Above: 10m hold CE → Safe Zone for Calls.
Below: 10m hold → Unwinding Level.
24,173 –
Day UP Fibonacci Support 0.382.

Nifty swing Pullback Failure 15mins Hello,
Nifty again bounce from previous low/support levels of 24350 to high of 24700 and pullback is failed and falled again CMP 24510 ......50SMA support and RSI adjusted from overbought also more than 50% retracement near by 61% reatrce making it good Pullback Reversal Set up for swing+postional

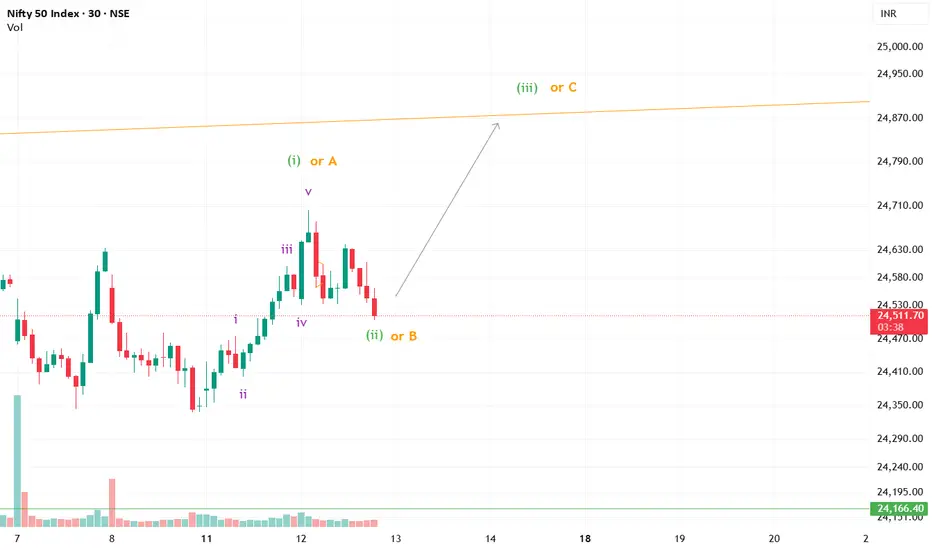
Nifty Elliott Wave Setup Points to Next Bullish LegNifty may be completing Wave (ii) or B, with a strong Wave (iii) or C rally likely ahead.
NIFTY Analysis 12 AUGUST, 2025 ,Morning update at 9 ami am going out of india for 20 days ,today is my last update ,
Bullish Move
if Sustain above 24693 possible rally towards 24799
If Bn pattern appears on 5M chart high probability of short covering
Extended target to 24906 if momentum strong.
Bearish Move
Fail to hold above 24632 possible slip to 24520.
If 24520 breaks, next support will be 24445 and 24358.
Sideways
Price oscillates between 24632–24693 without breakout.
Low probability moves, better for quick scalps

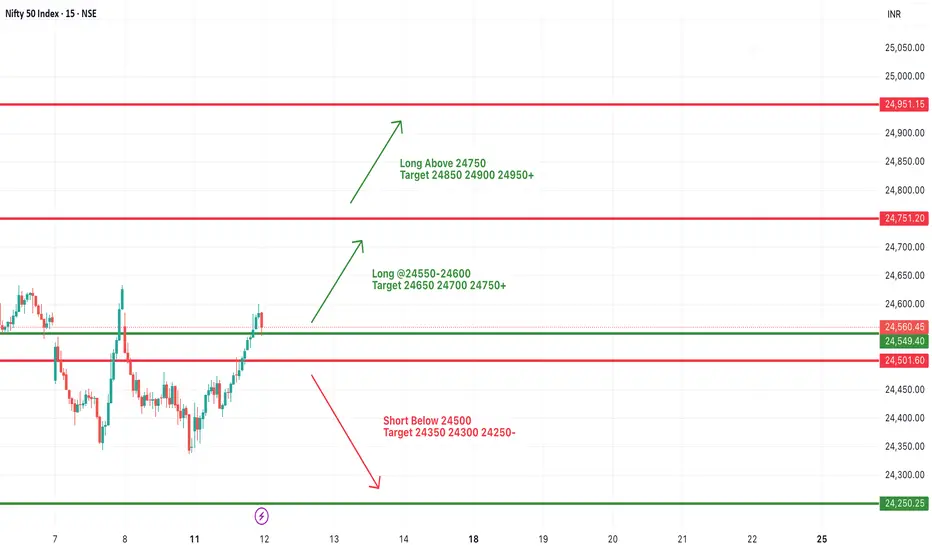
#NIFTY Intraday Support and Resistance Levels - 12/08/2025Nifty is expected to open with a gap-up, indicating early bullish sentiment. If it sustains above 24,550–24,600, upside targets could be 24,650, 24,700, and 24,750+. A further breakout above 24,750 may push prices toward 24,850, 24,900, and 24,950+.
On the downside, weakness may develop only if Nifty slips below 24,500, which could lead to targets at 24,350, 24,300, and 24,250-. Price movement around the 24,550 level will be key for deciding intraday momentum, so traders should wait for a clear breakout or breakdown confirmation with proper stop-losses.
12 August 2025 Nifty50 brekout and Breakdown leval1. Bullish Trade Plan (Call Side – CE)
Above 24,818 →
Strong upside breakout. Expect short covering rally; positional traders may hold CE.
Above 24,718 →
CE entry zone for swing/positional buying. Targets can be 24,818+ with trailing SL below 24,650.
Above 24,650 →
Market bias turns positive; intraday momentum likely to stay bullish. Can scalp CE with strict SL.
Above 24,432 (Opening S1) →
CE buy zone for intraday. Use for quick trades if supported by volume.
Above 24,350 →
CE buy trigger; minor bullish push possible. Keep SL just below level.
Above 24,220 →
CE safe zone; market sentiment remains positive unless price falls back below.
2. Bearish Trade Plan (Put Side – PE)
Below 24,818 →
First sign of weakness if rejection happens here; safe PE zone starts.
Below 24,718 →
Risky PE zone; may lead to quick downside movement if selling pressure builds.
Below 24,600 →
Intraday negative trade view; bears get control.
Below 24,400 (Opening R1) →
PE buy trigger for intraday shorts.
Below 24,330 →
Clear downside intraday setup; scalpers can enter PE with SL above level.
Below 24,200 →
Safe zone for PE; trend likely to continue down.
Below 24,170 →
Unwinding zone; fall may accelerate quickly to next supports.
