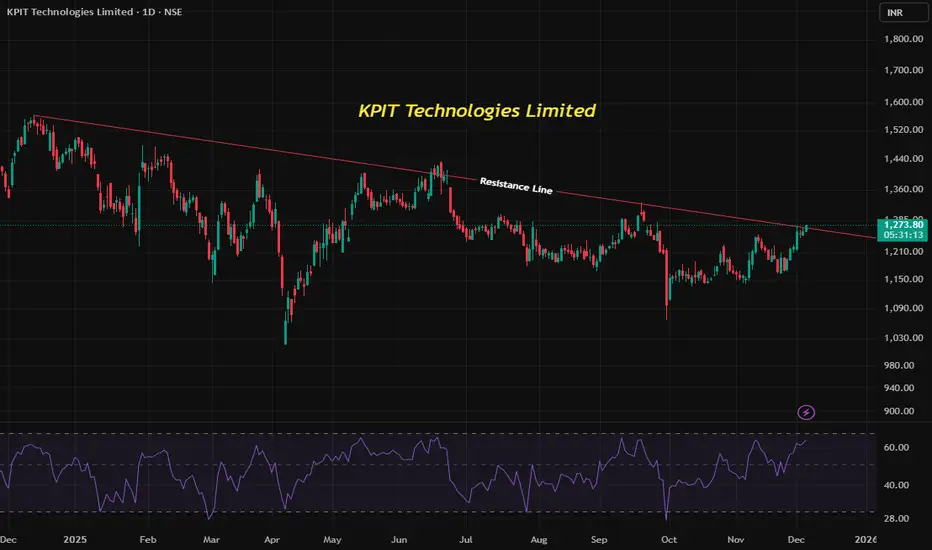
KPIT Technologies Downtrend Reversal with RSI ConfirmationKPIT Technologies Ltd is currently trading near ₹1271 on the daily chart. The stock has been in a downtrend, forming lower highs and lower lows, but is now attempting a trend reversal by breaking out of its downtrend line. Alongside this, the RSI indicator has moved above 50, signaling renewed buying strength. Let’s break down these concepts and understand the current opportunity.
🔹 Understanding the Downtrend Pattern
1. Downtrend Definition: A downtrend is characterized by a sequence of lower highs and lower lows, showing persistent selling pressure.
2. Trendline Role: Traders often draw a descending trendline connecting the highs. As long as price stays below this line, the downtrend remains intact.
3. Reversal Signal: When price breaks above the downtrend line, it suggests that sellers are losing control and buyers may be taking over.
4. KPIT Example: The breakout above its downtrend line indicates a potential shift from bearish to bullish sentiment.
🔹 RSI Indicator as Momentum Confirmation
Relative Strength Index (RSI): A momentum oscillator ranging from 0–100.
Key Levels:
Below 50 → bearish momentum
Above 50 → bullish momentum
Why It Matters: RSI crossing above 50 often confirms that buying activity is strengthening.
KPIT Example: RSI moving above 50 supports the breakout, adding conviction that the trend reversal is genuine.
🔹 Combining Downtrend Breakout with RSI
Dual Confirmation:
1. Breakout of the downtrend line → structural change in price action.
2. RSI above 50 → momentum shift toward buyers.
Why This Combination Works: It reduces false signals. A breakout alone may fail, but when supported by momentum indicators, the probability of success increases.
🔹 Current Trading Opportunity
Setup:
1. Entry: Near current levels (~₹1271), as price has broken the downtrend line.
2. Stop Loss: Below the most recent swing low, ensuring risk is defined if reversal fails.
3. Target: Traders often aim for the next resistance zone or use trailing stops to capture extended moves.
Risk Management:
1. Always define risk before entering.
2. Use the pullback low or recent swing low as a stop loss.
3. Adjust position size to maintain favorable reward-to-risk ratio.
📌 Key Takeaways
1. A downtrend reversal occurs when price breaks above its descending trendline.
2. RSI above 50 confirms momentum is shifting toward buyers.
3. Combining structural breakout with momentum confirmation creates a stronger trading signal.
4. Using the recent swing low as stop loss ensures disciplined risk management.
KPIT Technologies’ current setup is a textbook example of how traders can use trendline breakouts and RSI momentum together to identify potential reversals. It highlights the importance of combining price action with indicators to build a structured trading plan.
Niftyprediction
Understanding India Glycol’s Technical SetupIndia Glycol Limited is currently trading near ₹1097 on the daily chart. The stock has rebounded from a resistance turned support zone after a pullback, while the RSI indicator is moving above 50, signaling renewed bullish momentum. Let’s break down the technical concepts behind this setup and how traders can interpret the opportunity.
🔹 Resistance Turned Support
Definition: Resistance is a price level where selling pressure historically outweighs buying, preventing the stock from moving higher. Once broken, this level often flips into support, as buyers defend it.
Why It Matters: This flip reflects a change in market psychology—what was once a ceiling becomes a floor.
India Glycol Example: The stock has bounced from its former resistance zone, now acting as support near ₹1097, showing that buyers are stepping in at this level.
🔹 Pullback Reversal
Definition: A pullback is a temporary decline after a rally. A reversal occurs when the pullback ends and the stock resumes its upward trend.
Why It Matters: Pullbacks allow traders to enter at better prices instead of chasing highs.
India Glycol Example: The recent pullback tested the new support zone and reversed upward, suggesting renewed buying interest.
🔹 RSI Above 50: Momentum Confirmation
Relative Strength Index (RSI): A momentum oscillator ranging from 0–100.
Key Levels:
Below 50 → bearish momentum
Above 50 → bullish momentum
India Glycol Example: RSI moving above 50 confirms strength in the rebound, signaling that buyers are regaining control.
🔹 Current Trading Opportunity
Setup:
1. Entry: Near current levels (~₹1097), as price respects support.
2. Stop Loss: At the pullback low, ensuring risk is defined if support fails.
3. Target: Traders often aim for the next resistance zone or use trailing stops to ride momentum.
Why This Works:
1. Defined risk management (stop loss at pullback low).
2. Favorable reward-to-risk ratio if momentum continues.
3. RSI confirmation adds conviction to the trade.
📌 Key Takeaways
1. Resistance turned support highlights a psychological shift in market sentiment.
2. Pullback reversals provide safer entries than chasing breakouts.
3. RSI above 50 signals bullish momentum.
Using the pullback low as stop loss ensures disciplined risk management.
This setup in India Glycol illustrates how technical analysis concepts combine to create a structured trading plan. It’s not about predicting the future—it’s about managing probabilities with clear rules and discipline.

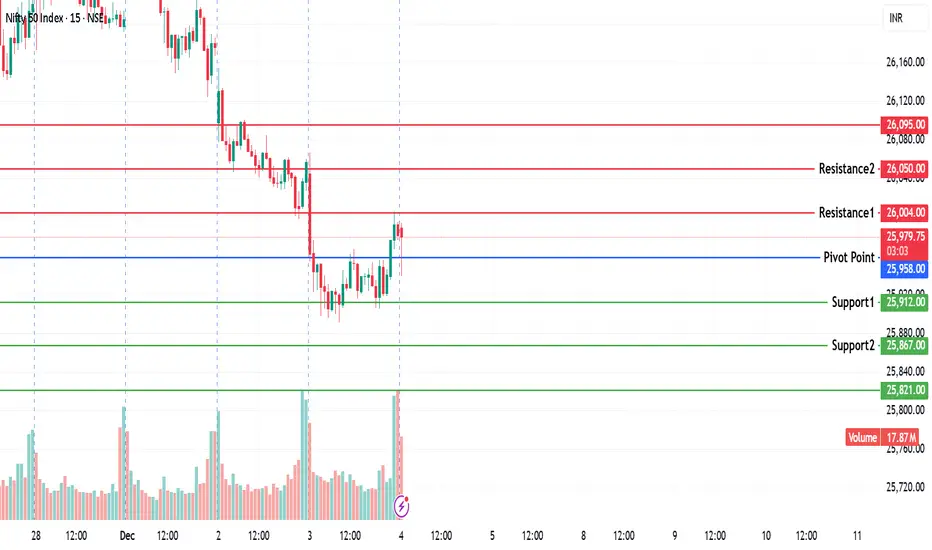
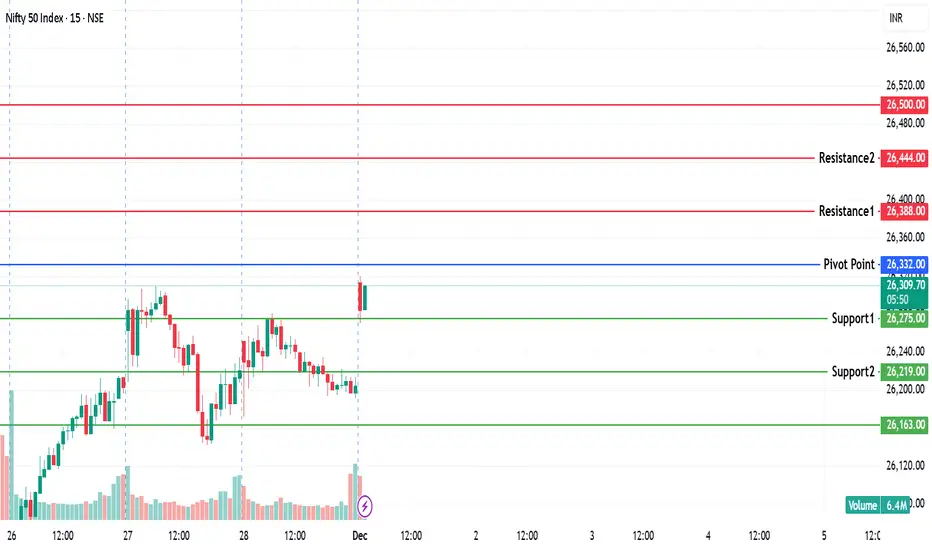
NIFTY KEY LEVELS FOR 04.12.2025NIFTY KEY LEVELS FOR 04.12.2025
Timeframe: 3 Minutes
If the candle stays above the pivot point, it is considered a bullish bias; if it remains below, it indicates a bearish bias. Price may reverse near Resistance 1 or Support 1. If it moves further, the next potential reversal zone is near Resistance 2 or Support 2. If these levels are also broken, we can expect the trend.
When a support or resistance level is broken, it often reverses its role; a broken resistance becomes the new support, and a broken support becomes the new resistance.
If the range(R2-S2) is narrow, the market may become volatile or trend strongly. If the range is wide, the market is more likely to remain sideways
please like and share my idea if you find it helpful
📢 Disclaimer
I am not a SEBI-registered financial adviser.
The information, views, and ideas shared here are purely for educational and informational purposes only. They are not intended as investment advice or a recommendation to buy, sell, or hold any financial instruments.
Please consult with your SEBI-registered financial advisor before making any trading or investment decisions.
Trading and investing in the stock market involves risk, and you should do your own research and analysis. You are solely responsible for any decisions made based on this research
Nifty Hits Targeted Support — Bounce Expected, But Weakness StilNifty Hits Targeted Support — Bounce Expected, But Weakness Still Not Over
NSE:NIFTY hit our targeted support today, so we exited the shorts we were carrying.
I already shared the update with all of you here.
I entered the 26300 PE (30 Dec) at 222 yesterday and exited today at the mentioned target, capturing nearly 80% of the move.
Having a solid week already! 🎉
Now Nifty has almost touched our projected support zone and bounced from there — exactly as expected.
However, the overall weakness is still present.
So the Sell-On-Rise plan remains active.
- Nifty’s Pivot is now 25981 with a Pivot Percentile of just 0.02%.
- The Macro Index also moved higher today.
Both of above points indicate a bounce probability for tomorrow.
The key resistance I’m watching is 26088.
If Nifty sustains above this level, the Sell-On-Rise plan becomes invalid.
The idea is simple:
Use this bounce to short when
• sellers’ volume appears near the day high, or
• support breaks again.
These are the two short setups I’ll be watching.
On the equity side, setups are still limited, but the Auto sector looks strong and I’ve shortlisted a few names from there.
That’s all for now.
Take care. Have a profitable tomorrow.
NIFTY : Trading levels and Plan for 04-Dec-2025📊 NIFTY TRADING PLAN — 04 DEC 2025
Current market context:
Price is hovering near 25,981, sitting just below key intraday levels. The index showed a late recovery on 3rd Dec, but still remains inside a broader corrective structure. Tomorrow’s opening reaction near the Opening Support (25,953) and Opening Resistance (26,020) will set the tone for the session.
Below is the complete trading plan based only on the marked levels in your chart.
🚀 1. GAP-UP OPENING (100+ points)
A strong gap-up above 26,020 indicates early bullish strength and short-covering. However, note that price will immediately approach the Last Intraday Resistance Zone: 26,094–26,119, which has been a major rejection zone earlier.
1. Opening above 26,020 → Look for Retest Entry
• Avoid chasing a gap-up candle.
• Wait for price to retest 26,020, show wicks / bullish engulfing / CHoCH reversal.
• If retest holds → Upside targets toward 26,160 → 26,224.
• This is safest because it confirms buyer presence.
2. If gap-up directly opens inside 26,094–26,119 (resistance box)
• Avoid long entries.
• Expect sellers to react.
• Look for rejection wicks & bearish structure shift.
• Short trades are only valid if price breaks below 26,020 after rejection.
3. Bullish Continuation Above 26,119
• If the resistance box breaks with strong momentum → Trend continuation.
• Next immediate upside: 26,160 → 26,224 (chart-projected path).
📌 Educational Note:
Gap-up openings often trap late buyers. A retest is safe because it confirms that the gap is being accepted by the market.
⚖ 2. FLAT OPENING (±50 points around 25,980)
Flat opens near Opening Support (25,953) or Opening Resistance (26,020) offer the best price-action trades.
1. If price holds 25,953 and forms higher-lows
• Buyers defending strongly.
• Look for bullish structure → Target 26,020 → 26,094.
• Sustained breakout above 26,020 gives a clean intraday long.
2. If price rejects 26,020
• Watch for bearish engulfing / rejection wicks.
• First downside target: 25,953
• Break below this → Trend may shift bearish for the day.
3. Range Day Setup
If price stays between 25,953–26,020, trade only extremes:
• Buy near 25,953 (only on confirmation).
• Sell near 26,020 (only on confirmation).
📌 Educational Note:
Flat opens are the most reliable for retail traders because structure is clearer and volatility is normal.
📉 3. GAP-DOWN OPENING (100+ points)
A gap-down into the Last Intraday Buyer Support (25,732–25,798) signals fear, stop-run liquidity, and possible reversal zones.
1. If price opens inside 25,732–25,798
• DO NOT short the open.
• This zone is where buyers previously defended.
• Look for reversal: hammer candle, divergence, or CHoCH.
• If reversal signs appear → Long trade targeting 25,953 → 26,020.
2. If price breaks below 25,732
• This is bearish continuation.
• Only short on retest of the broken zone.
• Downside targets: 25,680 → 25,640 (chart-projected bearish path).
3. If price recovers quickly from the gap-down
• V-shape reversals are common in strong markets.
• Once above 25,798, bullish continuation toward 25,953 → 26,020.
📌 Educational Note:
Gap-downs often sweep liquidity and reverse sharply. Confirmation is crucial before entering any trade.
🛡 RISK MANAGEMENT TIPS FOR OPTIONS TRADERS
1. Avoid buying options in the first 5–10 minutes after a gap opening. Volatility crush can hurt premiums.
2. Always define your stop-loss based on price levels, not premium. Price levels are more stable.
3. Avoid trading against major zones (resistance/support).
4. Use position sizing:
Never risk more than 1–2% of your trading capital on a single trade.
5. If IV is high → Prefer selling strategies.
If IV is low → Buying options becomes more efficient.
6. Don’t revenge trade. If levels break unexpectedly, step aside and re-plan.
📌 SUMMARY & CONCLUSION
• Bullish bias only above 26,020 → 26,094
• Range-bound between 25,953–26,020
• Strong reversal zone at 25,732–25,798 on gap-down
• Gap openings must always be traded with retests, not predictions
• Focus on market structure and reactions at these marked levels
Trade with discipline, follow levels, and avoid over-positioning during high volatility.
⚠ DISCLAIMER
I am not a SEBI-registered analyst.
This trading plan is for educational purposes only and not investment advice.
Market conditions can change rapidly—always use your own judgment and risk management.

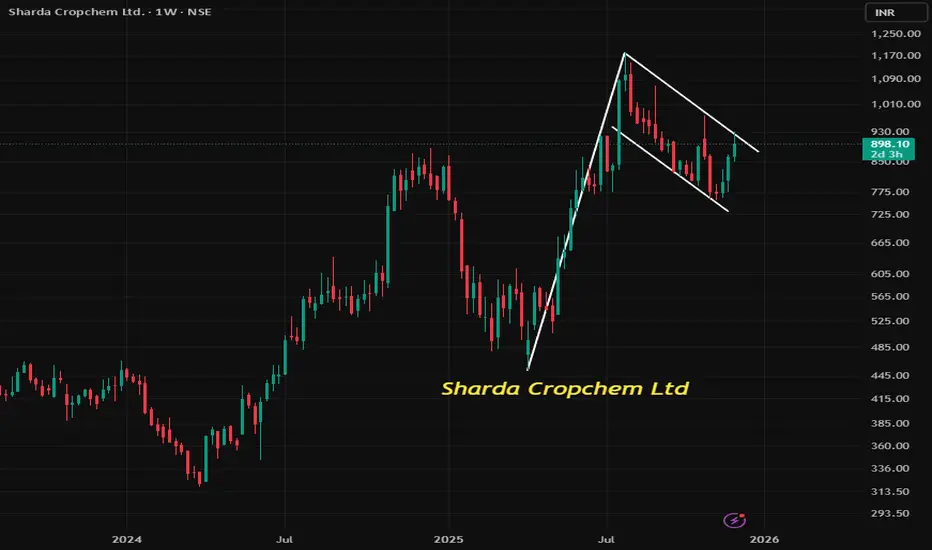
SHARDA CROPCHEM : The Flag & Pole patternThe Flag & Pole pattern is a powerful bullish continuation setup. In Sharda Cropchem Ltd, currently trading at ₹901, this pattern suggests potential upside if the breakout sustains, with defined target and stop-loss levels.
📈 What is a Flag & Pole Pattern?
1. Pole: A sharp, vertical price rise driven by strong buying momentum.
2. Flag: A short consolidation phase where price moves sideways or slightly downward, resembling a flag on the pole.
3. Breakout: Once price breaks above the flag, the prior uptrend often resumes with strength
🔑 Importance of the Pattern
1. Continuation Signal: Indicates that the prevailing bullish trend is likely to continue.
2. Clear Risk-Reward Setup: Provides well-defined entry, stop-loss, and target levels.
3. Widely Used: Traders across equities, forex, and commodities rely on it for short- to medium-term trades.
🛠️ How to Trade the Pattern
Entry Point:
Enter when price breaks above the flag resistance with strong volume confirmation.
Target Strategy:
Measure the length of the pole (initial sharp rally).
Project the same distance upward from the breakout point.
Example: If the pole is ₹150 long, add ₹150 to breakout price for target.
Stop-Loss Strategy:
Place stop-loss just below the flag’s lower boundary.
This protects against false breakouts while keeping risk limited.
📝 Key Takeaways
Flag & Pole = Bullish Continuation.
Entry on breakout, target = pole length, stop-loss below flag.
Sharda Cropchem shows this setup, offering a strong risk-reward opportunity if breakout sustains.
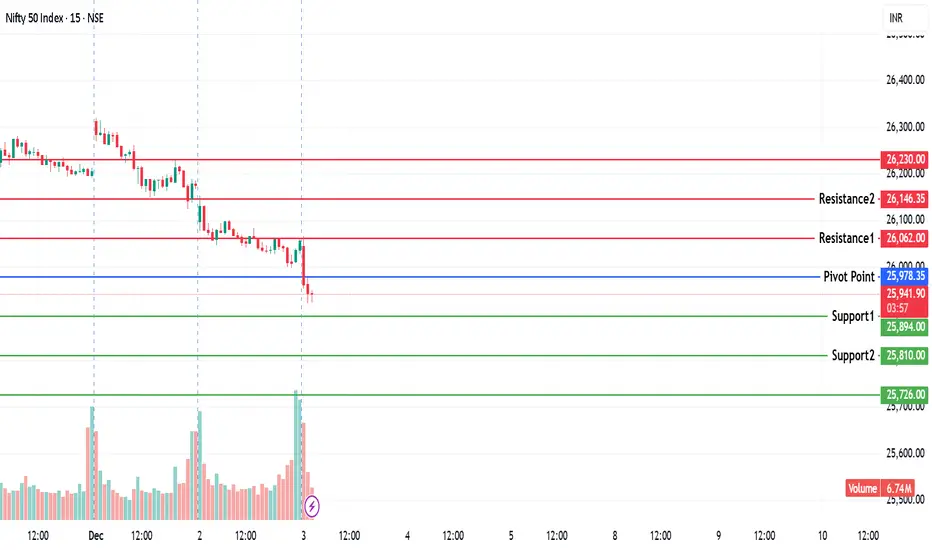
NIFTY KEY LEVELS FOR 03.12.2025NIFTY KEY LEVELS FOR 03.12.2025
Timeframe: 3 Minutes
If the candle stays above the pivot point, it is considered a bullish bias; if it remains below, it indicates a bearish bias. Price may reverse near Resistance 1 or Support 1. If it moves further, the next potential reversal zone is near Resistance 2 or Support 2. If these levels are also broken, we can expect the trend.
When a support or resistance level is broken, it often reverses its role; a broken resistance becomes the new support, and a broken support becomes the new resistance.
If the range(R2-S2) is narrow, the market may become volatile or trend strongly. If the range is wide, the market is more likely to remain sideways
please like and share my idea if you find it helpful
📢 Disclaimer
I am not a SEBI-registered financial adviser.
The information, views, and ideas shared here are purely for educational and informational purposes only. They are not intended as investment advice or a recommendation to buy, sell, or hold any financial instruments.
Please consult with your SEBI-registered financial advisor before making any trading or investment decisions.
Trading and investing in the stock market involves risk, and you should do your own research and analysis. You are solely responsible for any decisions made based on this research
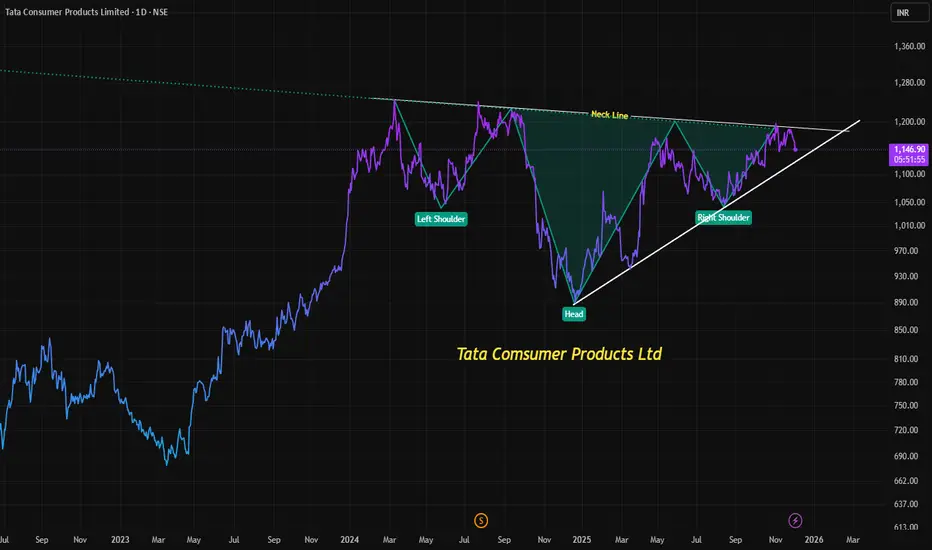
Understanding the Inverted Head & Shoulders Pattern: TATACONSUM📈 Understanding the Inverted Head & Shoulders Pattern: Tata Consumer Products Case Study
Technical analysis often provides traders with powerful insights into potential market moves. One of the most reliable reversal patterns is the Inverted Head & Shoulders, which signals a shift from bearish to bullish sentiment. Let’s break down this pattern, its importance, and how it applies to Tata Consumer Products Ltd, currently trading near ₹1152 levels.
🔍 What is the Head & Shoulders Pattern?
Classic Head & Shoulders (H&S): A bearish reversal pattern formed after an uptrend OR sideways consolidation. It consists of three peaks:
Left Shoulder → A rise followed by a decline
Head → A higher rise followed by a decline
Right Shoulder → A lower rise followed by a decline
Inverted Head & Shoulders (IH&S): The bullish counterpart, formed after a downtrend or sideways consolidation. It consists of three troughs:
Left Shoulder → A decline followed by a rise
Head → A deeper decline followed by a rise
Right Shoulder → A higher low followed by a rise
The neckline connects the peaks (in IH&S, the resistance line). A breakout above this neckline confirms the bullish reversal.
🌟 Importance of the Pattern
1. Reliability: IH&S is considered one of the most dependable reversal signals.
2. Psychology: It reflects weakening selling pressure and strengthening buying interest.
3. Trend Reversal: Marks the transition from bearish consolidation to bullish momentum.
🎯 How to Enter After Neckline Breakout
1. Wait for Confirmation: Enter only after the price closes above the neckline with strong volume.
2. Retest Entry: Sometimes, price retests the neckline after breakout. This offers a safer entry point.
3. Avoid Premature Entry: Entering before breakout increases risk of false signals.
📏 Measuring the Target on Breakouts
The target is calculated by measuring the distance from the head (lowest point) to the neckline, then projecting it upward from the breakout point.
Target Price = Neckline Breakout Level + (Neckline − Head)
🛡️ Stop Loss Placement
1. Conservative SL: Just below the right shoulder low.
2. Aggressive SL: Below the head (deepest trough).
3. This ensures risk is managed if the breakout fails.
📊 Current Opportunity in Tata Consumer Products Ltd
1. Trading Level: Around ₹1185 (neckline zone).
2. Pattern Setup: Inverted Head & Shoulders nearing completion.
3. Bullish Potential: A breakout above ₹1185 could trigger a move toward Target levels as explained.
4. Risk Management: Stop loss near below right shoulder
✅ Key Takeaways
1. The Inverted Head & Shoulders is a strong bullish reversal pattern.
2. Always wait for neckline breakout confirmation before entering.
3. Targets are measured by projecting the head-to-neckline distance.
4. Stop loss discipline is crucial to protect against false breakouts.
Tata Consumer Products Ltd at ₹1185 offers a potential bullish opportunity if neckline breakout sustains.
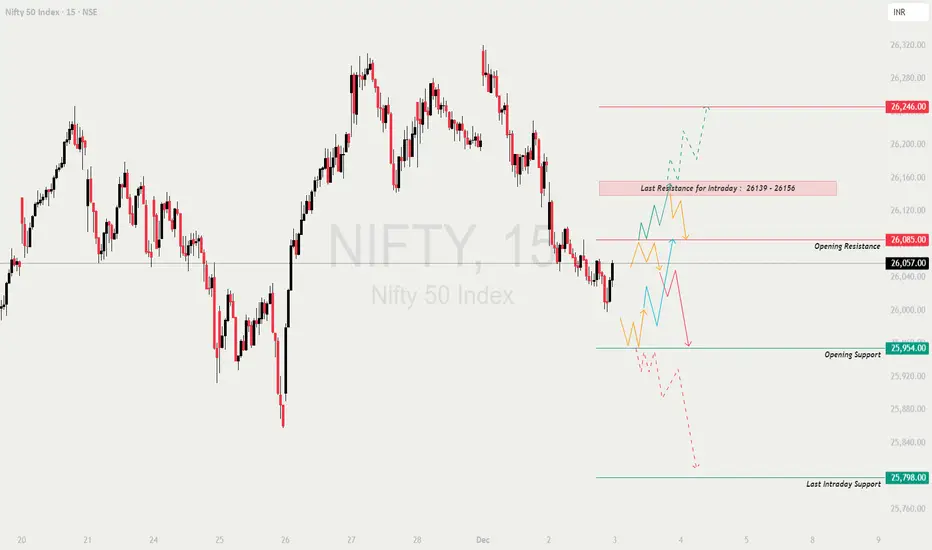
NIFTY : Trading levels and Plan for 03-Dec-2025📊 NIFTY TRADING PLAN — 03 DEC 2025
Nifty closed around 26,057, sitting just below the Opening Resistance (26,085) and far from both the day’s support and supply zones.
The chart indicates bearish pressure, but buyers still defend the 25,954 support on dips.
The behaviour at the opening will define whether the index attempts a rebound or continues the downtrend.
🔍 Key Levels For The Day
🟥 Opening Resistance: 26,085
🟥 Last Intraday Resistance: 26,139 – 26,156
🟥 Major Upside Target: 26,246
🟩 Opening Support: 25,954
🟩 Last Intraday Support: 25,798
🟩 Major Breakdown Target: 25,760 – 25,720
🟩 SCENARIO 1 — GAP-UP OPENING (100+ Points)
If Nifty opens near 26,150–26,200, it jumps straight into the resistance zone.
If price sustains above 26,085 → It will attempt the next resistance at:
26,139 → 26,156 → 26,200+
Break & retest above 26,156 gives a drive toward 26,246.
If price rejects 26,085–26,139 (upper wicks, strong red candle) →
Expect profit-booking down toward 26,020 → 25,954.
Safer Long Setup:
✔️ Breakout above 26,156 + Retest → Target 26,200 / 26,246
Early aggressive shorting is risky.
Gap-ups near resistance often create trap candles.
📘 Educational Note:
A gap-up directly into resistance is often a testing zone where institutions check if late buyers will panic.
Let the chart confirm strength before entering.
🟧 SCENARIO 2 — FLAT OPENING (25,980–26,050)
Flat openings create a balanced battlefield between bulls and bears.
Upside trigger → Break above 26,085
Targets → 26,139 → 26,156 → 26,200
Downside trigger → Break below 25,954
Targets → 25,900 → 25,850 → 25,798
Avoid trading inside the tight range 26,020–26,070 — high noise, low reward.
Two ideal setups:
✔️ Breakout & Retest above 26,085
✔️ Breakdown & Retest below 25,954
💡 Educational Tip:
Flat opens typically lead to a clean breakout after the first 2–3 candles.
Let direction reveal itself instead of predicting it.
🔻 SCENARIO 3 — GAP-DOWN OPENING (100+ Points)
If Nifty opens around 25,920–25,960, it opens near or inside support.
If buyers defend 25,954 and form higher lows →
Reversal targets:
26,020 → 26,057 → 26,085
If 25,954 breaks decisively →
Next targets → 25,900 → 25,850 → 25,798
Breakdown below 25,798 triggers stronger fall →
Targets → 25,760 → 25,720
Reversal trades should only be taken with:
✔️ bullish candle
✔️ higher low
✔️ strong wick rejection
inside the support zone.
📘 Educational Note:
Gap-downs into support attract smart money buying, but only if the zone holds.
A breakdown usually gives a clean trend day on the downside.
💼 RISK MANAGEMENT TIPS FOR OPTION TRADERS 🔐💡
Do NOT trade the first 5 minutes after open (avoid traps).
Prefer ITM/ATM options for directional moves.
Use chart-level SL, not premium-level SL.
Avoid averaging losing trades — re-entry is always safer.
Trail SL once the trade hits the first target.
During high VIX, prefer option spreads.
Avoid overtrading during volatile candle clusters.
⚠️ Golden Rule:
Protect capital first.
Exposure without risk control = guaranteed loss.
📌 SUMMARY
Bullish Above:
✔️ 26,085 → 26,139 → 26,156 → 26,200 → 26,246
Bearish Below:
✔️ 25,954 → 25,900 → 25,850 → 25,798 → 25,760
Reversal Zones:
🟩 25,954 (Opening Support)
🟩 25,798 (Intraday Support)
🟥 26,085 (Opening Resistance)
🟥 26,139–26,156 (Key Supply Zone)
Avoid Trading Inside:
⚠️ 26,020–26,070
This is the NOISE zone.
🧾 CONCLUSION
Nifty is set for a decisive day with clear vertical levels.
Trend direction will be driven by:
✔️ Sustaining above 26,085 = Bullish continuation
✔️ Breaking below 25,954 = Fresh downside
✔️ Breakout above 26,156 = Strong rally
✔️ Breakdown below 25,798 = Sharp sell-off
Trade only with confirmation, avoid guessing direction, and focus on clean structure-based entries.
⚠️ DISCLAIMER
I am not a SEBI-registered analyst.
This analysis is purely for educational purposes.
Please consult your financial advisor before making trading decisions.
Doubtful Environment Ahead — Trade Only What the Market ConfirmsToday I followed what we planned in yesterday's commentary and sold NSE:NIFTY on the rise.
While many “gurus” on social media say there are no opportunities in the market, the truth is simple — opportunities always exist if you look in the right direction.
Now let’s talk about today’s market behaviour, which was quite unusual.
- Nifty fell on the chart, but buyers’ volume increased at the end of the day.
- The Macro Index also dropped.
- Market health shifted from Green to Orange.
- Collective volume decreased.
- And price is currently neither at support nor at resistance.
Together, these points indicate that the market is in a doubtful and unclear environment.
For me, trading means protecting what I earned today and not losing it tomorrow.
So whenever I am in doubt, I stay out. It is that simple for me.
Tomorrow looks like one of those days.
Since Nifty is stuck between support and resistance, I will plan my trades live during market hours. I’m prepared for both directions.
My primary idea is still Sell-on-Rise.
However, because buyers’ volume was strong today, I will not hesitate to go long if the index bounces from support.
I think tomorrow would be the day where I catch both side swing.
Support for me is around 25970.
Resistance is at 26110, where I will look for rejection to sell.
Pivot is now 26061 and the Pivot Percentile is tight, which means liquidity will be good tomorrow.
That's what I have as of now.
Take care.
Have a profitable tomorrow.

NIfty Hourly Strong SupportHello Friends,
Nifty Spot at 26050-60 having support of EMA100 along with trendline support and RSI oversold in hourly ......Overall Momentum is Bullish this is good DIP expceting 26400,26500,26700+ in coming few sessions
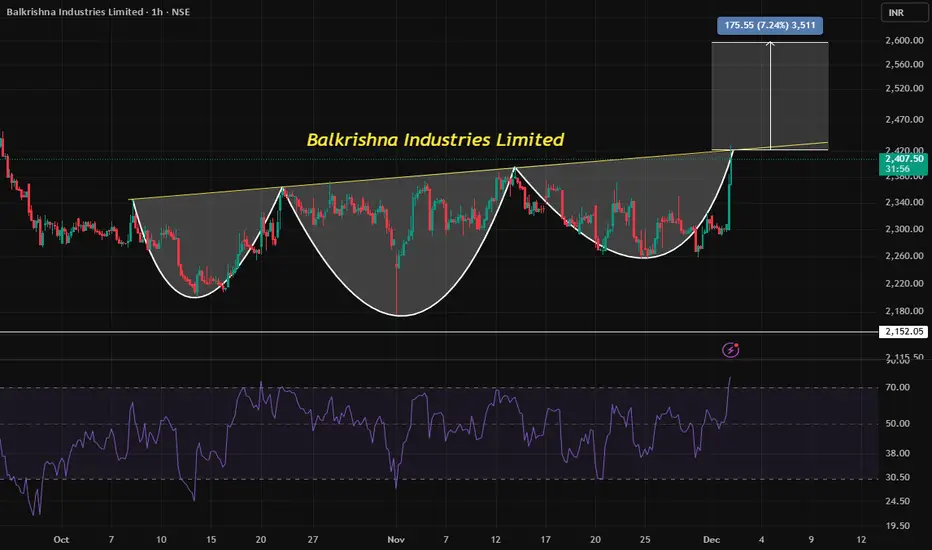
When Charts Speak Loud: Balkrishna Industries at Turning Point📊 Understanding the Head & Shoulder Pattern
Definition: The Head & Shoulder (H&S) pattern is one of the most recognized reversal formations in technical analysis. It consists of three peaks:
Left Shoulder: A rise followed by a decline.
Head: A higher rise followed by another decline.
Right Shoulder: A smaller rise, often mirroring the left shoulder, followed by a decline.
Neckline: The support level connecting the lows after each peak. A breakdown below this line often signals a bearish reversal.
👉 Why it matters: Traders view the H&S as a warning that bullish momentum is fading and a potential trend reversal could be underway.
⚡ RSI Momentum Explained
Relative Strength Index (RSI): A momentum oscillator that measures the speed and change of price movements.
Key Levels:
Above 70 → Overbought zone (possible correction or reversal).
Below 30 → Oversold zone (possible bounce).
In Balkrishna Industries’ case, RSI moving above 70 on the hourly chart suggests the stock is in an overbought condition, increasing the probability of a pullback.
📌 Current Opportunity in Balkrishna Industries (Trading at 2407)
The stock is forming a Head & Shoulder pattern on the hourly timeframe.
RSI above 70 indicates overheated momentum, aligning with the potential reversal signal from the H&S.
Trader’s takeaway:
Watch for a neckline breakdown to confirm the pattern.
A confirmed breakdown could open opportunities for short trades or profit booking.
Risk management is crucial—false breakouts can occur, so traders often wait for volume confirmation.
🎯 Why Traders Should Care
Combining chart patterns (H&S) with momentum indicators (RSI) gives a stronger signal than relying on one alone.
Balkrishna Industries at 2407 is at a critical juncture—either it sustains momentum or confirms reversal.
For traders, this is a classic setup where technical analysis provides a roadmap for potential profit opportunities.
🔥 In short: "Balkrishna Industries is shouting reversal—will you listen to the charts?"
NIFTY KEY LEVELS FOR 02.12.2025NIFTY KEY LEVELS FOR 02.12.2025
Timeframe: 3 Minutes
If the candle stays above the pivot point, it is considered a bullish bias; if it remains below, it indicates a bearish bias. Price may reverse near Resistance 1 or Support 1. If it moves further, the next potential reversal zone is near Resistance 2 or Support 2. If these levels are also broken, we can expect the trend.
When a support or resistance level is broken, it often reverses its role; a broken resistance becomes the new support, and a broken support becomes the new resistance.
If the range(R2-S2) is narrow, the market may become volatile or trend strongly. If the range is wide, the market is more likely to remain sideways
please like and share my idea if you find it helpful
📢 Disclaimer
I am not a SEBI-registered financial adviser.
The information, views, and ideas shared here are purely for educational and informational purposes only. They are not intended as investment advice or a recommendation to buy, sell, or hold any financial instruments.
Please consult with your SEBI-registered financial advisor before making any trading or investment decisions.
Trading and investing in the stock market involves risk, and you should do your own research and analysis. You are solely responsible for any decisions made based on this research

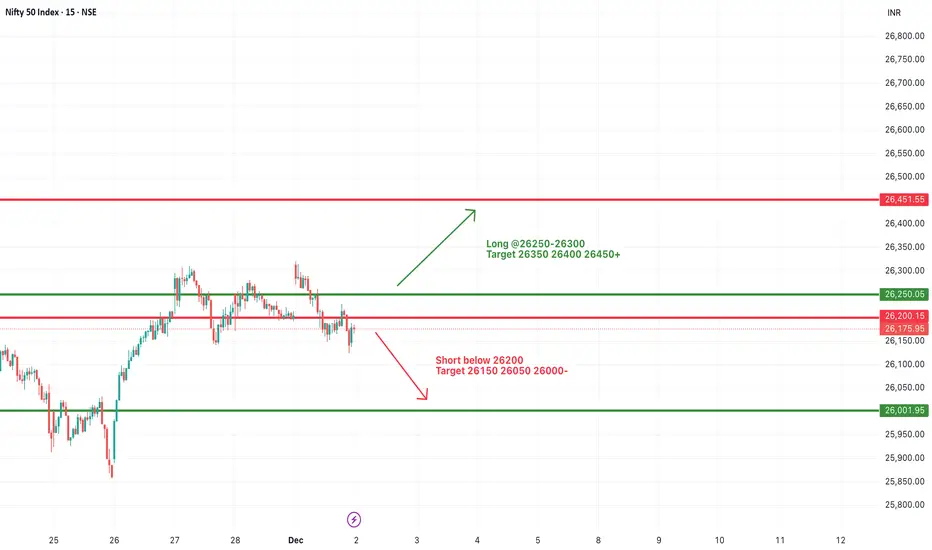
#NIFTY Intraday Support and Resistance Levels - 02/12/2025Nifty is expected to open flat today, indicating a neutral start as the index continues to move within a tight range after recent sideways sessions. A flat opening near the midpoint of the structure suggests that the market is waiting for a clear directional trigger before committing to a strong move. On the upside, if the index sustains above the 26250–26300 zone, the long setup becomes active with upside targets of 26350, 26400, and 26450+. A breakout above 26450 can further extend bullish momentum toward the next significant resistance at 26500 and potentially higher levels if the buying interest strengthens.
On the downside, immediate weakness will only be confirmed if Nifty breaks below the 26200 level, which activates the short setup with downside targets of 26150, 26050, and 26000-. A break below this zone would indicate a continuation of the selling pressure that has appeared near the top of the consolidation structure. If the index slips further toward the 26000 support band, lower levels may come into focus, especially if broader sentiment remains weak.
Overall, with a flat opening expected, the market may remain range-bound during the initial hour until a decisive breakout or breakdown occurs from the key levels. Traders should be cautious during the early session, as the market may show choppy movements before establishing a clear trend for the day.
Nifty again entered in the Sell-On-Rise mode NSE:NIFTY didn’t move exactly the way we planned today.
But it still delivered the move I was expecting — just not in the structure I wanted.
Happens.
This is the beauty of the market.
It keeps challenging you, keeps you curious, keeps you sharp.
And that’s what makes this profession worth chasing.
Now let’s see what’s lined up for tomorrow:
Nifty’s Pivot has climbed to 26208, but price closed below it — which clearly shows a short buildup today.
PP is 0.13, meaning the space is tight and a sharp move may come in the direction of the prevailing trend.
Our Macro indicator also dropped by 8 points — further confirming the short buildup.
So the plan for tomorrow is simple:
Unless Nifty gives a strong close above 26300, I’ll stay in Sell-on-Rise mode for the index.
This does NOT mean the market is entering a downtrend.
Overall trend is still bullish — in fact, strength is quietly returning in Smallcaps and the broader market.
I’m only highlighting what the index data is signaling so we can capture intraday opportunities safely.
Resistance is now at 26280,
Support sits at 26050.
Market health has already turned Orange from Green, which indicates early signs of a shift.
Sector-wise, Auto is showing great momentum and relative strength.
That’s all for today.
Take care. Have a profitable tomorrow.

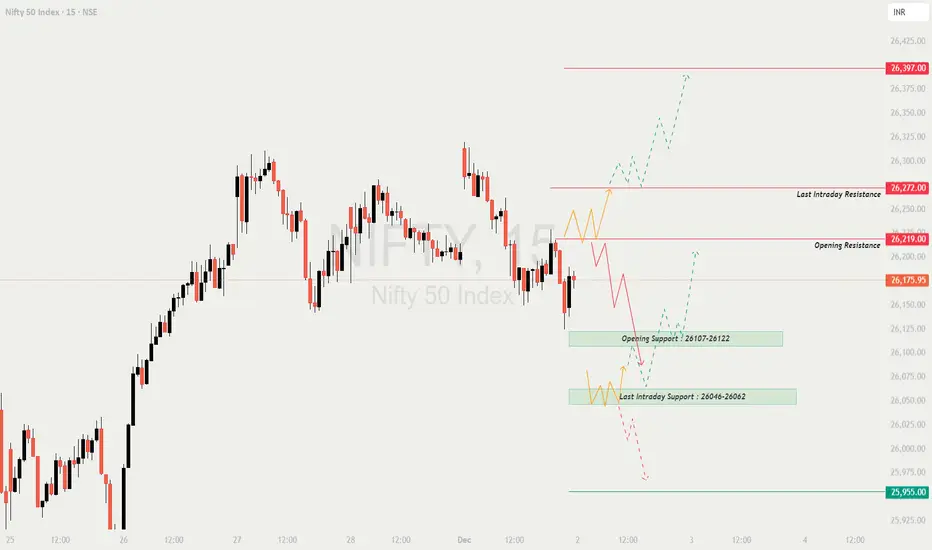
NIFTY : Trading levels and Plan for 02-Dec-2025📊 NIFTY TRADING PLAN — 02 DEC 2025
Nifty closed near 26,175, right between the Opening Resistance (26,219) and Opening Support (26,107–26,122).
The market is currently in a low-momentum, direction-hunting phase, where the opening behaviour will determine the next trend leg.
The structure shows clean supply zones above and strong demand zones below, meaning both sides have potential — but only confirmation-based trading is safe.
🔍 Key Intraday Levels
🟥 Opening Resistance: 26,219
🟥 Last Intraday Resistance: 26,272
🟥 Major Breakout Level: 26,397
🟩 Opening Support: 26,107 – 26,122
🟩 Last Intraday Support: 26,046 – 26,062
🟩 Major Breakdown Level: 25,955
🟢 SCENARIO 1 — GAP-UP OPENING (100+ Points)
If Nifty opens near 26,260–26,300, price opens right at or above resistance.
If price sustains above 26,219 for 10–15 minutes →
Upside targets: 26,272 → 26,330 → 26,397
This zone becomes a continuation breakout if volumes support.
If Nifty rejects 26,219–26,272 (wick rejections, long red candle) →
Expect a retracement towards:
➡️ 26,175 → 26,122
Best Long Setup:
Breakout above 26,272 → Retest → Bullish candle → Target 26,330 / 26,397
Avoid early shorting on gap-ups —
fakes are common near resistance clusters.
📘 Educational Note:
A gap-up directly into resistance requires patience.
Breakouts without retests often fail.
Retests confirm whether buyers truly control the level.
🟧 SCENARIO 2 — FLAT OPENING (26,150–26,190)
A flat open places Nifty between support and resistance. Expect early indecision.
Upside trigger → Break and sustain above 26,219.
Targets → 26,272 → 26,330
Downside trigger → Break below 26,122.
Targets → 26,062 → 26,046
The zone 26,175–26,200 is a noise range. Avoid trading inside it.
Two safe setups:
✔️ Breakout & Retest above 26,219
✔️ Breakdown & Retest below 26,122
💡 Educational Tip:
Flat openings give the cleanest structure of the day.
Wait for the breakout from the initial range (first 3–4 candles).
Impulse moves from the flat zone lead to strong trends.
🔻 SCENARIO 3 — GAP-DOWN OPENING (100+ Points)
If Nifty opens around 26,050–26,090, price enters the demand zones.
If support 26,062–26,046 holds and higher-low structure forms →
Reversal upside targets → 26,122 → 26,175 → 26,219
If 26,046 breaks →
Sharp downside possible →
➡️ 26,000 → 25,955 (major support)
This is a crucial liquidity zone.
Only sell BELOW 25,955 with confirmation.
Targets: 25,900 → 25,850
Reversal trades are valid ONLY after a bullish confirmation candle in the support zone.
📘 Educational Note:
Gap-downs into strong support often cause big traps for late sellers.
Wait for price to show exhaustion before buying —
Higher low + strong bullish candle = safest reversal pattern.
💼 RISK MANAGEMENT TIPS FOR OPTION TRADERS 💡
Avoid trading the first 5 minutes after the open.
Use ATM or ITM options for directional trades.
Set SL based on chart level, not premium price.
Never average a losing trade — cut and re-enter if needed.
Trail stop-loss after first target to lock profits.
Weekly expiry days → avoid overtrading during volatility spikes.
High VIX → Prefer spreads over naked buying.
⚠️ Golden Rule:
Be a risk manager first, a trader second.
Capital safety guarantees longevity.
📌 SUMMARY
Bullish Bias Above:
✔️ 26,219 → 26,272 → 26,330 → 26,397
Bearish Bias Below:
✔️ 26,122 → 26,062 → 26,046 → 25,955
Reversal Zones:
🟩 26,107 – 26,122 (Opening Support)
🟩 26,046 – 26,062 (Last Intraday Support)
🟥 26,219 – 26,272 (Heavy Resistance)
Danger / No-Trade Zone:
⚠️ 26,165–26,200 (Choppy, low-quality zone)
🧾 CONCLUSION
Nifty is at a decisive stage where both sides are open.
The day’s trend will be controlled by these key triggers:
✔️ Bullish only above 26,219
✔️ Bearish below 26,122
✔️ Strong breakout only above 26,272
✔️ Major breakdown only below 25,955
Trade with confirmation, respect levels, and avoid emotional entries.
Let market structure guide your trades — not impulses.
⚠️ DISCLAIMER
I am not a SEBI-registered analyst.
This analysis is purely for educational purposes.
Please consult your financial advisor before making trading decisions.
Nifty 50 Analysis (Based on Your 4H+1D Chart ) Key Observations from Your Markups (ICT Style):
1. Price is sitting inside a 4H FVG (26,110–26,170 zone)
This is acting as intraday demand / discount region.
Price bounced here previously and is testing it again.
2. Multiple PDH levels above + Weak High at ~26,320–26,350
This cluster suggests **liquidity resting above.
If price reclaims PDH → expect a sweep toward the weak high.
3. PDL is protected (~26,070–26,090)
Clean liquidity pool below.
A sweep into PDL + FVG confluence gives high-probability long setup.
4. Daily chart shows rejection from the supply zone (26,300–26,380)
But the structure is still **bullish BOS → continuation** unless 25,950 breaks.
---
📌Tomorrow’s Probable Scenarios
🟢 Bullish Setup (Higher Probability)
Entry Zone:
➡️ 26,080–26,120 (PDL + 4H FVG + discount)
Entry Trigger:
W-pattern
BOS on 5m/15m
Stop-run below today’s low
Targets:
1. 26,240
2. 26,310 (PDH)
3. 26,350–26,380 (Weak High / liquidity sweep)
Stoploss:
➡️ Below 25,980 (structure invalidation + 4H FVG break)
---
🔴 Bearish Setup (If 26,300 is rejected again)
Entry Zone:
➡️ 26,300–26,350 (weak high + PDH cluster)
Targets:
1. 26,180
2. 26,110 (FVG midpoint)
3. 25,980 (PDL & liquidity)
Stoploss:
➡️ Above 26,380 (clean invalidation)
NIFTY KEY LEVELS FOR 01.12.2025NIFTY KEY LEVELS FOR 01.12.2025
Timeframe: 3 Minutes
If the candle stays above the pivot point, it is considered a bullish bias; if it remains below, it indicates a bearish bias. Price may reverse near Resistance 1 or Support 1. If it moves further, the next potential reversal zone is near Resistance 2 or Support 2. If these levels are also broken, we can expect the trend.
When a support or resistance level is broken, it often reverses its role; a broken resistance becomes the new support, and a broken support becomes the new resistance.
If the range(R2-S2) is narrow, the market may become volatile or trend strongly. If the range is wide, the market is more likely to remain sideways
please like and share my idea if you find it helpful
📢 Disclaimer
I am not a SEBI-registered financial adviser.
The information, views, and ideas shared here are purely for educational and informational purposes only. They are not intended as investment advice or a recommendation to buy, sell, or hold any financial instruments.
Please consult with your SEBI-registered financial advisor before making any trading or investment decisions.
Trading and investing in the stock market involves risk, and you should do your own research and analysis. You are solely responsible for any decisions made based on this research.
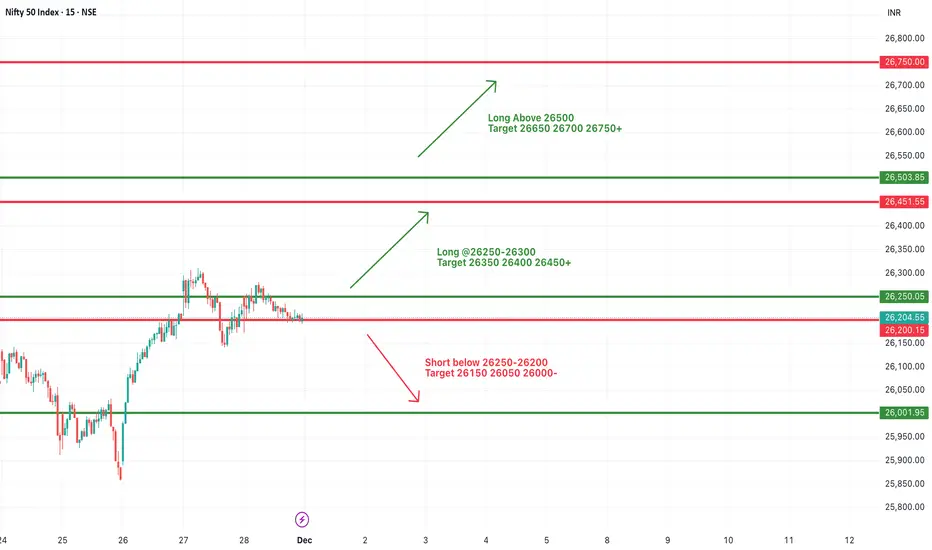
#NIFTY Intraday Support and Resistance Levels - 01/12/2025Nifty is expected to open with a strong gap-up near the 26450 zone, signalling sustained bullish momentum and renewed buying interest at higher levels. This opening zone is significant because it aligns closely with a key resistance area that the index has been attempting to break over the past few sessions. If Nifty manages to sustain above the 26250–26300 support band after the opening surge, it will reinforce bullish strength and keep the long setup active toward 26350, 26400, and back into the 26450 region. A stable price action above 26450 becomes particularly important, as it will indicate that buyers are willing to absorb supply at the upper levels and push the market into the next breakout phase.
A clear breakout above the psychological and technical resistance of 26500 could attract fresh buying momentum, opening the path toward higher targets at 26650, 26700, and even 26750+, especially if global cues support risk-on sentiment. In such a scenario, the market could experience a trend-driven rally with shallow pullbacks and continuous higher supports.
However, traders should also be cautious of any rejection from the 26450–26500 zone. Immediate weakness will only be confirmed if Nifty slips back below the 26250–26200 region, which would activate the short setup with downside targets at 26150, 26050, and 26000-. Such a move would indicate exhaustion of the gap-up momentum and potential profit booking by short-term participants.
Overall, with a gap-up opening near 26450, the broader short-term bias remains decisively positive. Sustaining above key breakout levels throughout the first hour will be crucial for maintaining momentum and validating the expected bullish continuation for the day.
Nifty - Buy the Dip near Support. Don't chase short term gains. NSE:NIFTY is moving exactly the way we planned.
On Thursday we combined the Macro + Technicals and expected an Inside Bar — and that’s exactly what happened.
But we also noted the PP was tight, and still there was no breakout.
That’s called compression — when price doesn’t catch up even though macros are aligned.
This is the phase where retailers lose confidence, dump their BTST and swing positions, and the index dips back to the previous-resistance-turned-support.
Once their inventory is flushed out, institutions quietly accumulate from that support zone.
For us, that support is now 25070–25050.
So the plan is simple:
Buy the dip near this support.
Second plan:
Buy the breakout above 26312.
If this plays out, the target will be around 26700.
However, the plan becomes invalid if Nifty begins trading below 26000.
Also keep in mind — this upcoming move may not be sustainable for long.
Many stocks will blast next week, but they won’t sustain those gains.
So book profits. Don’t hold blindly.
Sector-wise, selective setups in Auto Parts, Finance, and Banks look good.
In many stocks you will see sharp moves, but investing now and hoping for “quick gains” would not be smart — because context is not strong.
And context is more important than sectors, setups, groups, or even fundamentals.
That’s all for today.
Take care. Have a profitable tomorrow.

Weekly Analysis Nifty.....Last week Nifty had both side movement and provided good swing trades at both the sides and eventually closed positively at weekly level. It had broken all time high but could not sustain to close above it, eventually closed below all-time high and last week’s high. Last two days were range bound, indecision market. It seems players are consolidating the price for further move. We may see some consolidation and retrace till ~26200-100 range and then a possible breakout. Breakout may wait for any impactful global or domestic news/event.
Critical points ……………….
1. ~26200-100 range for consolidation/retrace.
2. Currently 1 Hour time frame is forming a W pattern. Which is again a positive signg.
3. We may see some good bullish LTF patter at the given range and then possible breakout if supported with even/new and volume.
4. If breakout support with volume and positive events, we may see 26500 and 26900 levels quickly.
Note – if you liked this analysis, please boost the idea so that other can also get benefit of it.
Also follow me for notification for incoming ideas.
Also Feel free to comment if you have any input to share.
Join me on live stream for real time update.
Disclaimer: This analysis is for educational purposes only and does not constitute investment advice. Please do your own research (DYOR) and check with your financial advisor before making any trading decisions.

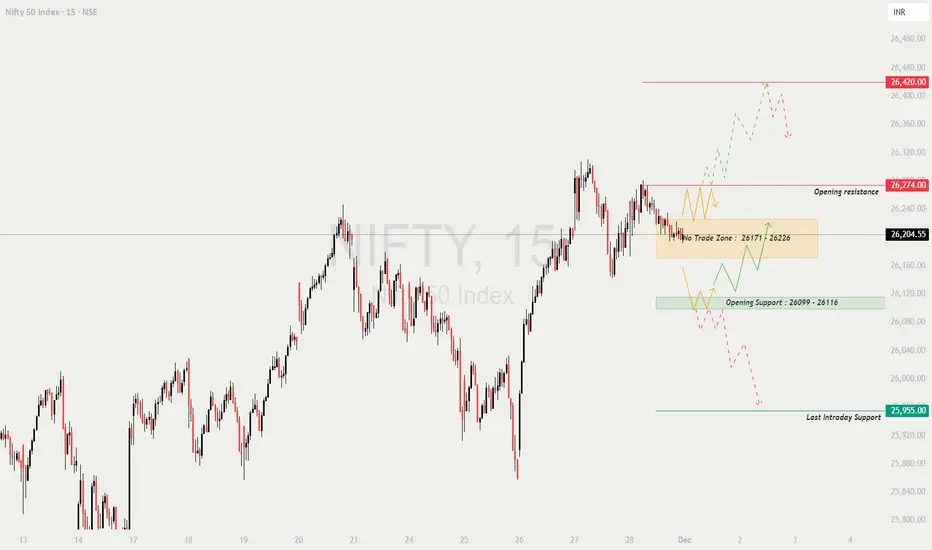
NIFTY : Trading levels and Plan for 01-Dec-2025📊 NIFTY TRADING PLAN — 01 DEC 2025
Nifty closed near 26,204, positioned right above the No-Trade Zone (26,171–26,226) and below the Opening Resistance (26,274).
The market is currently compressing inside a value area, meaning the reaction at the opening price will decide the day’s direction.
This session has clean levels for trend continuation and clear reversal zones, so disciplined execution is key.
🔍 Key Intraday Levels
🟧 No Trade Zone: 26,171 – 26,226
🟥 Opening Resistance: 26,274
🟥 Major Resistance: 26,420
🟩 Opening Support Zone: 26,099 – 26,116
🟩 Last Intraday Support: 25,955
🟢 SCENARIO 1 — GAP-UP OPENING (100+ Points)
If Nifty opens around 26,300–26,360, it will open near or above the resistance cluster.
If price sustains above 26,274 for 10–15 mins →
⭐ Upside targets → 26,330 → 26,365 → 26,420 (Major Resistance)
This is the bullish continuation zone.
If price rejects 26,274–26,300, expect a drop toward:
➡️ 26,226 → 26,171
Best long setup →
Breakout above 26,274, followed by retest and a strong green candle.
Avoid shorting immediately in a gap-up — wait for a clean rejection wick.
📘 Educational Note:
Gap-ups near resistance often trap impatient buyers.
Always wait for a retest confirmation rather than buying the first candle.
🟧 SCENARIO 2 — FLAT OPENING (Near 26,180–26,220)
A flat open keeps Nifty inside the No-Trade Zone (26,171–26,226) — expect choppy movement initially.
Only trade after a breakout from the zone:
— Above 26,226 → Trend resumes upward
— Below 26,171 → Downtrend resumes
Breakout above 26,226 →
Targets → 26,260 → 26,274 → 26,330
Breakdown below 26,171 →
Targets → 26,099 → 26,060
Do NOT take trades inside 26,171–26,226.
This zone is deliberately marked as confusing and unreliable.
💡 Educational Tip:
Flat openings are ideal to observe market intent.
The first directional breakout after 15–20 mins usually leads the entire session.
🔻 SCENARIO 3 — GAP-DOWN OPENING (100+ Points)
A gap-down near 26,080–26,120 places price into the Opening Support Zone (26,099–26,116).
If support 26,099–26,116 holds with bullish rejection →
Upside targets → 26,171 → 26,226 → 26,274
If support breaks decisively →
Next downside → 26,020 → 25,955 (Last Intraday Support)
A strong bounce from 25,955 is a potential high-probability reversal zone.
If 25,955 breaks with volume →
Deeper downside → 25,880 → 25,825
📘 Educational Note:
Gap-down into a clean support often produces high-quality reversal trades —
but only once a higher low forms. Never pre-empt the reversal.
💼 RISK MANAGEMENT TIPS FOR OPTION TRADERS 💡
Avoid trading the first 5 minutes — volatility is artificial.
Prefer ATM or ITM options for directional clarity.
SL should be based on chart levels, not premium amount.
Avoid averaging losers — if the structure breaks, exit immediately.
Use partial booking after each breakout target.
When VIX is low → Option buying works well.
When VIX rises → Switch to hedged strategies (spreads).
⚠️ Golden Rule:
Protect your capital. The goal is consistency, not hitting home runs every day.
📌 SUMMARY
Bullish above → 26,226
Targets → 26,260 → 26,274 → 26,330 → 26,420
Bearish below → 26,171
Targets → 26,116 → 26,060 → 25,955
Strong Reversal Zones:
🟩 26,099–26,116 (Opening Support)
🟩 25,955 (Major Support)
🟥 26,274 (Opening Resistance)
🟥 26,420 (Major Supply Zone)
No-Trade Zone:
⚠️ 26,171–26,226
🧾 CONCLUSION
Nifty will take a clear direction only after breaking out of the No-Trade Zone.
Trend clarity will come from:
✔️ A breakout above 26,226
✔️ A rejection from 26,274
✔️ A breakdown below 26,171
✔️ A bullish reversal from 26,099 or 25,955
Wait for confirmation; avoid overtrading in consolidation zones.
⚠️ DISCLAIMER
I am not a SEBI-registered analyst.
This analysis is for educational purposes only.
Always consult a certified financial advisor before trading or investing.
1-Day (Daily) & 4H Chart — What It Says Now🔎 1-Day (Daily) Chart — What It Says Now
📌 Moving Averages Extremely Supportive
All key moving averages — 5, 10, 20, 50, 100, and 200 DMA — continue to trend upward, with price comfortably trading above them.
This alignment reflects:
strong underlying demand
a sustained uptrend
buyers active on dips
Trend structure: Clean, bullish, and stable.
📌 Momentum Indicators Point Upwards
RSI (14) hovering in mid-60s → bullish but not overbought
MACD remains in positive territory, signal line crossover holding
Stochastic %K is elevated → reflects strength and sustained momentum
Overall, momentum is firmly bullish, with no signs of exhaustion yet.
📌 Pivot Levels Active
Price is reacting near key pivot zones, meaning:
Intraday swings may occur
Breakouts or rejections can come quickly
Supports/resistances are likely to be respected
This adds importance to short-term decision zones.
📌 Overall Daily Trend
✔ Strong uptrend
✔ Healthy momentum
✔ Above all major moving averages
✔ Buyers retain dominance
Bottom Line:
Nifty’s daily structure is bullish. Trend remains intact unless key support levels break decisively.
⏳ 4-Hour (4H) Chart — Short-Term Market Behavior
The 4H chart adds more detail to shorter-term moves and shows the internal strength of the ongoing trend.
📌 4H Trend Still Up, but Entering a Decision Zone
Price action shows:
Higher lows
Higher highs
Strong support clusters on dips
Sellers showing mild presence near upper resistances
This timeframe suggests mild consolidation within a bullish structure.
📌 4H Indicators
RSI mildly elevated
MACD flattening slightly as price approaches resistance
Price compression possible before a breakout
This hints at short-term stabilization — a pause rather than reversal.
📈 4-Point Broader Chart / Market Outlook (Short → Medium Term)
1️⃣ Near-Term Upside Target / Resistance Zone
Key resistance seen at 26,440 – 26,800.
This is the zone to watch for:
Breakout → fresh rally
Rejection → consolidation or dip
A decisive close above this range may open the gate for new highs.
2️⃣ Key Support Levels to Track
Immediate support: 26,100 – 26,200
If this breaks, deeper supports lie near previous consolidation levels.
As long as Nifty holds above these, the structure remains bullish.
3️⃣ Volatility & Consolidation Risk
Despite bullish trend, momentum is steady, not euphoric:
ADX not extremely strong → trend is healthy but not overheated
Possible sideways movement
Integrated consolidation before next leg
Ideal for range trading until breakout clarity emerges.
4️⃣ Sectoral & Breadth Context
Even though headline Nifty is strong:
Media, Realty, IT have underperformed
Breadth is not fully aligned with index strength
Heavyweight stocks driving the rally
Sector rotation may be key for medium-term sustainability.
🎯 Key Scenarios Going Forward
📌 1. Bullish Continuation (High Probability)
If Nifty holds 26,100–26,200 and breaks 26,440–26,800 →
Upside expansion likely, trend remains intact.
📌 2. Range / Consolidation (Likely Before Breakout)
Mixed breadth + moderate volatility suggests
Brief sideways movement before decisive direction.
📌 3. Pullback / Correction (Risk Trigger)
If supports break along with sectoral weakness →
Nifty may test lower supports with increased volatility.
💼 What This Means for Traders & Investors
For Traders
Bullish bias is intact
Prefer trades on breakouts or support bounces
Avoid premature entries near resistance
Manage risk due to short-term consolidation risk
For Medium-Term Investors
Trend is not showing signs of topping
Continue exposure but track sectoral leadership
Focus on stock-specific strength rather than index alone
Risk Management
Avoid over-leveraging as volatility pockets may emerge
Respect support levels
Watch the 26,440–26,800 zone for next directional cue
📌 Final Combined View (1D + 4H)
Nifty remains in a strong, well-supported uptrend across both timeframes.
Daily chart shows broad strength → 4H chart shows controlled consolidation.
Market is setting up for a potential breakout, though short-term range-bound action is likely until price crosses key levels.
