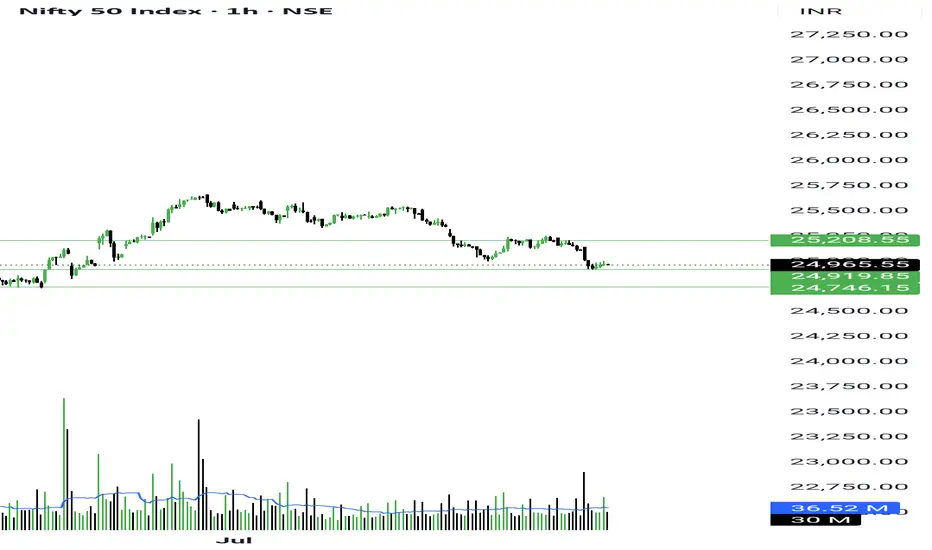
NIFTY Analysis – 25 july 2025 ,Morning update at 9 amPre-market Price Expectation
Forecasting an open near 25025 and expected slip to 25007 is helpful for pre-market planning.
Scenario Planning
Bearish Case: Break below 25008 Watch for bottleneck Next target WILL BE 24929
Bullish Case Hold above 25100 Move to 25150–25250
4. Clear Support AND Resistance Levels
Support:
25008
24928
24889
Resistance:
25150
25271
25309
Niftyprediction

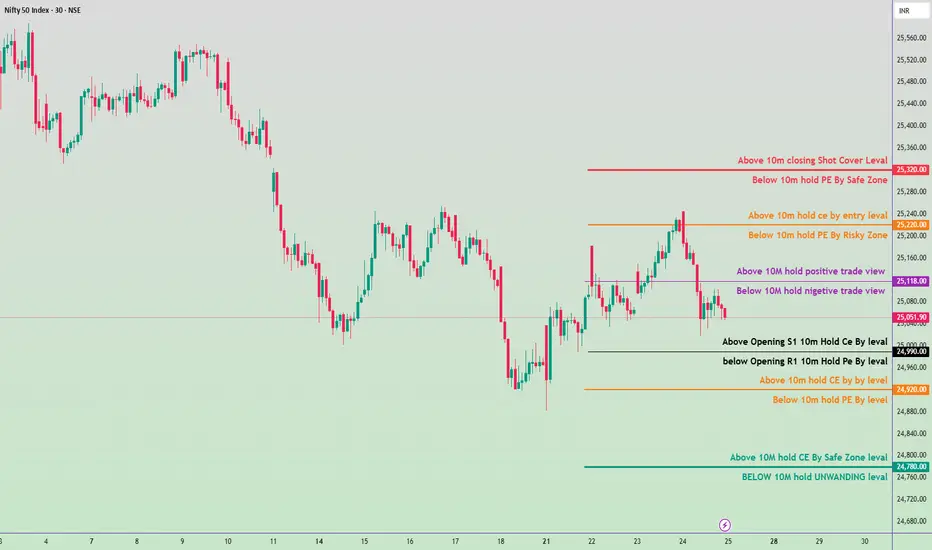
Nifty 50 Intraday Trade Plan for 25th July 2025🔍 Trade Zones & Strategy Breakdown:
🔴 Strong Resistance Zone:
25,320 – Above 10M Closing Short Cover Level
⚠️ If price moves above this level, expect short covering.
CE (Call Option) can be held with strict SL (stop loss) below 25,280.
🟠 Safe-to-Risky PE Holding Zone:
25,280 – Below 10M Hold PE by Safe Zone
25,220 – Below 10M Hold PE by Risky Zone
🟡 Between these levels is the PE (Put Option) hold zone with decreasing safety.
🟧 Entry CE Level (Low Risk Long Entry):
25,240 – Above 10M Hold CE by Entry Level
🟣 Neutral Zone / Trend View Levels :
25,118 – Above 10M → Positive Trade View
25,118 – Below 10M → Negative Trade View
👀 This is a sentiment-shifting level. Break above or below can set the trend for the day.
⚫ Opening Range Based Action:
24,990 – Above Opening S1 → Hold CE (Call Option)
24,990 – Below Opening R1 → Hold PE (Put Option)
🟨 R eversal/Entry Confirmation Area:
24,920 – Above 10M Hold CE by Level
24,880 – Below 10M Hold PE by Level
🟩 Support & Final Defense Zone:
24,800 – Above 10M Hold CE by Safe Zone
24,760 – BELOW 10M = Unwinding Level
⛔ If price falls below 24,760, aggressive unwinding or fresh PE (Put Option) entry possible.
NIFTY Analysis – 24 july 2025 ,Morning update at 9 am,new updateNIFTY UPDATE – 24 July 2025 (Live Chart Analysis)
Market Context:
Current Price: 25,186
Trend: Mild rejection from near 25250 level, testing resistance.
Upside Plan:
If bottleneck/squeeze pattern forms near 25250–25293 zone, then:
Upside breakout possible toward 25370.
Target Zone: 25293 (first), 25370 (final).
Consolidation likely between 25250 – 25293. Wait for a strong candle close above 25293 to buy for 25370.
Downside Plan:
If Nifty falls below 25150, we may see:
Quick slide to 25078 (next support).
Crucial zone: 25160---25150. if this zone fails, sell-on-rise strategy valid.
Further targets: 25023 (demand zone), 25008 (gap fill zone).
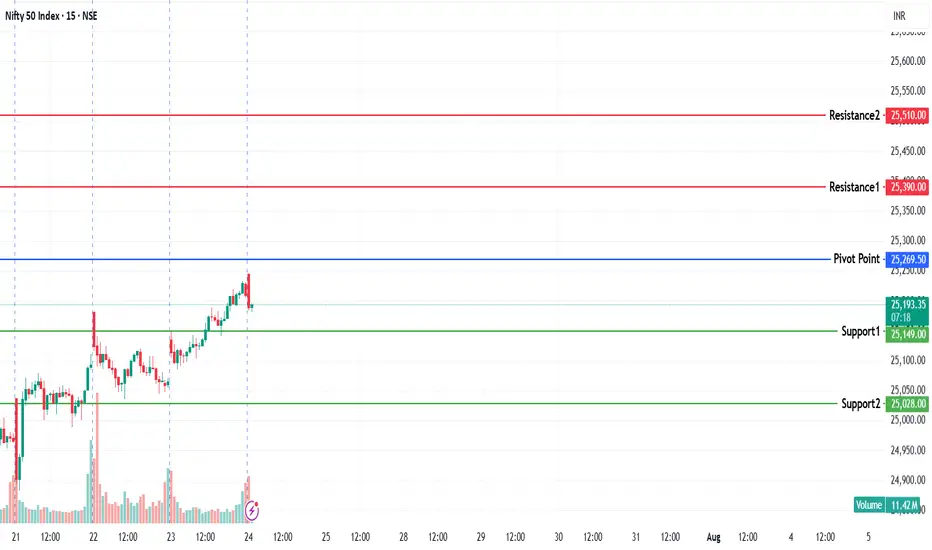
NIFTY KEY LEVELS FOR 24.07.2025NIFTY KEY LEVELS FOR 24.07.2025
If the candle stays above the pivot point, it is considered a bullish bias; if it remains below, it indicates a bearish bias. Price may reverse near Resistance 1 or Support 1. If it moves further, the next potential reversal zone is near Resistance 2 or Support 2. If these levels are also broken, we can expect the trend.
If the range is narrow, the market may become volatile or trend strongly. If the range is wide, the market is more likely to remain sideways
📢 Disclaimer
I am not a SEBI-registered financial adviser.
The information, views, and ideas shared here are purely for educational and informational purposes only. They are not intended as investment advice or a recommendation to buy, sell, or hold any financial instruments.
Please consult with your SEBI-registered financial advisor before making any trading or investment decisions.
Trading and investing in the stock market involves risk, and you should do your own research and analysis. You are solely responsible for any decisions made based on this research.
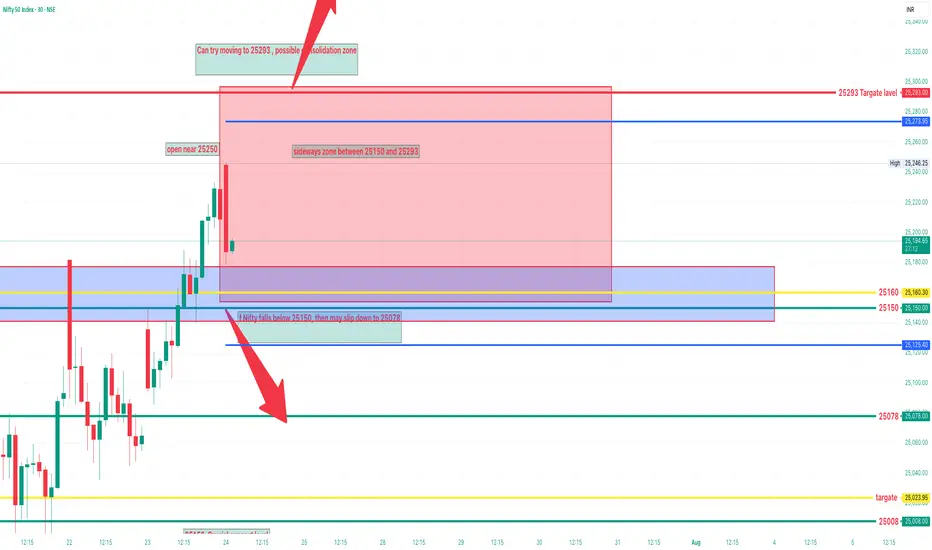
NIFTY Analysis – 24 july 2025 ,Morning update at 9 amLikely to open near 25250
Can try moving to 25293 possible consolidation zone.
If a Bottleneck pattern forms here, then possible upmove to 25370.
If Nifty falls below 25150, then may slip down to 25077.
No clear breakout above 25293 or breakdown below 25150,Avoid big trades, consider scalping only

25400 coming soon!!As we can see despite the weak opening, NIFTY showed strong REVERSAL which not only shows good accuracy but also shows sticking to our plan with patience does pay off most of the times. Hence, following the view we should remain long on the position as in smaller TF, it can also be seen that it is forming more like a W pattern which can show good upmove till 25400 so plan your trades accordingly and keep watching everyone.

niftyin nifty tomorrow may be gap up and sideways. we can see a doji candle tomorrow. be cautious on upside.may be a we see reversal from friday.
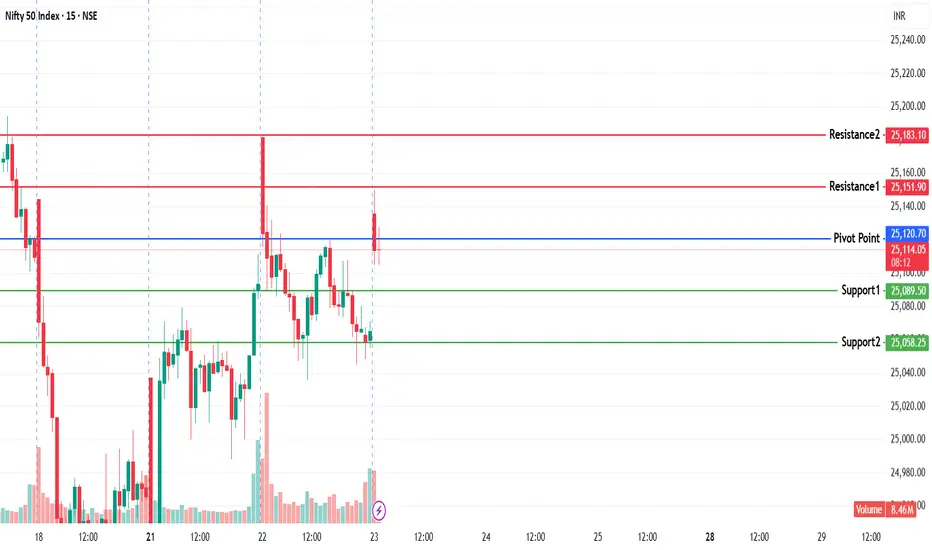
NIFTY KEY LEVELS FOR 23.07.2025NIFTY KEY LEVELS FOR 23.07.2025
If the candle stays above the pivot point, it is considered a bullish bias; if it remains below, it indicates a bearish bias. Price may reverse near Resistance 1 or Support 1. If it moves further, the next potential reversal zone is near Resistance 2 or Support 2. If these levels are also broken, we can expect the trend.
If the range is narrow, the market may become volatile or trend strongly. If the range is wide, the market is more likely to remain sideways
📢 Disclaimer
I am not a SEBI-registered financial adviser.
The information, views, and ideas shared here are purely for educational and informational purposes only. They are not intended as investment advice or a recommendation to buy, sell, or hold any financial instruments.
Please consult with your SEBI-registered financial advisor before making any trading or investment decisions.
Trading and investing in the stock market involves risk, and you should do your own research and analysis. You are solely responsible for any decisions made based on this research.
NIFTY Analysis – 23 july 2025 ,Morning update at 9 amNIFTY Technical Outlook Today
Pre-Market Insight
NIFTY spot closed below 24% false level
Short covering is visible – a bullish sign.
Watch for price behavior around 25150, a crucial level.
Market Scenarios Today
Bullish Possibility (If holds above 25150)
May open near 25150
May rise to 25219, then possibly up to 25298 if a Bottle. ki. neck ki tarah ka pattern forms.
squize pattern is expected today in bb band track this carefully.
Bearish Possibility (If fails to sustain above 25150)
Downside targets:
25014
24896
24807

Nifty 50 Intraday Plan for July 23, 2025📌 For more insights & live explanations,
👉 Visit my YouTube channel – Click the icon above ☝️
🔺 Bullish Zones (Call Side - CE):
25,138 – Positive Trade View Start
If the market sustains above this level for 10 minutes, the sentiment turns positive.
Possible intraday up-move.
Look for CE entries.
25,260 – CE Entry Level
Strong confirmation of bullish breakout.
Entry point for aggressive CE buyers.
25,380 – Short Covering Zone
If price closes above this, short-sellers may exit in panic.
Expect a sharp up-move / breakout.
24,960 & 25,040 – CE Hold Zones
If holding CE positions, monitor these levels.
Supportive price areas where bulls may defend.
24,760 – Safe CE Zone
A very strong support zone.
If price bounces from here, good for fresh CE trades.
🔻 Bearish Zones (Put Side - PE):
25,120 – Negative Trade View
If price breaks this level and stays below 10 mins, bias turns bearish.
25,018 – Opening R1 PE Hold
Below this, market may gain bearish strength.
Short trades may get active.
24,938 – PE Hold Level
Important support zone.
Break here can give aggressive PE momentum.
24,700 – Unwinding Level
If price sustains below this, it can trigger long unwinding.
Strong bearish continuation expected.

nifty1. if nifty touch raising channel resistance tomorrow then pattern will change then nifty is sideways to bullish in short-term .
2. if nifty touch resistance on 23 july then only we get perfect entry for short.
note: on 23 july we can see doji candle in daily .if not then wait.
tomorrow nifty is bullish. any day we see a doji candle above 25300. then we can sell on next day or on the same day after 3pm.
if you want to short on top then keep eye on 23 july. on 23 if touch rising channel resistance then we can short.
but,
on 23 nifty is sideways and form a doji candle in daily basis.

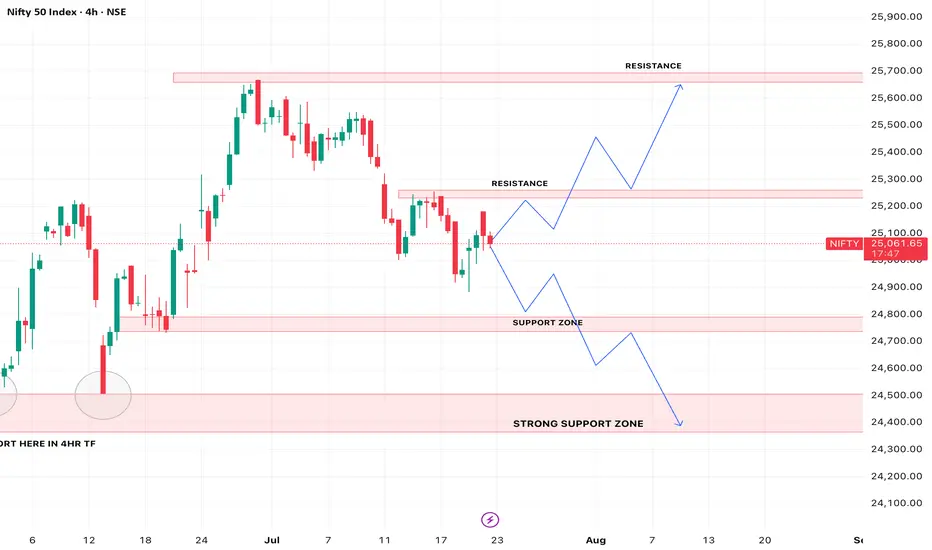
NIfty50 analysis for 23/07/2025nifty has been in a bearish trend over the past week and recently faced a strong rejection from the 25180–25200 zone, which aligns with a key resistance level on the daily time frame. price action suggests a possible retracement toward the 24780–24800 support zone. this area holds significance as a potential demand zone. it’s crucial to observe price behavior around this level — a strong reaction here could offer clues for the next directional move. wait for confirmation before taking any fresh positions.
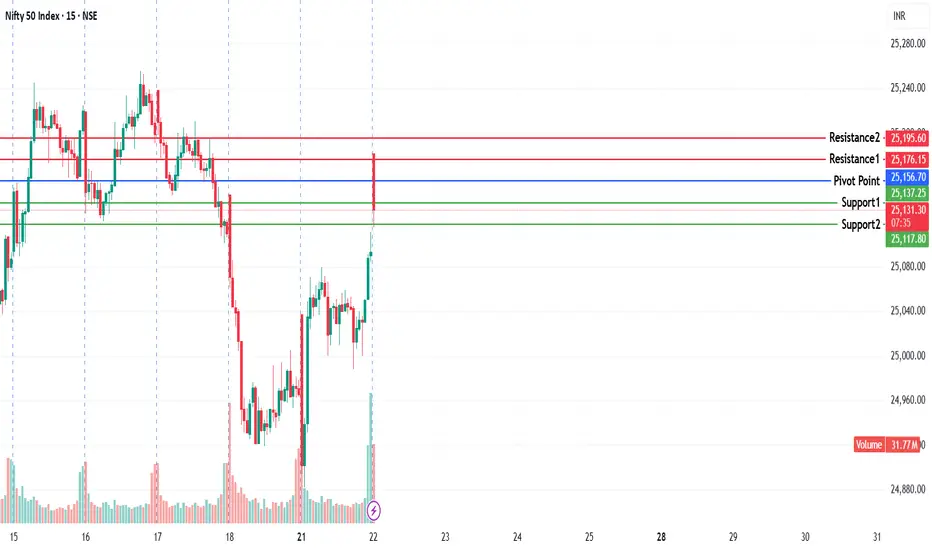
NIFTY KEY LEVELS FOR 22.07.2025NIFTY KEY LEVELS FOR 22.07.2025
If the candle stays above the pivot point, it is considered a bullish bias; if it remains below, it indicates a bearish bias. Price may reverse near Resistance 1 or Support 1. If it moves further, the next potential reversal zone is near Resistance 2 or Support 2. If these levels are also broken, we can expect the trend.
If the range is narrow, the market may become volatile or trend strongly. If the range is wide, the market is more likely to remain sideways
📢 Disclaimer
I am not a SEBI-registered financial adviser.
The information, views, and ideas shared here are purely for educational and informational purposes only. They are not intended as investment advice or a recommendation to buy, sell, or hold any financial instruments.
Please consult with your SEBI-registered financial advisor before making any trading or investment decisions.
Trading and investing in the stock market involves risk, and you should do your own research and analysis. You are solely responsible for any decisions made based on this research.
NIFTY Analysis – 22 july 2025 ,morning update at 9 amMarket Status
Nifty closed below 22%
But short covering is strong, so market may open higher.
Expected Movement:
Market may open near 25150.
If it holds 25150 and forms a bottleneck pattern, it may move up:
First Target 25218
If breakout happens 25298
Situation
Nifty holds 25150 THEN Buy above 25218 for 25298
Nifty breaks below 25150 THEN Sell for target 25013, 24896
Price goes sideways THEN Wait and trade only after breakout
Sideways (Consolidation) Zone:
Sideways Zone ---- Between 25013 and 25218
Because
25013 is strong support (buyers defend here)
25218 is strong resistance (sellers may come in)
Price may move up and down within this range before breakout OR breakdown

REVERSED as analysed! Will it sustain..?As we can see NIFTY reversed strongly exactly from our demand zone as analysed which is both a sign of REVERSAL we were looking for and confirmation of bullish bias. Hence one can plan going LONG from here with clear stoploss of candle's low closing basis. We can expect NIFTY to show 25250-25300 levels in coming trading sessions before facing any rejection so plan your trades accordingly and keep watching everyone

Nifty 50 Intraday Plan for July 22, 2025🔼 Bullish Levels (Call Side - CE):
Above 25,038 : If the market opens and sustains above this level for 10 minutes, you can consider buying CE. This is the first breakout point, indicating possible upward movement.
Above 25,128: Holding above this level indicates a positive trade view. Momentum is expected to increase, and buyers may become more aggressive. Good zone to initiate or add to CE positions.
Above 25,260 : This is the CE entry level where breakout confirmation happens. If price reaches and sustains this zone, it signals strong bullish strength.
Above 25,380 : This is marked as the short-covering zone. If the price reaches here, it means many short traders may exit, creating a spike. Ideal for booking profits on CE trades.
🔽 Bearish Levels (Put Side - PE):
Below 25,038 : If the price fails to sustain above this level and breaks down with 10-minute candle confirmation, it indicates weakness. PE trades can be considered from here.
Below 24,938 : This level is a clear PE entry level. Sustained trading below this suggests downward continuation.
Below 24,920 : This is the risky PE zone. If the market trades here, PE positions should be handled with caution unless strong selling pressure is seen.
Below 24,800 : This is a safe PE zone. Breakdown below this signals confirmed bearish sentiment, and you can aggressively hold PE options.
Below 24,780 : This is the unwinding level, meaning big players may start exiting their positions, possibly triggering sharp declines. Ideal for booking PE profits or trailing stop-loss tightly.

NIFTY KEY LEVELS FOR 21.07.2025NIFTY KEY LEVELS FOR 21.07.2025
If the candle stays above the pivot point, it is considered a bullish bias; if it remains below, it indicates a bearish bias. Price may reverse near Resistance 1 or Support 1. If it moves further, the next potential reversal zone is near Resistance 2 or Support 2. If these levels are also broken, we can expect the trend.
If the range is narrow, the market may become volatile or trend strongly. If the range is wide, the market is more likely to remain sideways
📢 Disclaimer
I am not a SEBI-registered financial adviser.
The information, views, and ideas shared here are purely for educational and informational purposes only. They are not intended as investment advice or a recommendation to buy, sell, or hold any financial instruments.
Please consult with your SEBI-registered financial advisor before making any trading or investment decisions.
Trading and investing in the stock market involves risk, and you should do your own research and analysis. You are solely responsible for any decisions made based on this research.

NIFTY Analysis – 21 july 2025 ,morning update at 9 amNIFTY Price Levels:
Expected Opening:-- Near 24985 (flat)
Upside Watch: May test 25035
Downside Trigger: If Nifty fails to hold 24985, potential fall towards:
24896 (Support 1)
24807 (Support 2)
nifty support -24897, 24807, 24722
Resistance -25035, 25122, 25219
Wait for Pattern Confirmation:
Bottleneck patterns often result in fakeouts, so avoid premature entries.
Use BOD or SOR Strategy
BOD (Buy on Dip): Only if strong bounce from support with volume.
SOR (Sell on Rise): If price fails to sustain above resistance zones.
Scalping Opportunity:
Due to bottleneck formation, expect a narrow range
Opening near 24985, range-bound likely due to bottleneck.
Upside capped near 25035 unless breakout on volume.
Watch 24896 and 24807 for bounce or breakdown.
Prefer scalping or small quantity BOD/SOR trades post 9:30 AM
Nifty is opening flat near 24985 (inside this range).
Bearish Bottleneck pattern means price is getting compressed (low volatility).
Both buyers and sellers are active inside this tight band but no clear breakout yet.
Scalping is best strategy in sideways zones, with small targets and stop-loss.

NIFTY Intraday Trade Setup For 21 Jul 2025NIFTY Intraday Trade Setup For 21 Jul 2025
Bullish-Above 25015
Invalid-Below 24965
T- 25150
Bearish-Below 24910
Invalid-Above 24960
T- 24640
NIFTY has closed on a slight bearish note with 0.72% cut last week. Index has reached 50 EMA in daily TF which is placed near 24900. A bounce from EMA can be expected. However below 24900 index may dive in the next week also. On a flat opening above 25015 a bullish move towards 25150 can be expected. Intraday resistance is placed at the 25150 as per half bat pattern. On a flat opening below 24910 index will test 24640. Plan trades on 15 Min candle close.
In case of a big gap up/down, wait till 10 o'clock and mark the high and low of the trading range (5MIN). Trade on this range breakout.
==========
I am Not SEBI Registered
This is my personal analysis for my personal trading. Kindly consult your financial advisor before taking any actions based on this.

A Bounce in Nifty but... In the market, it doesn’t work like — “The market has fallen enough, so now it should go up.” Even worse is putting your money into trades just because you feel that way.
Markets fall because of fear, and overcoming fear takes time. In fact, fear often grows stronger before it fades.
That’s exactly what is happening right now.
So don’t trade with the mindset — “The market has dropped a lot, it should rise now.”
Use this time to identify setups that have already broken out and are now giving a retest or have completed one.
For now, just build your watchlist. Trade only when you see stopping volume or a pivot low forming.
Remember — Markets are driven by people. And people trade based on either Fear or Greed. Their fear has no bottom, and greed has no top.
Be patient. I’m sure you will get much better opportunities soon.
That said, a bounce can still be expected because the heaviest sector from the last rally — Defence — is now showing mean reversion.
Talking about #Nifty,
On Friday, it formed a Reversion Candle. Interestingly, seller volume was 40 million lower than Thursday’s candle.
A big candle with such low volume usually signals accumulation — which means smart money has started buying.
Since it’s earnings season, our focus will remain on the Earnings Pivot strategy.
NSE:NIFTY levels:
- Support - 24920. Good if consolidate here for 1-2 days.
- Resistance: 25150 — above this, strong short covering can push it to 25400
But I doubt if this bounce will be buyable yet because next week is monthly expiry. Bears may close their shorts, so the market might just move up to grab short-side liquidity around 25333.
However, if we get a monthly close above 25333, that will be a strong bullish sign.
NSE:BANKNIFTY levels:
- Support: 55950
- Resistance: 56750
Sector-wise, NSE:CNXPHARMA and NSE:CNXFINANCE are showing traction.
Still, I strongly suggest sticking to stocks with Earnings Pivot setups.
In this market, that’s the safest strategy.
My this week's trades:
NSE:IXIGO - BOOKED ON UPPER-CIRCUIT
NSE:EIEL - 12% BOOKED
NSE:GARUDA - 19.5% BOOKED
NSE:DENTA - 18% BOOKED
NSE:CUPID - - 23% AND HOLDING
NSE:SPORTKING - 16% AND HOLDING
That’s all for now.
Take care.
Have a profitable week ahead.
Monday Trade Plan (Nifty 50) 🔼 Bullish Levels (Call Side Entry):
Above 25,008
🔹 Hold CE (Call) — Positive trade view.
Above 25,118
🔹 Hold CE by Entry Level
🚨 Below this: Risky Zone for PE (Put)
Above 25,218
🔹 10 min Closing Short Cover Level
✅ Strong momentum expected above this zone
🔽 Bearish Levels (Put Side Entry):
Below 25,000
🔻 Hold PE — Negative trade view.
Below 24,888
🔻 Opening R1 10m — Hold PE by level
Below 24,788
🔻 Hold PE by level
Below 24,688
🔻 Hold PE by Safe Zone level
Below 24,600 (Approx)
🧯 UNWINDING ZONE
🔻 Strong downward momentum expected
⚠️ Mid-Zone / Risk Areas:
Between 25,000 – 25,008: No clear direction
Between 25,088 – 25,118: Risky Zone for PE
Between 24,788 – 24,888: Rangebound area, watch for breakout

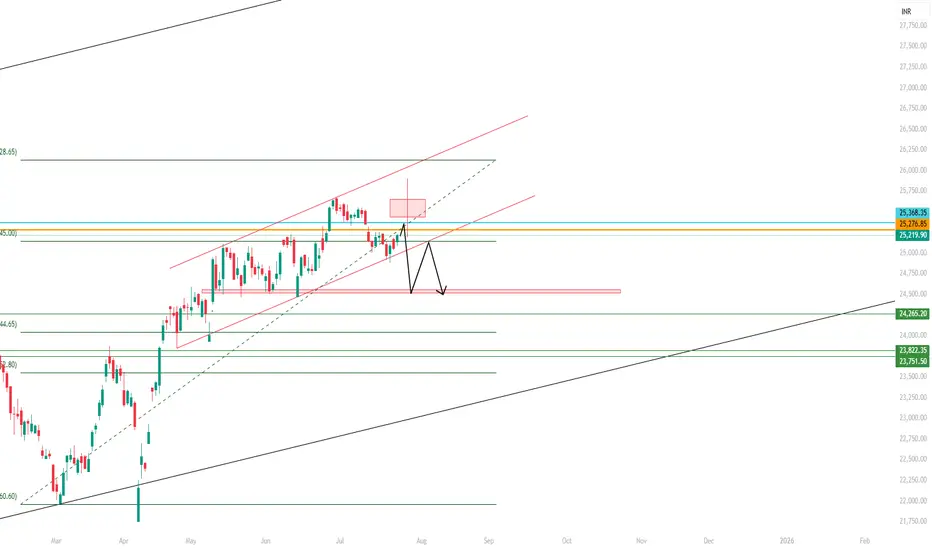
niftynifty on 2 support zone rising channel and fibbo 60%. nifty may be reverse from here upto 25400. may be on august 1 week. we see nifty 24550-24500 level.

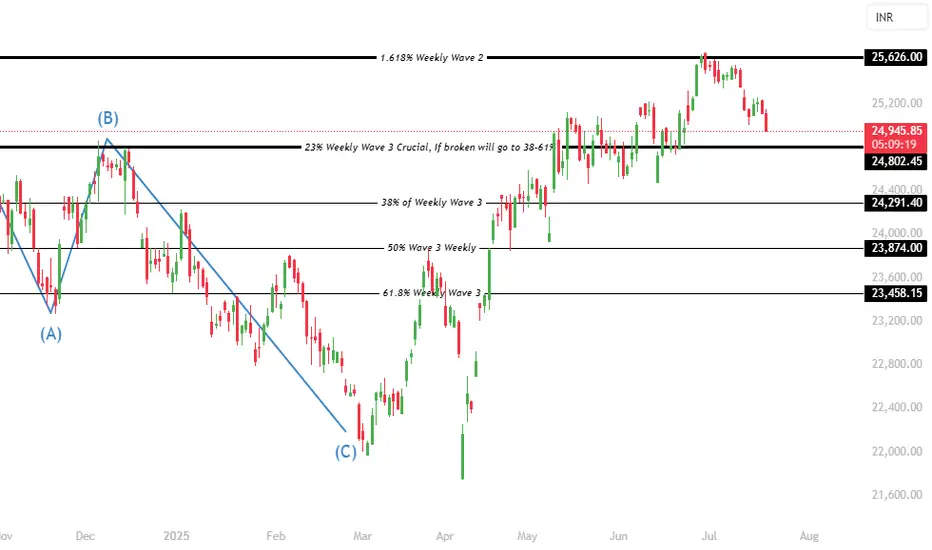
Nifty 50 Trend Analysis A detailed wave analysis in larger times frames indicates that nifty is beginning to trigger a sharp or moderate momentum deep correction. The correction & downtrend can last upto 23874 & 23458 potentially. In a downtrend, institutions will sell on every rise, hence its not the right time to make new investments directly in the stocks. Currently nifty is trading at 25073 and this swing momentum can go upto 24802 without reversals, and 24802 will play a crucial role but since the wave 3 has completed its maximum levels we need to brace for 23874 & 23458.