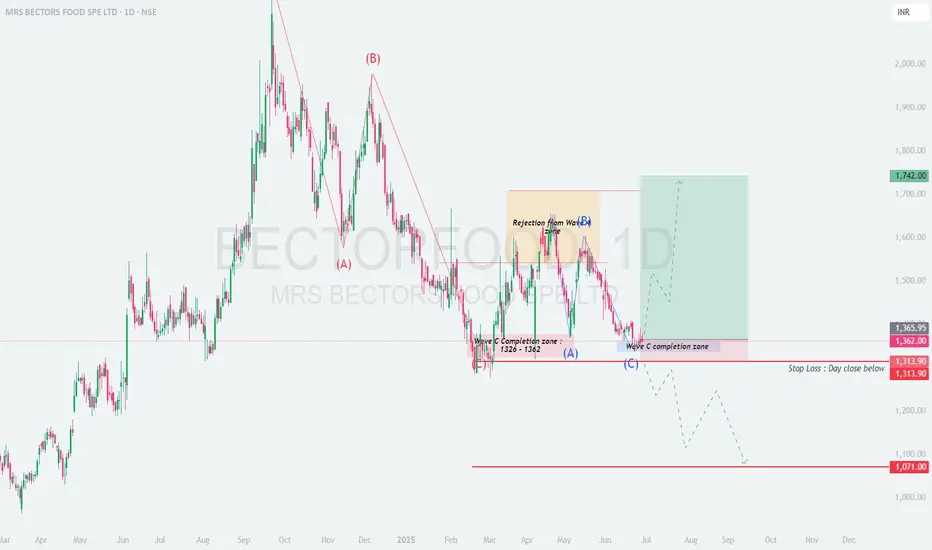
BECTORFOOD - Long Set Up at WAVE C completion zone\ 🛑 MRS BECTORS FOOD (NSE: BECTORFOOD) - Daily Chart Analysis\
\ 📍 Setup:\
Classic \ ABC corrective structure\ likely completed.
📉 Wave (A) → ⚡ Retracement (B) → 📉 Final leg (C) into a \ high-probability support zone\ .
---
\ 🟩 Wave C Completion Zone: ₹1326 – ₹1362\
• Price entered and respected this \ key demand zone\ .
• Previously acted as a strong support + rejection area.
• Now showing early signs of accumulation — possible bottom formation.
---
\ 📈 Long Trade Idea\
\ \ Entry Zone\ : ₹1326 – ₹1365
\ \ Stop Loss\ : Day close below \ ₹1313.90\
\ \ Target 1\ : ₹1500
\ \ Target 2\ : ₹1742
\ \ Risk-Reward\ : \~1:3+
---
\ ⚠️ Invalidation Scenario\
• \ Close below ₹1313.90\ will invalidate the bullish structure.
• Price may then drift toward \ ₹1071\ — opening bearish continuation possibility.
---
\ 🧠 Trade Notes\
• Wait for \ bullish candle or strong volume\ confirmation near the zone.
• Zone has proven history of \ strong rejections\ .
• Good setup for \ swing trades\ with risk-defined entry.
---
\ 📌 Summary:\
Wave C likely completed — positioned for a bounce.
\ Risk-defined long\ setup with significant upside potential.
---
🔔 Like this setup? \ Follow for more real-time Elliott Wave ideas!\
---
\ Disclaimer:\ Not SEBI Registered. For \ educational purposes only\ . Please do your own research before investing.
Niftyprediction
SENSEX INTRADAY LEVELS ( EDUCATIONAL PURPOSE ) 09/07/2025🔹 SENSEX Intraday Trade Plan – 9 July
📊 Analysis: 15-min TF | Execution: 1-min TF
🔵 GAP-UP Opening (Above 83,750)
📌 Plan: Avoid chasing the gap. Look for reversal or a retest
🔁 Entry: Sell below 5-min breakdown or rejection from 83,750–83,800
🛑 SL: 25–30 pts above high
🎯 Target: 83,580 – 83,500
🔻 GAP-DOWN Opening (Below 83,400)
📌 Plan: Avoid panic selling. Wait for price to reclaim or reversal
🔁 Entry: Buy above 5-min high after reclaim or strong bullish candle
🛑 SL: 25–30 pts below low
🎯 Target: 83,600 – 83,750
📏 NORMAL OPEN (Between 83,400–83,750)
🔁 Range Play Setup:
Buy near 83,400–450 (support zone)
Sell near 83,700–750 (resistance zone)
🛑 SL: 20–30 pts beyond level
🎯 Target: 50–70 pts
🚀 Breakout Trade Setup
🔁 Entry: Above 83,800 breakout candle
🛑 SL: Below breakout bar
🎯 Target: 83,900 – 84,000
🔁 Breakdown Trade Setup
🔁 Entry: Below 83,350 breakdown candle
🛑 SL: Above breakdown bar
🎯 Target: 83,200 – 83,100
📌 Note: Stick to risk management. Avoid overtrading in sideways zone. Use confirmation on 1-min candle before entry.

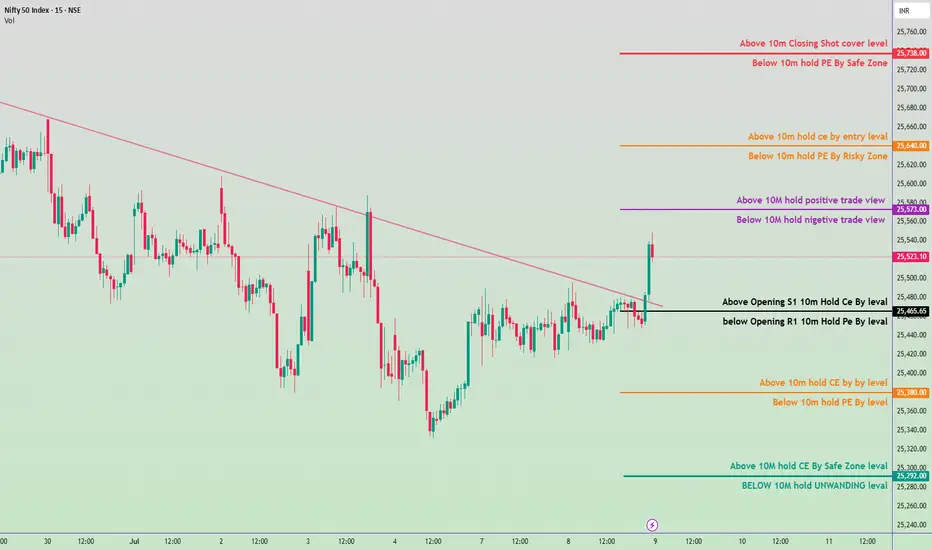
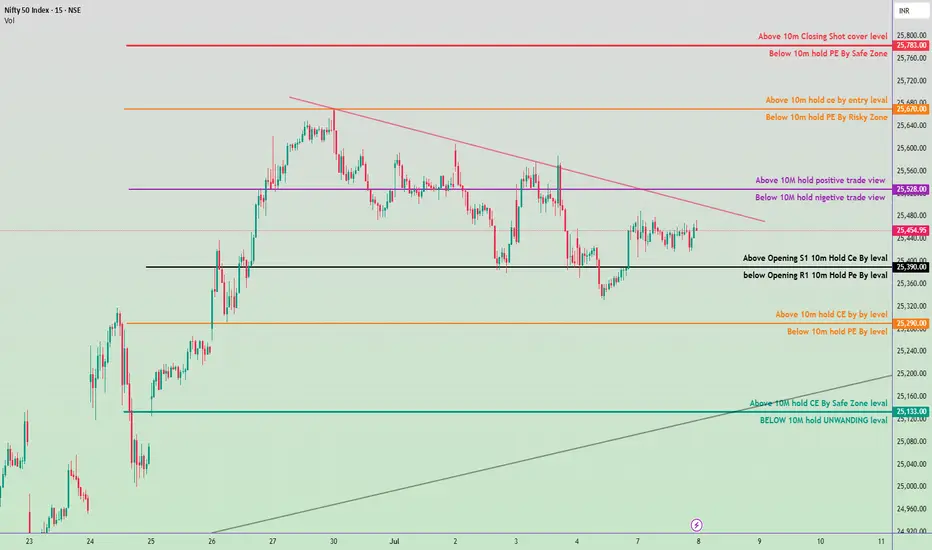
Nifty 50 Intraday Trade Plan for July 9, 2025🔴 Upper Resistance Zones (Short Covering Area)
🔺 25,738.00 – Shot Cover Level
If a 10-minute candle closes above this level, expect short covering – bullish breakout.
If price comes below this after testing, it's a safe zone to hold PE (puts).
🟧 25,640.00 – CE Entry Zone
Above this: Call options (CE) can be held.
Below this: Risky zone for holding PE, volatility may increase.
🟪 25,573.00 – Sentiment Zone
Above this: Positive trade bias.
Below this: Negative trade bias, indicating weakness.
⚫ Midpoint Zone (Opening & Pivot-Based Decision Area)
⚫ 25,465.65 – Opening + S1/R1 Zone
Above this level: Hold CE positions (bullish intraday setup).
Below this level: Hold PE positions (bearish setup).
🟠 Lower Mid-Level (Support/Breakdown Test)
🟠 25,380.00
Above: Intraday buy CE zone.
Below: PE can be held for more downside.
🟢 Bottom Support Zone (Safe Zone / Unwinding Zone)
🟢 25,292.00 – Safe CE Hold Zone
If the price holds above this level after 10 min: safe to hold CE.
🟢 25,282.00 – Unwinding Zone
Below this level: Risk of unwinding and larger sell-off increases.
📌 How to Use This Plan (Summary)
Wait for 10-minute candle confirmations near these levels.
Follow directional bias: CE (calls) if price sustains above levels, PE (puts) if price remains below.
Trade only after confirmation, not just touch.
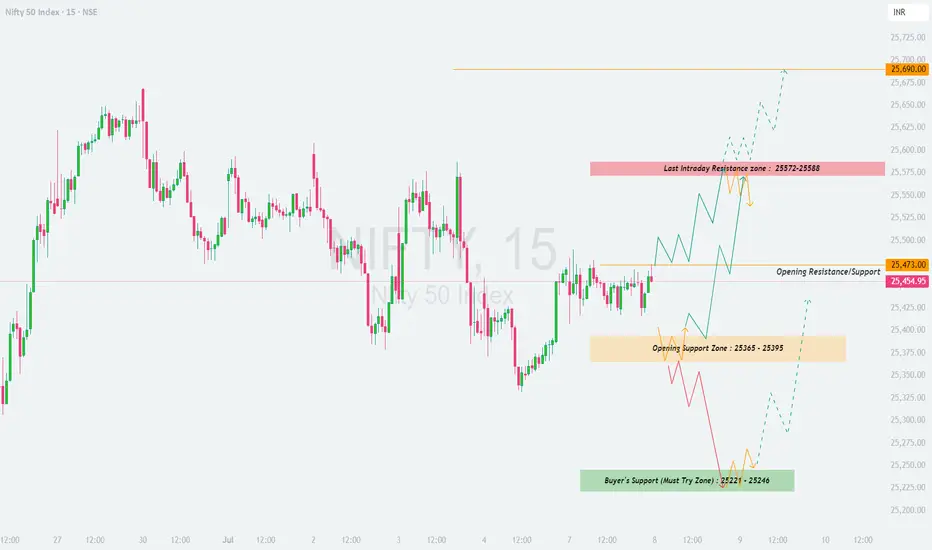
NIFTY : Trading levels and plan for 08-July-2025📊 NIFTY TRADING PLAN – 08 July 2025
(Based on 15-min chart structure – For educational purposes only)
Gap Opening Reference: 100+ pts
Structure favors breakout or reversal play from key zones.
Let price settle in first 15–30 mins before executing any plan.
🔍 Key Zones to Watch:
Opening Resistance/Support: 25,473
Opening Support Zone: 25,365 – 25,395
Buyer’s Must-Hold Zone: 25,221 – 25,246
Last Intraday Resistance: 25,572 – 25,588
Major Resistance (Profit Booking): 25,690
📈 SCENARIO 1: GAP-UP OPENING (100+ pts above 25,473)
If NIFTY opens above 25,572 and sustains, expect price to test the 25,690 zone.
Look for signs of reversal near 25,690 to book longs or consider a short with SL above the zone.
If price fails to hold above 25,572, it may fall back toward 25,473.
📉 SCENARIO 2: FLAT OPENING (within 25,454 – 25,473 range)
Avoid early trades — let the price action confirm direction.
Break above 25,473 can take NIFTY toward 25,572–25,588.
Break below 25,395 may open downside toward 25,246.
📉 SCENARIO 3: GAP-DOWN OPENING (100+ pts below 25,365)
Watch for support near 25,221–25,246 zone — a strong demand area.
If price bounces with bullish structure, a reversal trade can be taken with defined SL.
Break and sustain below 25,221 could invite further selling toward 25,080.
💡 OPTIONS RISK MANAGEMENT TIPS:
Trade only near defined levels with confirmation.
Use spreads (e.g., bull call/bear put) during high volatility to reduce risk.
Avoid buying deep OTM options unless there's a strong trending move.
Always define SL and adhere to position sizing rules.
📌 SUMMARY:
Above 25,473 = Bullish bias
Below 25,365 = Bearish bias
25,221–25,246 = Strong reversal zone
Wait for price action to confirm before taking positions
⚠️ DISCLAIMER: I am not a SEBI-registered advisor. This plan is for educational purposes only. Please do your own research or consult a financial advisor before trading.

NIFTY 50 INTRADAY PLAN – 08 July 2025✅ Bullish Scenario (Call Option / CE Buy Plan):
Above 25,390:
Above Opening S1 – 10m Hold CE By Level
Initiate CE buy with caution.
Above 25,528:
Above 10M Hold – Positive Trade View
Strong bullish sentiment, hold CE confidently.
Above 25,670:
Above 10m Hold CE – Entry Level
CE enters Safe Zone, trend continuation expected.
Above 25,783:
Above 10m Closing – Short Cover Level
Big breakout possible, short covering rally.
🔻 Bearish Scenario (Put Option / PE Buy Plan):
Below 25,390:
Below Opening R1 – 10m Hold PE By Level
Start looking for PE (Put) trades.
Below 25,290:
Below 10m Hold PE By Level
Further downside expected, weakness builds.
Below 25,133:
Below 10M Hold – Unwinding Level
Strong selling / unwinding zone, big downside move likely.
🧠 Important Levels to Watch:
Trend Resistance Zone: 25,528 – 25,670
Support Zone: 25,290 – 25,133
Breakout Zone: Above 25,783
Breakdown Zone: Below 25,133
⚠️ Quick Notes for Traders:
📈 Above 25,528 = Positive view, hold CE
📉 Below 25,390 = Negative view, hold PE
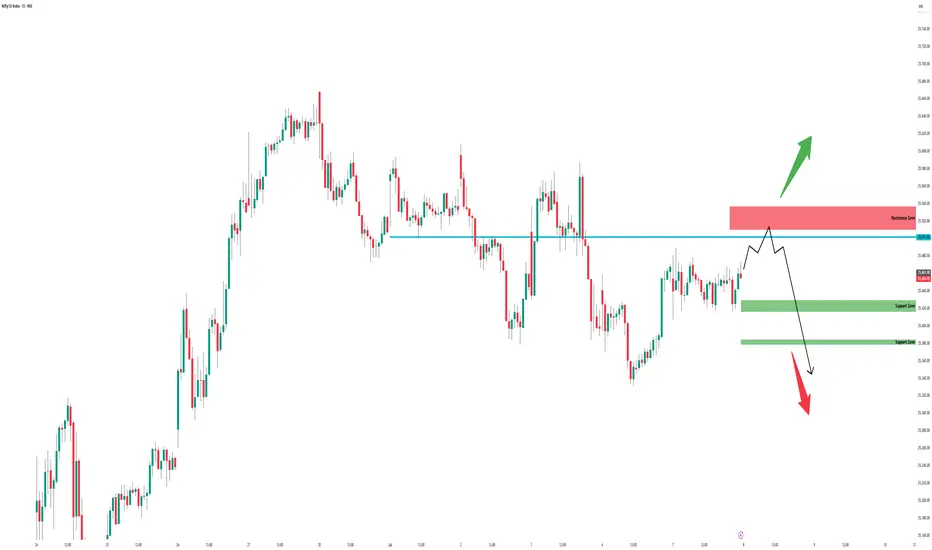
Nifty - Intraday levels & Prediction for - 08 Jul 2025Nifty Prediction for Tomorrow:
Trend : BEARISH reversal
Sentiment : Positive
Expectation : Nifty looks weaker and has high possibility of going down upto 25200/25100 levels. BULLISH only above 25540 if Nifty sustains above the resistance zone.
Look for Buy/Sell at Demand and Supply zone for profitable trades.
Demand and Supply Zones - When price breaks the zone, Demand zone will become Resistance and Supply zone will become Support.
Refer the chart for detailed Intraday Support and Resistance levels.
TVS motors Good to studyNSE:TVSMOTOR
Its on the verge of new Breakout
Good to keep on the radar
Always respect SL & position sizing
========================
Trade Secrets By Pratik
========================
Disclaimer
NOT SEBI REGISTERED
This is our personal view and this analysis
is only for educational purposes
Please consult your advisor before
investing or trading
You are solely responsible for any decisions
you take on basis of our research.

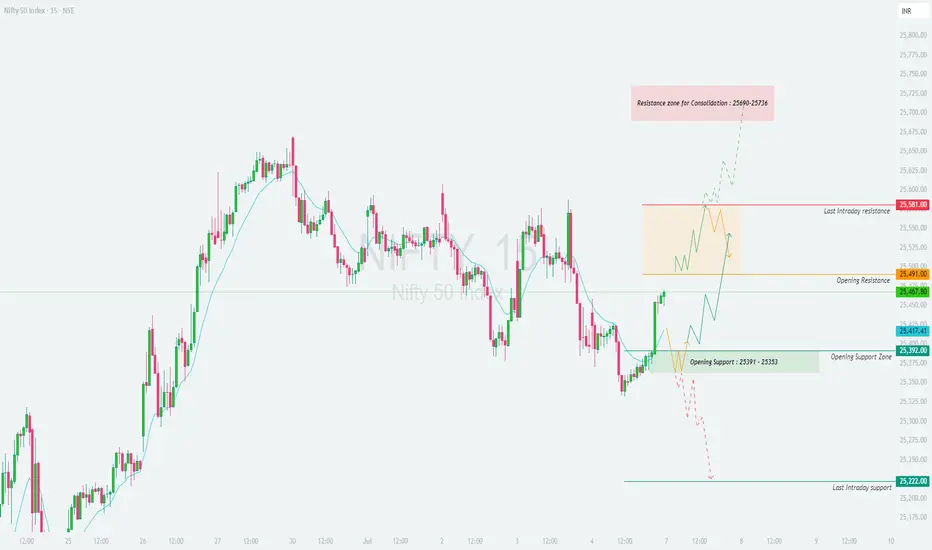
NIFTY : Trading levels and plan for 07-July-2025📘 NIFTY INTRADAY TRADING PLAN – 07-Jul-2025
🕒 Chart Timeframe: 15-Min | 🧭 Approach: Zone-Based Price Action | 🎯 Focus: Scalping to Positional Intraday
📍 Important Levels:
🔸 Opening Support Zone: 25,391 – 25,353
🔹 Opening Resistance Zone: 25,491
🔸 Last Intraday Resistance: 25,581
🔺 Major Resistance for Consolidation: 25,690 – 25,736
🔻 Last Intraday Support: 25,222
🟩 1. GAP-UP Opening (100+ points above 25,491)
If Nifty opens near or above 25,600, it will enter the last Intraday Resistance Zone and approach the Consolidation Resistance Zone (25,690–25,736).
📈 Action: Wait for a candle close above 25,581, then buy on strength toward 25,690–25,736.
🔄 Partial Booking: Consider profit booking in the upper consolidation zone.
📉 Rejection Trade: If strong reversal appears near 25,736, aggressive traders may short for a pullback to 25,491 with tight SL above the highs.
🛑 Stop Loss: Below 15-min candle low (for long) or above rejection high (for short).
🟨 2. Flat Opening (between 25,417 – 25,491)
This is the Opening Resistance Band—expect sideways price behavior in the first 15–30 mins.
📊 Wait for price to either break above 25,491 or fall below 25,417 with strength.
📈 Long Setup: If price crosses 25,491, ride it toward 25,581. Book partial at this resistance.
📉 Short Setup: Breakdown below 25,417 opens up support test at 25,391 – 25,353.
🧠 Tip: Avoid trades within the orange range (25,417–25,491) unless breakout is clear.
🟥 3. GAP-DOWN Opening (100+ points below 25,353)
This brings price closer to Opening Support and possibly into Breakdown Territory.
📉 Breakdown Trade: If price opens below 25,353 and fails to recover in first 15–30 mins, consider shorting toward 25,222 (Last Support).
📈 Reversal Trade: If price rebounds sharply and crosses back above 25,417, initiate reversal long with targets at 25,491.
🛑 SL Management: Use 15-min candle close basis – especially near support/resistance edges.
⚠️ Avoid shorts near 25,222 unless clean breakdown occurs.
💡 Risk Management Tips for Options Traders:
✅ Use ATM or slightly ITM options for directional trades; avoid deep OTM in the morning.
✅ Avoid trading aggressively in the first 15 mins—allow price to settle.
✅ For rangebound markets, prefer option selling strategies like Iron Condor or Strangle.
✅ Set a maximum loss limit for the day (1–2% of capital) and stick to it.
✅ Avoid emotional averaging—follow the plan or stay out.
📝 Summary & Conclusion:
📌 Above 25,581, Nifty could push into a high-consolidation resistance near 25,736
📌 Failure to sustain above 25,491 may result in a pullback to the support zone
📌 Break below 25,353 brings the 25,222 zone into play
📌 Wait for the first 15–30 mins to reduce fakeouts—zone-based trading will offer best R:R setups.
⚠️ Disclaimer:
I am not a SEBI-registered analyst . This plan is shared purely for educational purposes. Please consult a registered financial advisor or conduct your own analysis before making any trades.
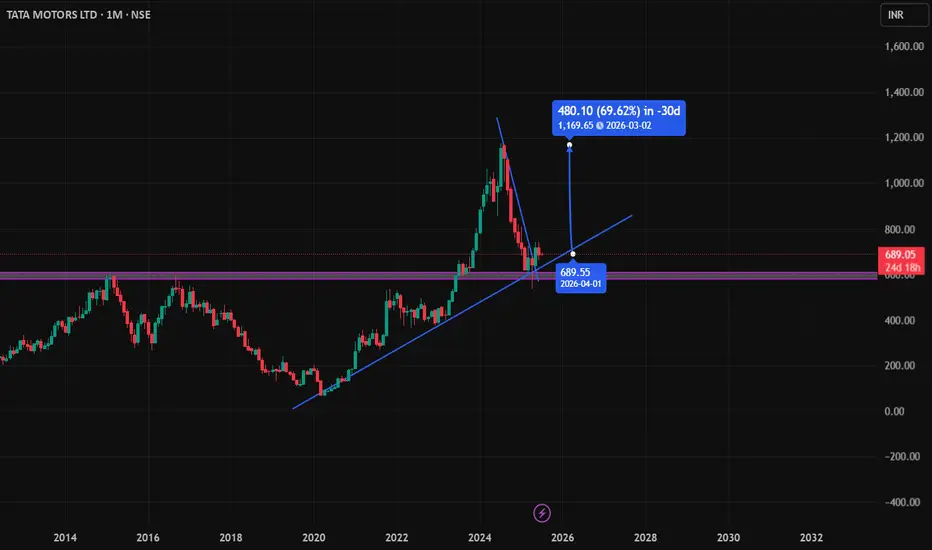
Tata Motors Long SetupTata Motors has confirmed a breakout from its recent downtrend, indicating a potential reversal. The breakout is supported by the formation of a strong bullish candle right at a key support zone, signaling renewed buying interest. This setup suggests favorable risk-reward for a long position, especially with increasing volume and momentum backing the move. Traders can consider entering above the breakout candle with a stop loss below the support.
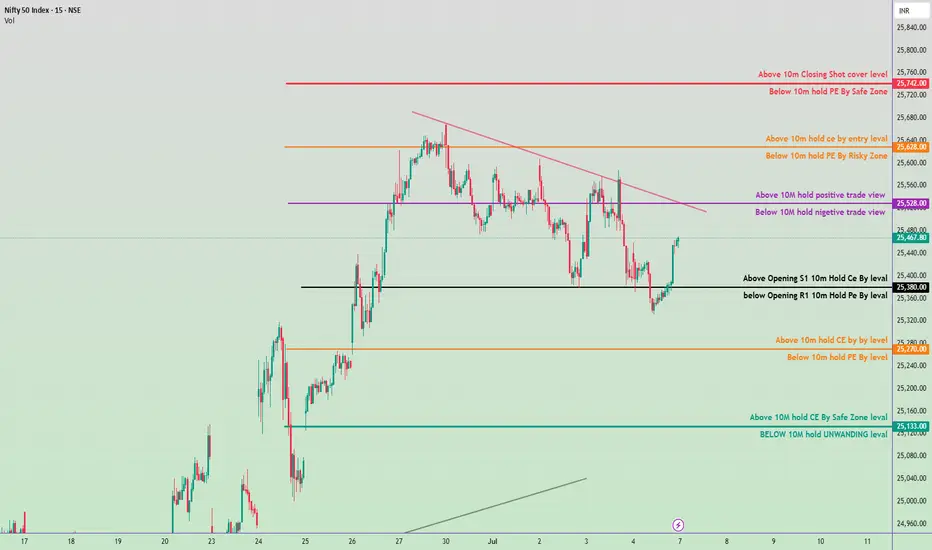
Nifty 50 Intraday Trade Plan - 7 July 2025✅ Bullish Zones (Call Option - CE Buy Levels):
Above 25,133 ➤ Hold CE by Safe Zone level
Above 25,270 ➤ Hold CE by key level
Above 25,380 ➤ Opening S1 Breakout – Hold CE
Above 25,528 ➤ Positive Trade View (10M volume base)
Above 25,628 ➤ Entry level for CE holding
Above 25,742 ➤ Closing Shot – Cover Short Positions
🔻 Bearish Zones (Put Option - PE Buy Levels):
Below 25,133 ➤ Unwinding Level – Hold PE
Below 25,270 ➤ Key level – Hold PE
Below 25,380 ➤ Opening R1 Breakdown – Hold PE
Below 25,528 ➤ Negative Trade View
Below 25,628 ➤ Risky Zone for holding PE
Below 25,742 ➤ Safe Zone for holding PE
🔁 Trendline & Structure Notes:
Downtrend resistance visible around 25,528–25,628 zone.
If price breaks above trendline and sustains, expect bullish momentum.
Support near 25,133 and strong base seen around 25,000 zone.
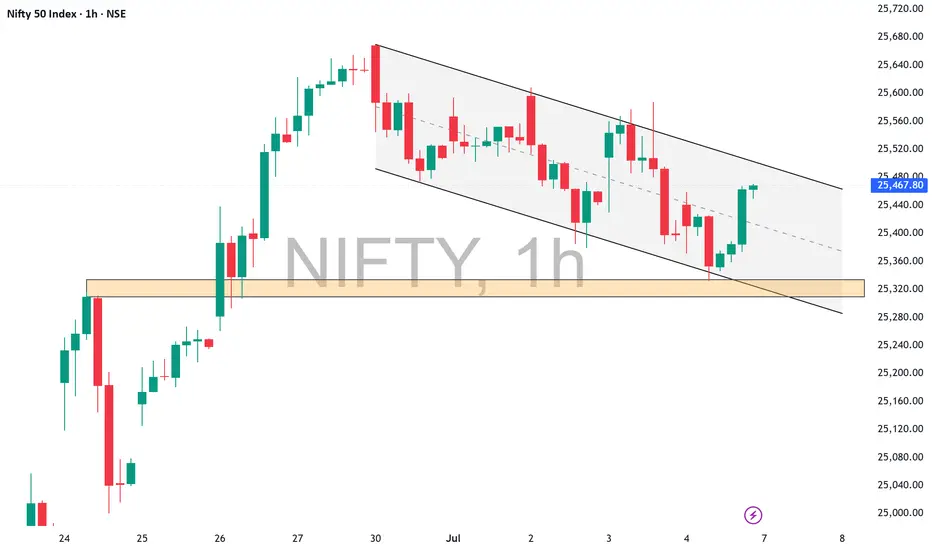
NIFTY is in channel NSE:NIFTY
Either side breakout is possible; just simply follow the price.
Good to keep on the radar
Always respect SL & position sizing
========================
Trade Secrets By Pratik
========================
Disclaimer
NOT SEBI REGISTERED
This is our personal view and this analysis
is only for educational purposes
Please consult your advisor before
investing or trading
You are solely responsible for any decisions
you take on basis of our research.
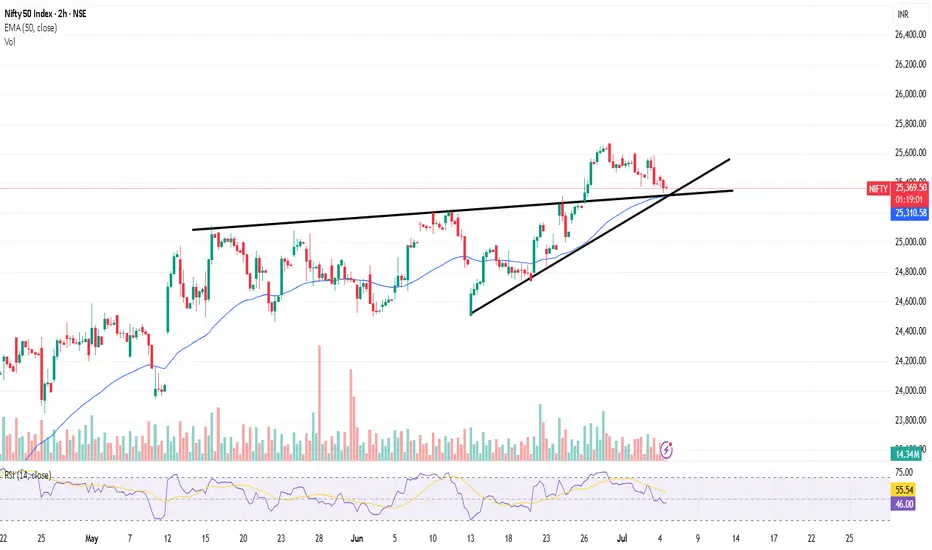
Weekly bias - Bulls in strong control of pricePrice has taken support from 25400 support zone and seems heading higher towards 26000 resistance.
Tip : Paragraph from Trading in the zone by Mark Douglas
The essence of what it means to be in "the zone" is that your mind and the market are in sync. As a result, you sense what the market is about to do as if there is no separation between yourself and the collective consciousness of everyone else participating in the market. The zone is a mental space where you are doing more than just reading the collective mind, you are also in complete harmony with it.
If this sounds a bit strange to you, ask yourself how it is that a flock of birds or a school of fish can change direction simultaneously. There must be a way in which they are linked to one another. If it is possible for people to become linked in the same way, then there will be times when information from those with whom we are linked can and will bleed through to our
consciousness. Traders who have experienced being tapped into the collective consciousness of the market can anticipate a change in direction just as a bird in the middle of a flock or a fish in the middle of a school will turn at the precise moment that all of the others turn.

niftynifty on resistance. we cant see upside for next 2 months. maybe we can see 240000 levels in september month.

NIfty Bullish Breakout RetestHello Everyone,
Profit Booking in nifty from 25660 to now 25330__RSi also adjusted from overbought to now at 45-50 Volume shows sellers dont have enough strenth to push the market down ....Clearly Buy on dips set up with all the conflunence EMA support and Trendline support makes set up more stronger.
Get ready For new Lifetime High.
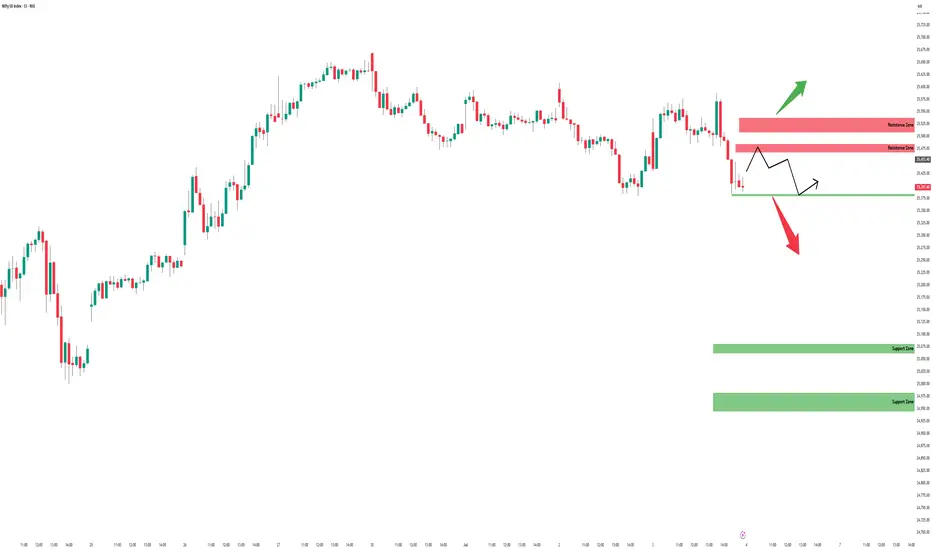
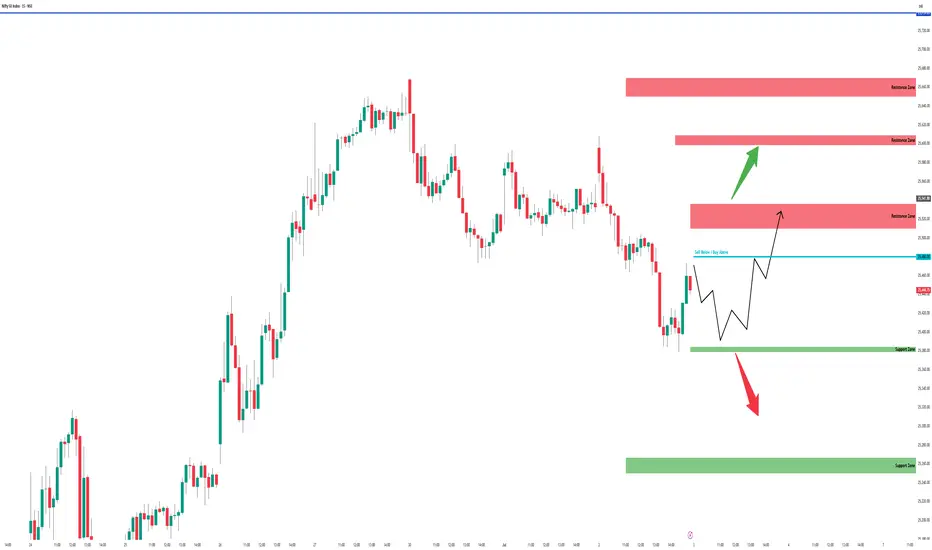
Nifty - Intraday levels & Prediction for - 04 Jul 2025Nifty Prediction for Tomorrow:
Trend : Sideways to BEARISH Continuation
Sentiment : Negative
Expectation : Nifty looks weaker and possibility of going down upto 25200/25100 levels
Look for Buy/Sell at Demand and Supply zone for profitable trades.
Demand and Supply Zones - When price breaks the zone, Demand zone will become Resistance and Supply zone will become Support.
Refer the chart for detailed Intraday Support and Resistance levels.
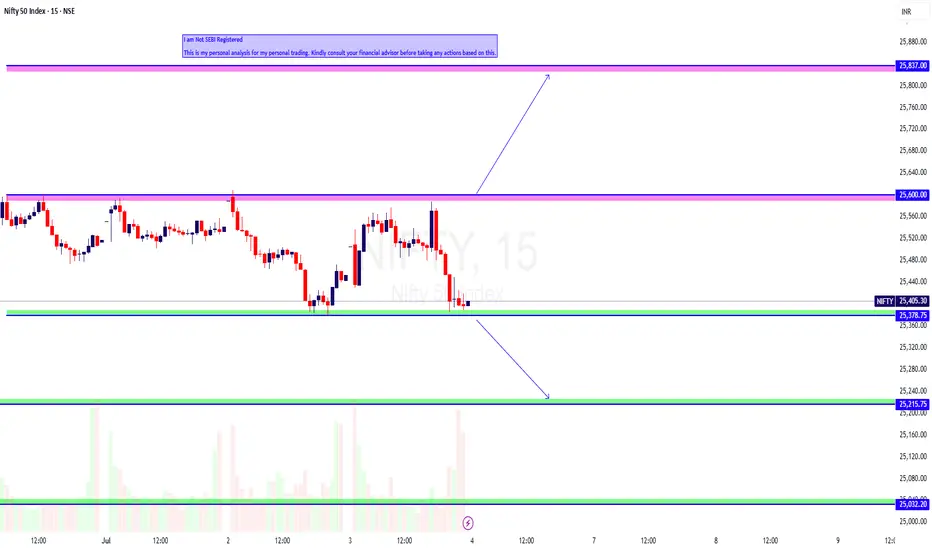
NIFTY Intraday Trade Setup For 4 Jul 2025NIFTY Intraday Trade Setup For 4 Jul 2025
Bullish-Above 25600
Invalid-Below 25550
T- 25837
Bearish-Below 25370
Invalid-Above 25420
T- 25215
NIFTY has closed on a slight bearish note with 0.19% cut today. Index has turned sell on rise since it has closed below PDL on 30 Jun. Buy on dip approach sentiment will be activated again if it closes above PDH in daily TF. Coming to Friday's trade setup, if index opens flat and a 15 Min candle closes above 25600 then will long , level has been tested multiple times in intraday. Short below 25370. A good flow below the same can be expected on flat opening.
In case of a big gap up/down, wait till 10 o'clock and mark the high and low of the trading range (5MIN). Trade on this range breakout.
==========
I am Not SEBI Registered
This is my personal analysis for my personal trading. Kindly consult your financial advisor before taking any actions based on this.
3rd july 2025 Nifty 50 trade plan levels
🔴 Upper Resistance Zones
25,830 – Above 10m Closing: Shot cover level
🔺 Strong resistance zone; if broken, short-sellers may start covering.
25,770 – Below 10m hold PE by Safe Zone
🔻 Safe zone for PE holders if price remains below this level.
🟠 Mid Resistance Zones
25,670 – Above 10m hold CE by entry level
🟢 If price sustains above this level, CE buying (bullish view) is favored.
25,600 – Below 10m hold PE by Risky Zone
⚠️ Below this, PE holders are at risk.
🟣 Key Intraday Sentiment Zone
25,520 – Above 10m hold positive trade view
📈 Market sentiment positive above this level.
25,500 – Below 10m hold negative trade view
📉 Market sentiment turns negative below this level.
⚫ Opening Support/Resistance
25,328 – Above Opening S1: 10m Hold CE by level
🟢 Support zone for CE holders.
25,300 – Below Opening R1: 10m Hold PE by level
🔻 Resistance zone for PE holders.
🟠 Lower Risk Zone
25,228 – Above 10m hold CE by Buy level
🟢 Strong buy level for CE if held.
25,200 – Below 10m hold PE by level
🔻 Risky level to hold PE below.
🟢 S upport/Unwinding Zone
25,092 – Above 10m hold CE by Safe Zone level
🛡️ Safe zone for bullish positions.
25,050 – Below 10m hold UNWINDING level
📉 If price drops below, expect unwinding pressure.

Nifty - Intraday levels & Prediction for - 03 Jul 2025 (Expiry)Nifty Prediction for Tomorrow:
Trend : Sideways then BULLISH Reversal
Sentiment : Negative but will change to Positive
Expectation : Nifty almost tested 15m 200 EMA but still there is a gap to fill, once its done we can see good BULLISH reversal in Nifty for New high. Some sort of consolidation will take place in the first half then good move likely to come.
Look for Buy/Sell at Demand and Supply zone for profitable trades.
Demand and Supply Zones - When price breaks the zone, Demand zone will become Resistance and Supply zone will become Support.
Refer the chart for detailed Intraday Support and Resistance levels.
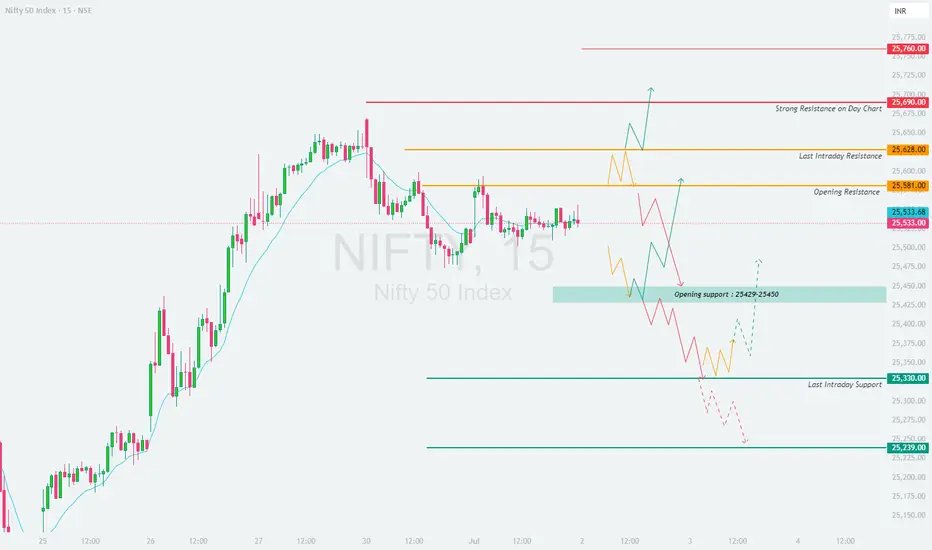
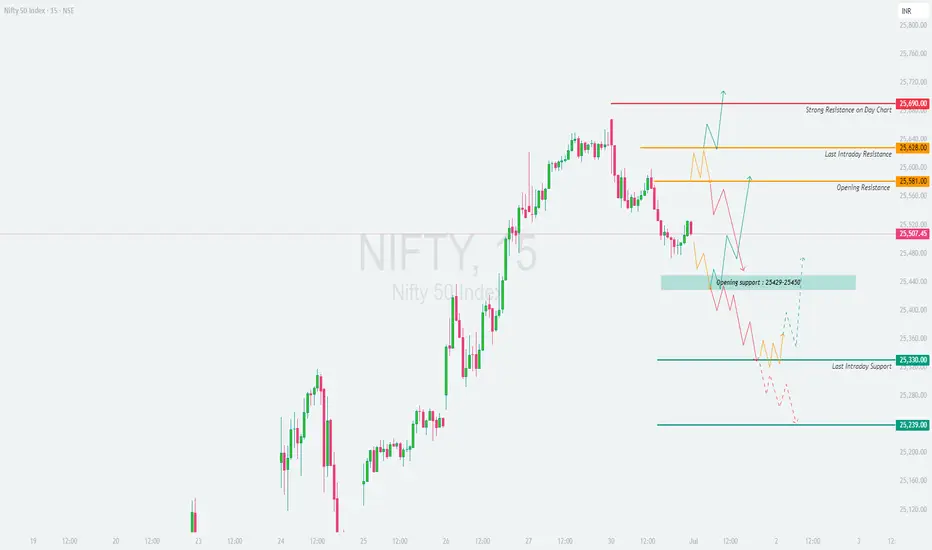
NIFTY : Trading levels and plan for 02-Jul-2025\ 📊 NIFTY TRADING PLAN – 2-Jul-2025\
📍 \ Previous Close:\ 25,533
📏 \ Gap Opening Consideration:\ ±100 points
🧭 \ Key Zones to Monitor:\
🔸 \ Opening Resistance:\ 25,581
🔸 \ Last Intraday Resistance:\ 25,628
🟥 \ Strong Resistance on Daily Chart:\ 25,690 – 25,760
🟦 \ Opening Support Zone:\ 25,429 – 25,450
🔻 \ Last Intraday Support:\ 25,330
🔻 \ Extreme Support:\ 25,239
---
\
\ \ 🚀 GAP-UP OPENING (Above 25,628):\
If NIFTY opens above \ 25,628\ , it breaks the last intraday resistance and moves toward the daily resistance zone \ 25,690–25,760\ . Expect buyers to book partial profits here, which may cause a sideways movement or minor reversal.
✅ \ Plan of Action:\
• If price sustains above 25,690, expect further upside but beware of profit-booking near 25,760
• A pullback towards 25,628–25,581 may give a re-entry opportunity
• Avoid shorts unless a bearish reversal pattern forms at 25,760
🎯 \ Trade Setup:\
– Buy above 25,690 with SL below 25,640, Target: 25,760
– Sell only if price rejects 25,760 with confirmation
📘 \ Tip:\ Avoid chasing the move post-gap-up. Wait for 15–30 min of structure.
\ \ ⚖️ FLAT OPENING (Between 25,450 – 25,581):\
This opening keeps NIFTY inside the key action zone. Since the structure is tight, breakout from either side can offer directional moves.
✅ \ Plan of Action:\
• Wait for a clear breakout above 25,581 or breakdown below 25,450
• Avoid taking trades inside 25,450–25,581 unless directional bias builds up
• Watch for volume and price expansion beyond these levels
🎯 \ Trade Setup:\
– Buy above 25,581, SL: 25,533, Target: 25,628–25,690
– Sell below 25,450, SL: 25,490, Target: 25,330
📘 \ Tip:\ Consider deploying directional option spreads (e.g., debit spreads) post-breakout.
\ \ 📉 GAP-DOWN OPENING (Below 25,429):\
A gap-down below \ 25,429\ enters the opening support area, and if this breaks, the next target is the \ last intraday support at 25,330\ , followed by \ 25,239\ .
✅ \ Plan of Action:\
• If price holds 25,429–25,450, watch for intraday reversal setup
• If it breaks and sustains below 25,330, expect further weakness
• Trade light early, and scale in only if trend persists
🎯 \ Trade Setup:\
– Buy reversal at 25,430–25,450 with bullish confirmation; SL: 25,400, Target: 25,533
– Sell below 25,330, SL: 25,375, Target: 25,239
📘 \ Tip:\ Use OTM put options rather than naked futures for safer risk-defined entries.
---
\ 📌 SUMMARY & LEVELS TO WATCH:\
✅ \ Bullish Above:\ 25,581 → 25,628 → 25,690–25,760
🔽 \ Bearish Below:\ 25,450 → 25,330 → 25,239
📉 \ Tight Range Zone:\ 25,450–25,581 → Wait for a breakout
---
\ 💡 OPTIONS TRADING RISK MANAGEMENT TIPS:\
🧠 \ Smart Traders Should:\
• Prefer option spreads to limit risk and manage theta decay
• Set alerts at key levels and wait for confirmations
• Avoid weekly options if there's uncertainty around direction
🚫 \ Avoid These Traps:\
• Over-leveraging on directional bias
• Holding naked options during choppy consolidation
• Trading without SL or re-entry plan
📘 \ Pro Tip:\ Consider selling iron condors if volatility remains in check near expiry.
---
\ ⚠️ DISCLAIMER:\
I am not a SEBI-registered analyst. This trading plan is purely for educational purposes. Please consult your financial advisor before making any investment decisions. Trade with proper stop-loss and risk management at all times.
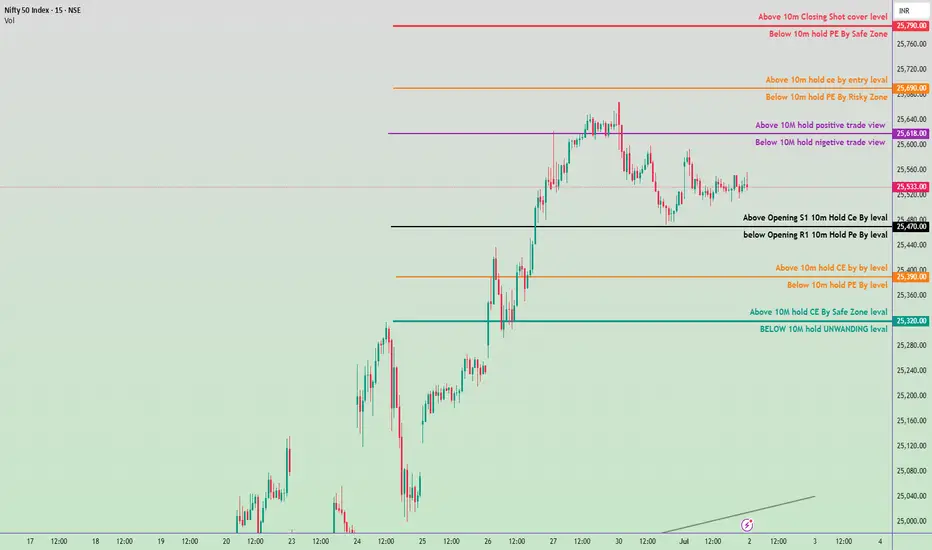
Nifty 50 Intraday Trade Plan 2nd july 2025🔼 Bullish Zones (Calls/CE preferable)
Above ₹25,790 → Closing Shot cover level
Above ₹25,760 → Hold PE by Safe Zone ends
Above ₹25,690 → Entry level for CE (Calls)
Above ₹25,618 → 10M hold positive trade view
Above ₹25,470 → Opening S1 | 10M Hold CE by level
Above ₹25,390 → 10M hold CE by Buy level
Above ₹25,320 → 10M hold CE by Safe Zone level
🔽 Bearish Zones (Puts/PE preferable)
Below ₹25,760 → Hold PE by Safe Zone starts
Below ₹25,690 → Risky Zone for PE
Below ₹25,618 → 10M hold negative trade view
Below ₹25,470 → Opening R1 | 10M Hold PE by level
Below ₹25,390 → 10M hold PE by level
Below ₹25,320 → UNWINDING level (Strong support loss)
📌 Trade Plan Guidelines
🔹 Above ₹25,618 with volume: Favor CE (calls), look for targets up to ₹25,690–₹25,790.
🔹 Below ₹25,470 with confirmation: Favor PE (puts) toward ₹25,390–₹25,320.
🔹 Avoid trading between ₹25,470–₹25,618 if price is consolidating — this is a neutral “no trade zone”.
📉 Below ₹25,320, expect strong unwinding.
NIFTY - TRADING LEVELS AND PLAN FOR 01-JUL-2025
\ 📊 NIFTY TRADING PLAN – 1-Jul-2025\
📍 \ Previous Close:\ 25,507
📏 \ Gap Opening Consideration:\ ±100 points
🧭 \ Key Zones to Monitor:\
🔴 Strong Resistance on Day Chart: \ 25,690\
🟧 Last Intraday Resistance: \ 25,628 – 25,640\
🟨 Opening Resistance: \ 25,581\
🟦 Opening Support: \ 25,429 – 25,450\
🟩 Last Intraday Support: \ 25,330\
🟫 Final Support: \ 25,239\
---
\
\ \ 🚀 GAP-UP OPENING (Above 25,640):\
A gap-up above \ 25,640\ pushes Nifty into the \ Strong Resistance zone\ visible on the daily chart. This area may trigger profit booking unless broken with strong volume and momentum.
✅ \ Plan of Action:\
• Wait for a 15-min candle close above 25,690 for confirmation of breakout
• If price stalls or forms reversal patterns, initiate short trade setups
• Only aggressive buyers may consider long trades above 25,690 if follow-up candles are strong
🎯 \ Trade Setup:\
– \ Buy above:\ 25,690, SL: 25,628, Target: Trailing towards 25,750+
– \ Sell near resistance:\ 25,675–25,690 zone if reversal confirmed, SL: 25,705, Target: 25,581
📘 \ Tip:\ Avoid buying directly into resistance. Wait for a breakout + retest for cleaner entries.
\ \ ⚖️ FLAT OPENING (Near 25,500 – 25,540):\
Flat openings near the \ Opening Resistance (25,581)\ can create indecisive sideways moves in early sessions.
✅ \ Plan of Action:\
• If price breaks above 25,581 with strength, look for long trades
• If price faces rejection near 25,581 or 25,628, wait for breakdown below 25,507 to confirm weakness
• Below 25,507, next support lies at the 25,429–25,450 zone
🎯 \ Trade Setup:\
– \ Buy above breakout of 25,581, SL: 25,500, Target: 25,628–25,690
– \ Sell below 25,507, SL: 25,581, Target: 25,450 or lower
📘 \ Tip:\ Flat opens are best traded on confirmation candles, not assumptions. Avoid overtrading.
\ \ 📉 GAP-DOWN OPENING (Below 25,400):\
A gap-down below 25,400 opens the day near the \ Opening Support zone of 25,429–25,450\ . This area is critical — a bounce or breakdown will define the day.
✅ \ Plan of Action:\
• If price shows bullish reversal signs near 25,429, consider a pullback trade
• Breakdown of 25,429 with volume may extend downside toward 25,330 and even 25,239
• Avoid chasing long trades unless price stabilizes above 25,450
🎯 \ Trade Setup:\
– \ Buy near support:\ 25,429 with SL below 25,390, Target: 25,507
– \ Sell on breakdown below 25,429, SL: 25,450, Target: 25,330 – 25,239
📘 \ Tip:\ Gap-down opens attract trap setups. Let the market settle before committing.
---
\ 🧭 KEY LEVELS – QUICK REFERENCE:\
🔺 \ Strong Resistance:\ 25,690
🟧 \ Last Resistance:\ 25,628 – 25,640
🟨 \ Opening Resistance:\ 25,581
🟦 \ Opening Support:\ 25,429 – 25,450
🟩 \ Intraday Support:\ 25,330
🟥 \ Final Support:\ 25,239
---
\ 💡 OPTIONS TRADING – RISK MANAGEMENT TIPS:\
✅ Stick to \ defined range breakouts\ before entering directional trades
✅ Don’t overleverage into gap-ups/downs; let premiums cool
✅ \ Avoid selling naked options\ without clear structure
✅ Protect capital with \ hedged strategies\ like debit spreads
✅ \ Exit when your reason is invalidated\ , not when SL hits randomly
🛡️ \ Always use stop-losses\ , especially in high-IV environments.
---
\ 📌 SUMMARY:\
• 📈 \ Bullish above:\ 25,581 → 25,640 → 25,690
• 📉 \ Bearish below:\ 25,507 → 25,429 → 25,330
• 🚫 \ No trade zone:\ 25,507–25,581 (if inside, wait for clarity)
🎯 \ Focus Zones:\
– Long breakout above 25,581
– Short breakdown below 25,429
– Reversal plays at 25,429 or 25,239 if structure supports
---
\ ⚠️ DISCLAIMER:\
I am not a SEBI-registered analyst. This content is shared only for educational purposes. Please do your own analysis or consult a professional financial advisor before taking trades. Risk management is essential—never trade without a stop-loss and always protect your capital.
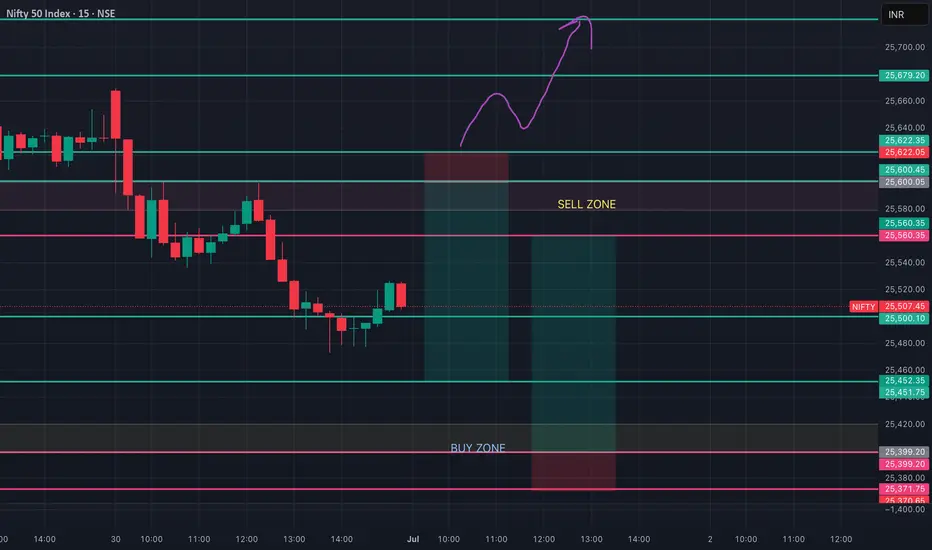
NIFTY INTRADAY LEVEL ( EDUCATIONAL PURPOSE) 01/07/2025🔷 Nifty Intraday Trade Plan – 1 July
📊 Analysis: 15-min TF | Execution: 1-min TF
🔸 GAP-UP Opening (Above 25,600)
📌 Plan: Avoid early longs. Wait for price rejection or reversal pattern.
🔁 Entry: Sell on breakdown below 5-min candle low
🛑 SL: 15–20 pts above day’s high
🎯 Target: 25,450 – 25,500
🔹 GAP-DOWN Opening (Below 25,400)
📌 Plan: Avoid panic selling. Wait for reclaim of early resistance
🔁 Entry: Buy if price reclaims 5-min opening high
🛑 SL: 15–20 pts below swing low
🎯 Target: 25,500 – 25,560
⚫ NORMAL Opening (Between 25,400–25,600)
📌 Range Play Setup
🔸 Sell Zone: Near 25,580–600 (resistance area)
🔹 Buy Zone: Near 25,420–440 (support area)
🛑 SL: 15–20 pts beyond trigger zone
🎯 Target: 30–40 pts
🔺 Breakout Trade Setup
🔁 Entry: Above 25,600 breakout candle (1-min TF)
🛑 SL: Below breakout bar
🎯 Target: 25,680 – 25,720
📌 Note: Respect price action & levels. Execute only if structure aligns with plan.
🧠 Discipline > Prediction