Nifty Hovering at 25,150 – Can It Break Strong Resistance?Nifty still couldn't hold the 25,150 level today, and selling pressure was seen from the day's high.
Avoid trading Nifty until it closes above 25,150 or 25,160. Until the Nifty closes above 25,150, avoid buying options. The Nifty will continue to trade sideways between 25,070 and 25,150 until it gives a decisive breakout. For a better understanding, you can watch the video.
Niftyprediction

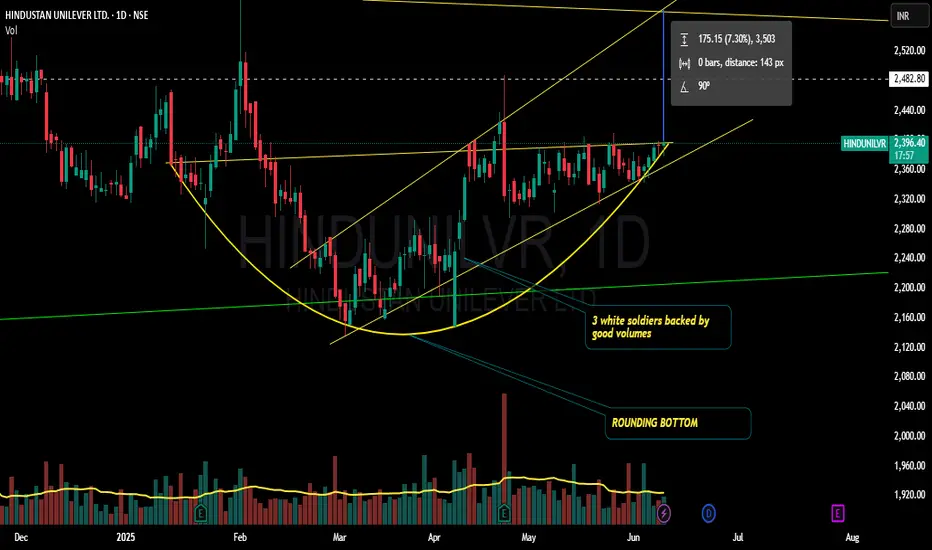
Hindunilvr longing for a breakout??!!Chart patterns inflict me the above titled opinion
Breakout can be expected as it has not breached the low made on 25th april 2025 and has been consistently making higher highs and higher lows(seen clearly on hourly charts)
Entry after the breakout.. ...
Godrejcp also seen for a up move!!!!
will update once it breaks out!!!!
Thank you.
This is just my opinion...not a advice!!!!
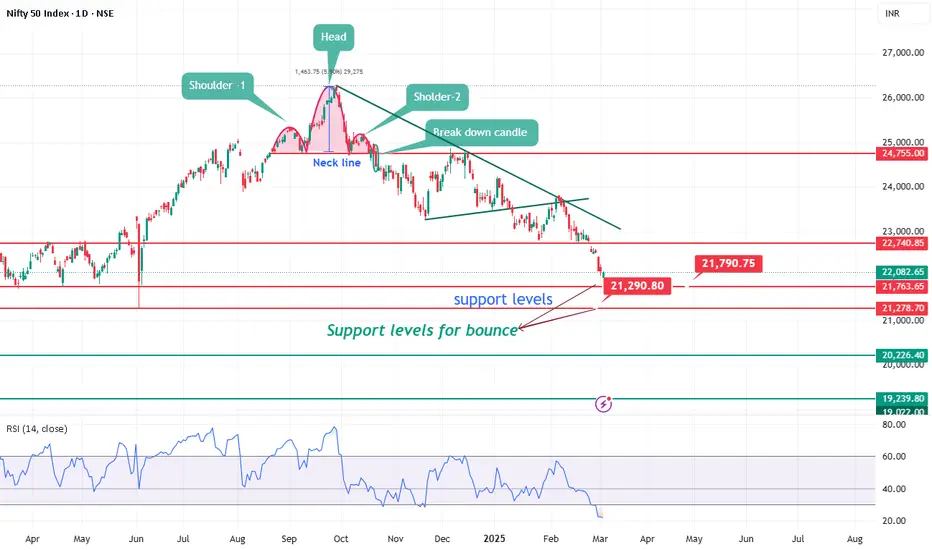
Nifty support levels for bounce.Nifty has been corrected 17% from top. As per chart index is in oversold condition on daily chart. There is still space for downside lower levels for support would be 21800 and 21222.
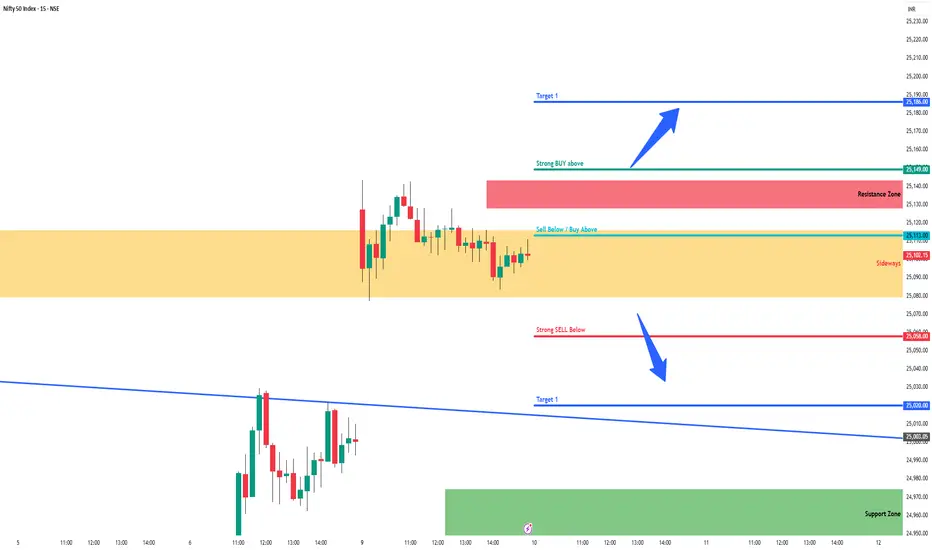
Nifty - Intraday levels & Prediction for - 10 Jun 2025Nifty Prediction for Tomorrow:
Trend : Slightly Bearish upto 25050 & 24970
Sentiment : Positive
Expectation : First half Bearish move then second half can expect BULLISH reversal.
Look for Buy/Sell at Demand and Supply zone for profitable trades.
Demand and Supply Zones - When price breaks the zone, Demand zone will become Resistance and Supply zone will become Support.
Refer the chart for detailed Intraday Support and Resistance levels.
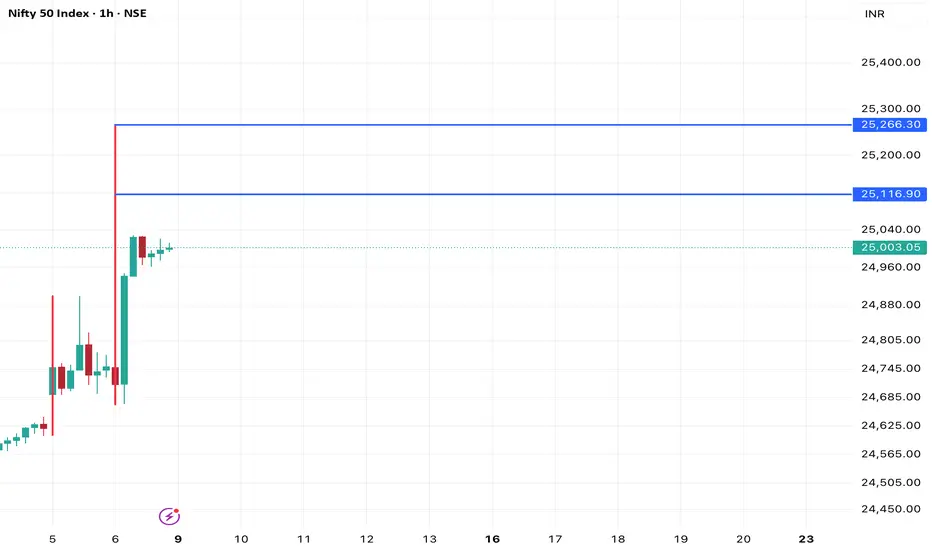
Nifty | Weekly Analysis June 9-13 2025Hi,
I am sharing view on nifty movement for coming week, it can create HH and HL formation and next possible retracement levels are 25117 and 25266.
Disclaimer: This is only for educational purpose.
Thanks
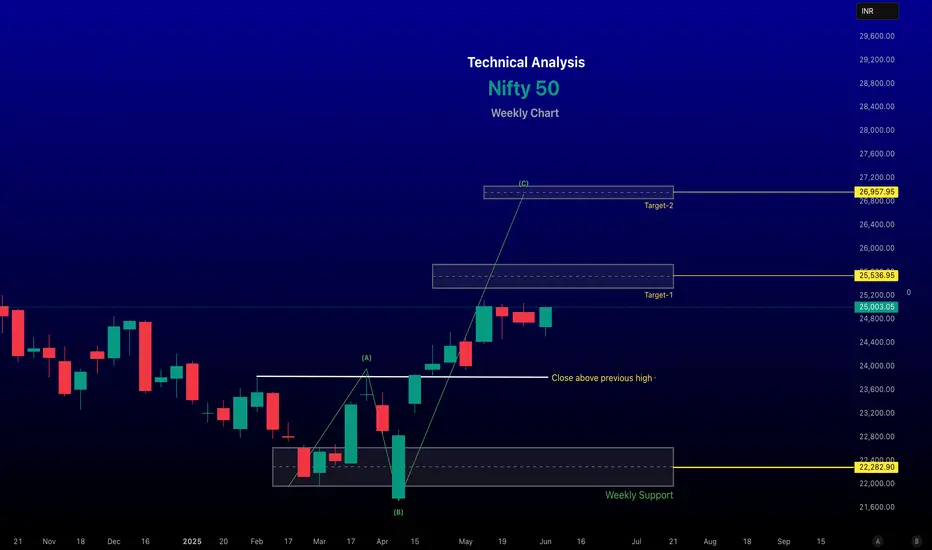
Nifty 50 Weekly Technical Analysis for June 09–13, 2025~~ Technical Analysis ~~
Short-Term (Daily/Weekly):
The Nifty 50 is currently trading within an ascending channel on the daily/weekly chart, indicating a bullish structure. However, it faces resistance in the 25,050–25,070 range. A breakout above this could target 25,300–25,600, while a drop below 24,700 may signal short-term weakness.
Recent suggest the index is testing key support levels, with the 200-day Exponential Moving Average (EMA) and a major trend line around 23,300–23,600 acting as critical support. A break below this could indicate a bearish shift.
The Relative Strength Index (RSI) on the daily chart has previously hit oversold levels (below 30) in March 2025, suggesting potential for a bounce if similar conditions reoccur.
-- Disclaimer --
This analysis is based on recent technical data and market sentiment from web sources. It is for informational and educational purposes only and not financial advice. Trading involves high risks, and past performance does not guarantee future results. Always conduct your own research or consult a SEBI-registered advisor before trading.
#Boost and comment will be highly appreciated
Nifty Inverted Head and Shoulder Bullidh Breakout possibleNifty has confirmed an Inverted Head and Shoulder breakout around 22,650, indicating a strong bullish momentum. This classic reversal pattern suggests that buyers are gaining control, and further upside movement is expected.
Trade Setup:
Entry: Above 22,650
Stop Loss: 22,350 (below the right shoulder)
Target: 22,950 (measured move projection)
Technical Analysis:
The neckline breakout with good volume confirms bullish strength.
RSI is showing positive divergence, supporting the uptrend.
If Nifty sustains above the breakout level, we may witness further upward momentum.
Risk Management:
Always follow proper risk-reward management.
Keep position sizing appropriate to your risk appetite.
Avoid over-leveraging.
Disclaimer: This analysis is for educational and informational purposes only and should not be considered financial advice. Trading in the stock market involves risk. Please do your own research and consult a SEBI-registered financial advisor before making any investment decisions.

Berger Paints | Inverted Head & Shoulders Breakout Breakout Analysis:
Berger Paints (NSE: BERGEPAINT) has given a breakout from an Inverted Head & Shoulders pattern on the daily chart, indicating a potential bullish move ahead. The breakout level is around ₹509, which now acts as immediate support.
Trade Setup:
📈 Entry: ₹509 (Breakout Level)
🔹 Stop Loss: ₹487 (Below the right shoulder)
🎯 Targets:
Target 1: ₹520.45
Target 2: ₹530.60
Target 3: ₹542
Technical Observations:
✅ Volume confirmation on breakout.
✅ RSI moving above 60, indicating strong momentum.
✅ Price sustaining above key moving averages.
Disclaimer:
📌 This analysis is for educational purposes only and should not be considered financial advice. I am not a SEBI-registered advisor. Please do your own research and consult a financial professional before making any investment decisions. Trade wisely! 📊

MRF: Inverted Head & Shoulders Breakout |Targets Ahead! MRF has confirmed a breakout from an Inverted Head & Shoulders pattern on the daily chart, signaling a potential bullish trend reversal. The breakout has occurred with strong volumes, adding conviction to the move.
🔍 Trade Setup:
Buy Above: ₹115,579
Stop Loss: ₹111,230 (Closing Basis)
Targets:
🎯 Target 1: ₹118,028
🎯 Target 2: ₹120,443
🎯 Target 3: ₹123,358
🎯 Target 4: ₹126,157
🎯 Target 5: ₹129,019
The pattern structure aligns well with Fibonacci extension levels and previous resistance zones, providing a favorable risk-to-reward ratio.
📌 Chart Highlights:
Breakout above neckline with volume surge
Positive RSI momentum confirming breakout strength
Price sustaining above key moving averages
⚠️ Disclaimer:
I am not a SEBI-registered advisor. This analysis is shared for educational and informational purposes only. Please consult your financial advisor before making any investment or trading decisions. Trade at your own risk.

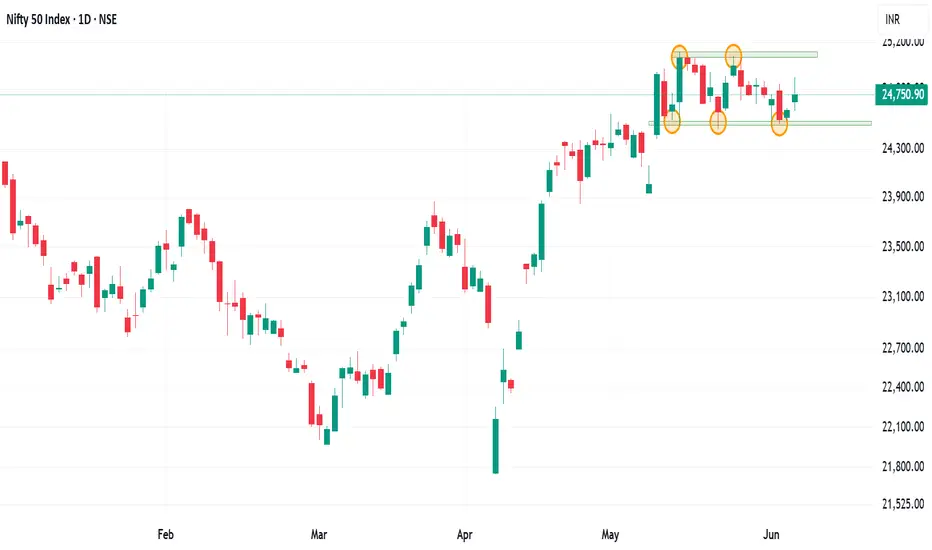
Outlook on nifty 50 for the next week. Is it going trending?Nifty 50 on the daily chart is trading in a range and has respected the zone quite effectively.
Index has remained sideways since a 3.82% move on 12th may. Market trade in cycle and after a sideways cycle, a trending market is predicted.
Either side movement can be seen in the index as 18 bars or 24 days it has remained in the range.
Major Resistance :- 25125, 25500
Major support :- 24500, 23930
This 600 range and change into same range of trending market.
Even the moving averages are coinciding and forming a MA gate which can give good momentum trading setup
Wait for the price action near the price levels before forming a trading basis. Trade only the setup and wait for the retest on either side.
Option Chain Analysis An option chain is a comprehensive listing of all available options contracts for a specific underlying asset, like a stock, index, or commodity, organized by strike prices and expiration dates. It's essentially a table that provides detailed information about call and put options for that asset, including strike prices, expiration dates, premiums, open interest, volume, implied volatility, and last traded price.

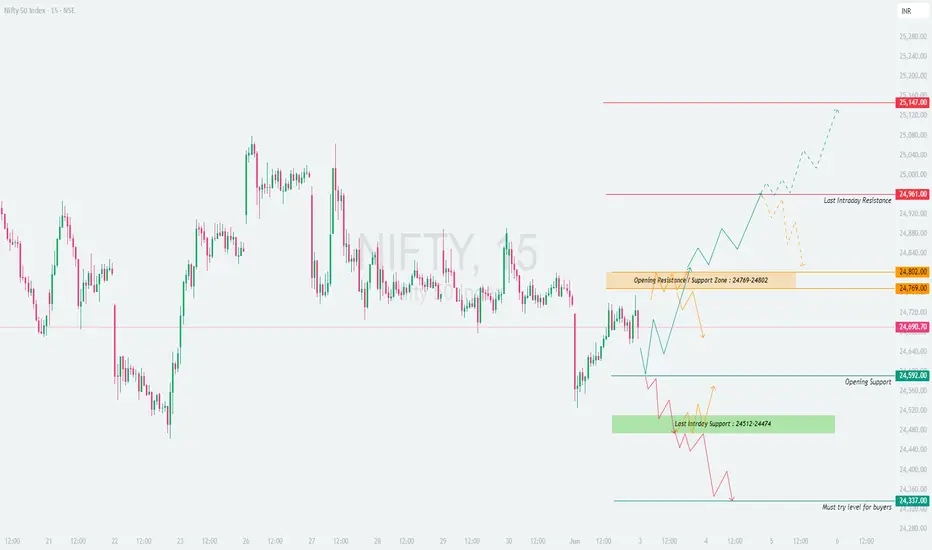
Nifty - Intraday levels & Prediction for - 04 Jun 2025Nifty Prediction for Tomorrow:
Trend : 1st Half BEARISH / Sideways then BULLISH (Trend Reversal at 24400 level be expected)
Sentiment : Positive
Expectation : Trend Reversal from 1 Hr 200 EMA, or at support zone.
Look for Buy/Sell at Demand and Supply zone for profitable trades.
Demand and Supply Zones - When price breaks the zone, Demand zone will become Resistance and Supply zone will become Support.
Refer the chart for detailed Intraday Support and Resistance levels.
Last one dance for NIFTY!!!!!!Scenario 1 ;
As per my analysis of nifty is declining with tight movement for last few days( consolidating lower)
Yesterday price rejected from one hour(1h) order block(ob) after that it moves quiet good.
For that reason ,today I am expecting more bullish in nifty( aggressive bullish).
Expecting +3% movement.
Scenario 2 ;
If nifty break and close below yesterday low, then it's all going to fall( sharp decline) from the sky to sharp edge of
the mountain( get support) and slowly tears ( after that slowly consolidating lower).
Expecting -5% movement.
Do your own analysis before taking trades. Peace.

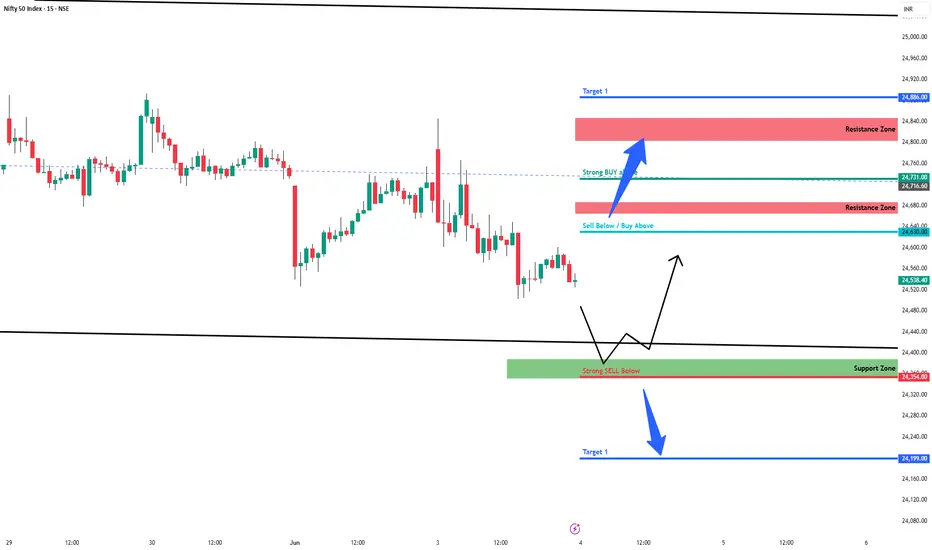
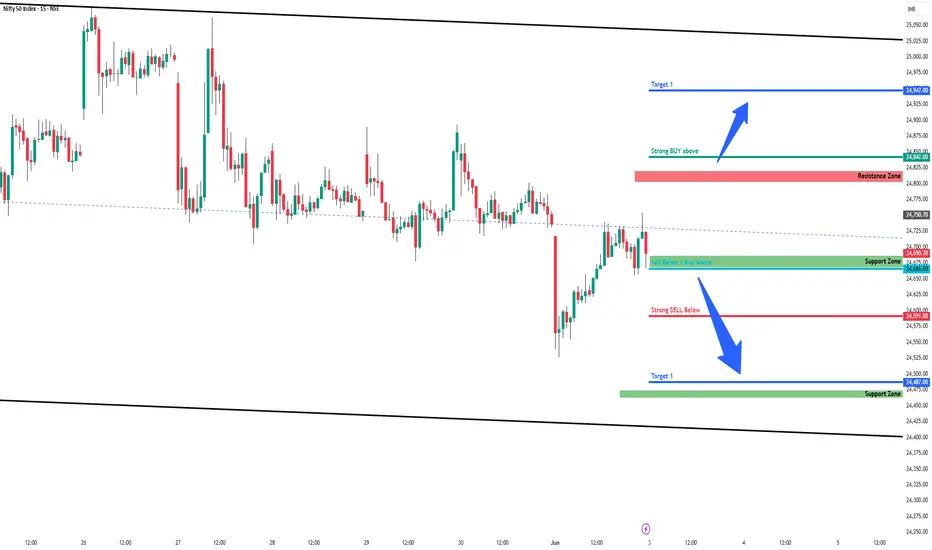
NIFTY : Trading levels and plan for 03-Jun-2025📘 NIFTY 50 – TRADING PLAN for 03-Jun-2025
🕒 Timeframe: 15-minute Chart Structure
📍 Gap Opening Threshold: 100+ points from the previous close of 24,690.70
🔼 GAP-UP OPENING (Above 24,802):
A gap-up above the Opening Resistance / Support Zone (24,769 – 24,802) signals early bullish sentiment. However, Nifty will face immediate resistance at 24,961, which is the Last Intraday Resistance . If that is crossed, the path opens toward 25,147, the next major resistance level.
✅ Plan of Action:
• Let the first 15–30 minutes unfold. If price sustains above 24,802, and forms a bullish 15-min structure (e.g., a higher high candle or retest + bounce), then consider going long above 24,820–24,840 zone.
• Targets:
→ First: 24,961
→ Extended: 25,147
• Stop-loss: Below the retest candle or under 24,769, depending on entry zone.
• Avoid chasing trades directly near 24,961. Let the level either break cleanly or give a pullback opportunity.
🧠 Educational Insight: Gap-ups tend to get tested. Don’t trade breakout levels blindly — instead, wait for a strong base formation or retest bounce before entering.
⚖️ FLAT OPENING (Between 24,690 – 24,769):
This zone lies within the broader consolidation area and right below the Opening Resistance Zone. It’s a sensitive area where the market may attempt either a base-building process or fake breakouts.
✅ Plan of Action:
• Avoid trading immediately at open. Let price test either side of the 24,769 – 24,802 resistance band.
• Long Setup: A clear 15-min candle close above 24,802 with volume support allows a long trade targeting 24,961 and possibly 25,147, with SL below 24,769.
• Short Setup: If price rejects 24,769 – 24,802 with a strong bearish pattern (e.g., evening star or shooting star), consider a short toward 24,592, with SL above 24,802.
• Treat this area as “No Trade Zone” unless a clear breakout or breakdown occurs.
🧠 Educational Insight: Most false breakouts happen in sideways zones like this. Let structure unfold with confirmation before you commit to a direction.
🔽 GAP-DOWN OPENING (Below 24,592):
A gap-down below 24,592 indicates early weakness, and price may head towards the Last Intraday Support Zone (24,512 – 24,474) . The final buyer defense level rests at 24,337, tagged as the Must Try Level for Buyers .
✅ Plan of Action:
• Allow 15–30 minutes to observe market reaction.
• If price holds above 24,512 – 24,474 zone and gives bullish reversal candles (hammer, bullish engulfing), it could offer a long trade toward 24,592 / 24,690.
• Aggressive Shorts: If price breaks and sustains below 24,474, look for quick scalps toward 24,337, with tight SL above 24,474.
• Reversal Longs: At 24,337, only buy if a clear bullish pattern confirms reversal; otherwise, avoid catching a falling knife.
🧠 Educational Insight: Don’t assume every support will bounce. Wait for bullish confirmation or trend shift signals. Panic selling is common on gap-downs, but reward comes only with patience.
🛡 RISK MANAGEMENT TIPS FOR OPTIONS TRADERS:
✅ 1. Avoid trading the first 5–15 minutes post-gap opening — especially with naked options. Let price stabilize.
✅ 2. Use spreads (Bull Call / Bear Put) to reduce risk and theta decay in directional bias.
✅ 3. Don’t overleverage just because premiums look cheap — IV crush can wipe you out fast.
✅ 4. Keep a time-based stop-loss for option buys — if price doesn’t move in your direction within 15–20 mins after entry, reassess.
✅ 5. Always follow the chart, not your emotions . Don’t hold losing trades hoping for a reversal.
📊 SUMMARY & CONCLUSION:
• 🟢 Bullish Above: 24,802, Targets: 24,961 / 25,147
• 🔴 Bearish Below: 24,592, Targets: 24,474 / 24,337
• 🟧 No Trade Zone: 24,690 – 24,769 → Wait for breakout/rejection structure
• 🟩 Support Zones: 24,592 / 24,474 / 24,337
• 🟥 Resistance Zones: 24,802 / 24,961 / 25,147
• ⏱ Time-based Rules: Let 15–30 mins develop to avoid false breakouts and overtrading
✨ Final Thought: Respect the plan. Let the chart tell you what to do — not your bias. The best trades are usually the most boring, disciplined ones.
📢 DISCLAIMER: I am not a SEBI-registered analyst. This trading plan is for educational and informational purposes only. Please consult a SEBI-registered financial advisor before taking any investment or trading decision.
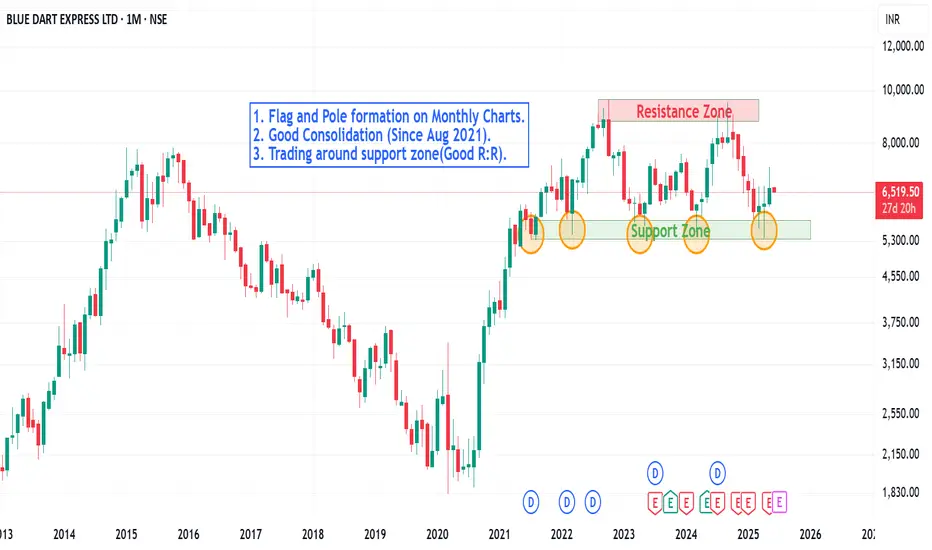
Is Bluedart Gearing Up for a Breakout? A Technical PerspectiveA good consolidation in there in the stock and on the monthly chart the stock has reconfirmed the support zone.
Major buying in happening there around 5500-5670 zone.
Weekly charts are showing consolidation phase around the very closing level as the price is trading between the various Moving averages.
A buying opportunity around 6200 levels can be initiated with a proper SL.
Technical Indicators:-
1. Stochastic : The weekly charts are trading around the oversold zone and on monthly charts its showing some lower levels coming on the charts.
2. Relative Strenght Indicator : On the monthly charts the stock has formed a bearish divergence and can be purchased once a 'W' formation is there in the RSI or price chart.
The stock has respected the support level since August 2021, a bearish trade can only be initiated once the major support level of 5500 is taken out. Avoid shorting till these levels.
Blue dart owning the logistic market can benefit from the E-commerce growth.
Long term buying opportunity can be seen in the stock with a potential returns of around 33-35% with a risk of 12-13% in coming years.
Watch the price action and enter only when the setup/pattern is formed on the charts.
Nifty - Intraday levels & Prediction for - 03 Jun 2025Nifty Prediction for Tomorrow:
Trend : BEARISH
Sentiment : Positive
Expectation : BEARISH Trend Continuation upto 24500 Target.
BULLISH only above 24820 Resistance zone. Until its Bearish only
Look for Buy/Sell at Demand and Supply zone for profitable trades.
Demand and Supply Zones - When price breaks the zone, Demand zone will become Resistance and Supply zone will become Support.
Refer the chart for detailed Intraday Support and Resistance levels.
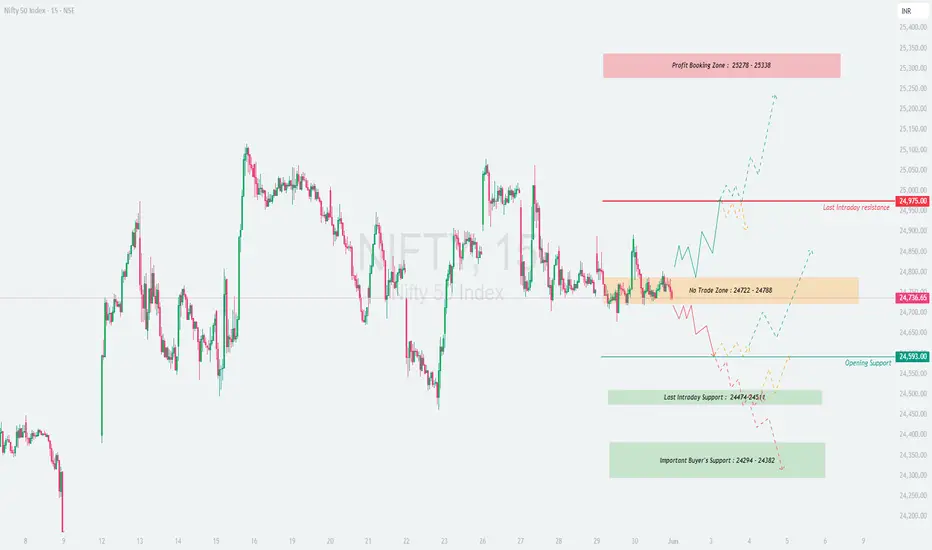
NIFTY : Trading Levels and Plan for 02-JUN-2025📘 NIFTY 50 – TRADING PLAN for 02-Jun-2025
🕒 Timeframe: 15-minute Chart Structure
📍 Gap Opening Threshold: 100+ points from previous close of 24,736.65
🔼 GAP-UP OPENING (Above 24,875):
If Nifty opens with a gap-up above the upper end of the No Trade Zone (24,722 – 24,788) , it indicates early strength and a potential breakout. However, it will face immediate resistance near the psychological mark of 24,975, which is the Last Intraday Resistance .
✅ Plan of Action:
• If the first 15–30 minutes show strength above 24,875 with bullish candles and follow-through volume, look to enter long above 24,900–24,975.
• Targets:
→ First: 24,975
→ Extended: 25,278 – 25,338 (Profit Booking Zone)
• Stop-loss: Below 15-min support candle or under 24,788 for confirmation-based trades.
• Avoid entering long trades directly near 24,975 unless a pullback-retest happens and sustains above.
🧠 Educational Tip: Don’t chase gap-ups blindly. Wait for confirmation like bullish engulfing or retest near breakout zone before taking the trade.
⚖️ FLAT OPENING (Between 24,722 – 24,788):
This is the No Trade Zone , meaning price is in indecision and trapped between key levels. Market may consolidate or build a base before directional movement.
✅ Plan of Action:
• Avoid trading the first 15–30 minutes. Let the price break out of this zone decisively.
• Break Above 24,788: Go long with SL below 24,722, targets: 24,975 / 25,278
• Break Below 24,722: Go short with SL above 24,788, targets: 24,593 / 24,474
• Watch for fakeouts – ensure breakout is supported by strong candle close and not just a wick.
🧠 Educational Tip: No Trade Zones are created for a reason – they usually trap impatient traders. Let the market choose direction and join the trend.
🔽 GAP-DOWN OPENING (Below 24,593):
A gap-down below Opening Support (24,593) suggests early weakness. Nifty may try to test deeper support levels near 24,474 – 24,451 (Last Intraday Support) and further toward 24,294 – 24,382 (Important Buyer’s Support).
✅ Plan of Action:
• Watch the 24,474 – 24,451 zone for signs of reversal. If a bullish reversal candle forms, a long entry can be attempted targeting:
→ 24,593
→ Extended: 24,722
• If 24,451 breaks decisively, expect momentum to carry prices toward 24,294 – 24,382.
• Short Trades: Can be taken only if price rejects bounce zones with bearish structure (e.g., bearish engulfing or retest failure).
🧠 Educational Tip: Don’t buy into weakness without confirmation. Bearish momentum tends to accelerate if support zones break early in the day.
🛡 RISK MANAGEMENT TIPS FOR OPTIONS TRADERS:
✅ 1. Avoid buying far OTM options after a gap opening – stick to ATM or near ATM strikes for better delta.
✅ 2. Use spreads (Bull Call/Bear Put) when expecting directional move with defined risk.
✅ 3. Never trade without a stop-loss ; even best setups fail in volatile markets.
✅ 4. Wait for the 15–30 minute structure to develop before taking directional trades.
✅ 5. Don’t average losers – instead, analyze the trade thesis and exit quickly if invalidated.
📊 SUMMARY & CONCLUSION:
• 🟢 Bullish Above: 24,788, Targets: 24,975 / 25,278 – 25,338
• 🔴 Bearish Below: 24,722, Targets: 24,593 / 24,451 / 24,294
• 🟧 No Trade Zone: 24,722 – 24,788 → Avoid initial trades, wait for breakout
• 🟩 Support Levels: 24,593 / 24,474 / 24,294
• 🟥 Resistance Levels: 24,975 / 25,278 / 25,338
• 📌 Key Rule: Let the structure confirm the bias – don't trade on emotions or pre-conceived notions.
✨ Final Note: Trade with discipline. Best trades don’t come every day — but risk-managed ones preserve your capital always.
📢 DISCLAIMER: I am not a SEBI-registered analyst. The trading plan shared above is strictly for educational purposes. Please consult with a SEBI-registered financial advisor before making any trading or investment decisions.
Nifty - Intraday levels & Prediction for - 02 Jun 2025Nifty Prediction for Monday 02 June 2025:
Trend : Mod. BEARISH
Sentiment : Negative
Expectation : BEARISH Trend Continuation upto 24500 Target
Look for Buy/Sell at Demand and Supply zone for profitable trades.
Demand and Supply Zones - When price breaks the zone, Demand zone will become Resistance and Supply zone will become Support.
Refer the chart for detailed Intraday Support and Resistance levels.
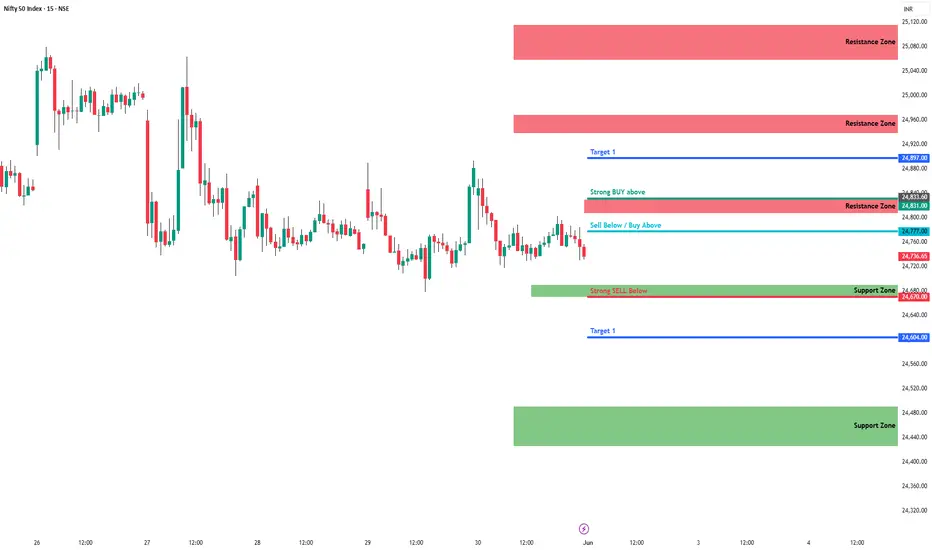
(june 2, 2025) trade plan for tomorrow🔥 99% Working Trading Plan 🔥
(For educational purposes only — trade at your own risk)
📈 Gap-Up Opening Strategy
➡️ If market opens above 24822 and holds for 15 min,
✅ Go LONG — Targets:
• 24940
• 25070
➡️ If market opens below 24822 but fails to break above in 15 min,
❌ Go SHORT — Targets:
• 24688
• 24610
📉 Gap-Down Opening Strategy
➡️ If market opens above 24688 and holds for 15 min,
✅ Go LONG — Targets:
• 24822
• 24940
• 25070
➡️ If market opens below 24688 and fails to break above in 15 min,
❌ Go SHORT — Targets:
• 24618
• 24520
🔒 Trading Rules (Must Follow):
📌 Never enter a trade without a 20-point stop loss
📌 Activate a trade only after 5M 2 candle closes above/below the level
📌 Don’t jump into trades immediately at level — wait for confirmation
📌 Full risk is your own, not me

(May 31, 2025) trade plan for tomorrow#Nifty50 #option trading
🚀 If you like my trading plan and levels, don't forget to boost the post
99% working trading plan
👉Gap up open 24822 above & 15m hold after positive trade target 24940, 25070
👉Gap up open 24822 below 15m not break upside after nigetive trade target 24688 , 24610
👉Gap down open 24688 above 15m hold after positive trade target 24822 ,24940, 25070
👉Gap down open 24688 below 15m not break upside after nigetive trade target 24618, 24520
📌 Trade plan for education purpose I'm not responsible your trade
More education follow social media and boost my idea
📌 koi bhi trade leval se 20 point ke sl ke bhina karan nahi hi
📌 koi trade app activate tabhi karana hota hi level pe 2 candle uper ya niche closing aati hai to
📌 leval par Ane pe turant trade plan na kare ...
📌 Full risk apaki hi hi meri nahi

Poonawalla Fincorp | Probable Bullish Flag Breakout Candidate📊 Technical Analysis Overview:
Poonawalla Fincorp is showing strong bullish momentum and is currently a probable flag breakout candidate. The stock has crossed the 200-day EMA with high volume, indicating strong institutional participation. Additionally, RSI is above 70, confirming bullish strength.
📌 Trade Setup & Key Levels
✅ Buy Entry: ₹357
🚨 Stop Loss: ₹333
🎯 Target Levels:
🔹 Target 1: ₹399.10
🔹 Target 2: ₹414.20
🔹 Target 3: ₹429.85
🔹 Target 4: ₹570.50
🔹 Target 5: ₹584.55
📈 Technical Observations
🔹 Flag Breakout Formation: The stock is attempting a breakout from a bullish flag pattern, which often leads to strong uptrends.
🔹 Volume Confirmation: A surge in volume alongside the breakout increases the probability of sustained upside.
🔹 200 DEMA Crossover: The price has successfully crossed the 200-day EMA, a strong bullish signal.
🔹 RSI Above 70: Indicates strong momentum, though a short-term pullback cannot be ruled out.
⚠️ Risk Management & Final Thoughts
Always use proper risk management to protect capital. The stop loss at ₹333 ensures a controlled downside, while the upside targets provide a strong risk-reward ratio.
📢 Watch for Retest: If the price retests the ₹357 level after the breakout and holds, it could provide another buying opportunity.
📊 What do you think? Will Poonawalla Fincorp continue its rally? Share your thoughts in the comments! 👇

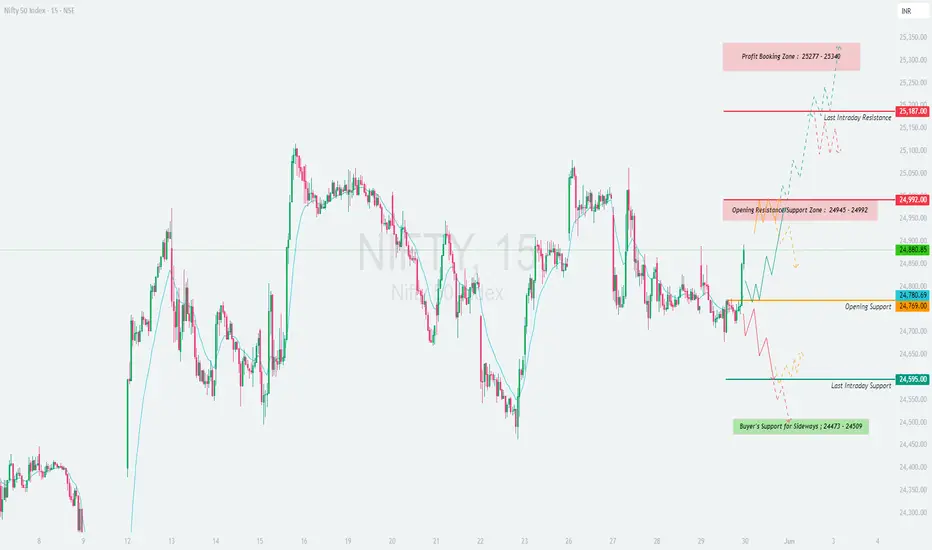
NIFTY : Trading Levels and Plan for 30-May-2025📘 NIFTY – TRADING PLAN for 30-May-2025
🕒 Based on 15-minute Chart Analysis
📍 Gap Opening Threshold: 100+ points from previous close of 24,880.85
🔼 GAP-UP OPENING (Above 24,992+):
If Nifty opens above the Opening Resistance zone (24,945 – 24,992) , it signals potential bullish continuation with strong upward momentum.
✅ Plan of Action:
• Wait for a 15-min candle close above 24,992 for breakout confirmation.
• Once confirmed, long trades may be initiated with upside targets:
→ 25,187 (Last Intraday Resistance)
→ 25,277 – 25,340 (Profit Booking Zone)
• Ideal stop-loss should be just below the breakout candle or beneath the 24,992 zone.
• If Nifty approaches 25,187 too quickly after open, expect minor profit booking or sideways move. Avoid aggressive buying near this resistance without proper structure.
🧠 Educational Insight: A gap-up above resistance is strong only if volume confirms and price sustains. Avoid chasing spikes; instead, wait for retest or consolidation above breakout levels to increase probability of success.
⚖️ FLAT OPENING (Between 24,780 – 24,945):
A flat open in this zone keeps the index in a balanced state with both opportunities and risks. Price action will dictate the day’s trend.
✅ Plan of Action:
• Mark the Opening Support: 24,780
• Mark the Resistance Supply zone: 24,945 – 24,992
• Wait for a range breakout:
→ Above 24,992 → Go long (targets: 25,187 → 25,340)
→ Below 24,780 → Go short (targets: 24,595 → 24,473)
• Do not trade within this zone unless price structure is clear and directional.
• Look for rejection wicks or engulfing patterns near support/resistance for potential scalps.
🧠 Educational Insight: Sideways zones are where traders lose most of their capital. Wait for confirmation before jumping in. A “No Trade” decision is also a trade that protects capital.
🔽 GAP-DOWN OPENING (Below 24,680):
A gap-down of more than 100 points brings Nifty near key supports: 24,595 (Last Intraday Support) and deeper into Buyer’s Support Zone (24,473 – 24,509).
✅ Plan of Action:
• Observe price behavior near 24,595.
• If this level holds, and you spot bullish reversal signs (hammer, bullish engulfing), go long toward:
→ 24,780 (Opening Support)
→ 24,880 (Previous Close)
• If price breaks below 24,473 with strong bearish candle, it opens up shorting possibilities with deeper targets.
• Stop-loss for reversal longs = below 24,473; for breakdown shorts = above 24,595.
• Avoid trading immediately at open; let the first 15–30 min range develop for clearer direction.
🧠 Educational Insight: Demand zones are highly reactive. Let the market show whether buyers are stepping in or fleeing. React, don’t predict.
🛡 RISK MANAGEMENT TIPS FOR OPTIONS TRADERS:
✅ Always use 15-min confirmation candles before taking a directional position.
✅ Don’t buy far OTM options post-gap openings ; use near ATM or spreads to control premium decay.
✅ Define your loss limit for the day and stick to it. One wrong revenge trade can ruin weeks of gains.
✅ Keep position sizing small on volatile or event days — focus on surviving first, thriving later.
✅ Use option spreads like debit spreads to reduce theta exposure during sideways market phases.
📊 SUMMARY & CONCLUSION:
• 🟢 Bullish Scenario: Above 24,992 → Targets: 25,187 / 25,340**
• 🔴 Bearish Scenario: Below 24,595 → Targets: 24,509 / 24,473**
• 🟧 Neutral Zone: 24,780 – 24,945 → Wait for breakout direction
• 🟩 Support Levels: 24,780 / 24,595 / 24,473
• 🟥 Resistance Levels: 24,992 / 25,187 / 25,340
• 🧠 Key Strategy: Avoid emotional trading during volatile opening. Wait, confirm, then act.
✨ Final Word: Trading is a skill of patience and preparation. Let levels guide you, not assumptions. The market rewards precision, not prediction.
📢 DISCLAIMER: I am not a SEBI-registered analyst. This trading plan is intended solely for educational purposes. Please consult your financial advisor before making any trading or investment decisions. Trade wisely. 📉📈
(May 30, 2025) trade plan for tomorrow#Nifty50 #option trading
🚀 If you like my trading plan and levels, don't forget to boost the post
99% working trading plan
👉Gap up open 24938 above & 15m hold after positive trade target 25170, 25370
👉Gap up open 24938 below 15m not break upside after nigetive trade target 24783, 24668
👉Gap down open 24783 above 15m hold after positive trade target 24938, 25170
👉Gap down open 24783 below 15m not break upside after nigetive trade target 24668, 24568
📌 Trade plan for education purpose I'm not responsible your trade
More education follow social media and boost my idea
📌 koi bhi trade leval se 20 point ke sl ke bhina karan nahi hi
📌 koi trade app activate tabhi karana hota hi level pe 2 candle uper ya niche closing aati hai to
📌 leval par Ane pe turant trade plan na kare ...
📌 Full risk apaki hi hi meri nahi
