NIFTY : Trading levels and Plan for 20-May-2025📅 NIFTY Trading Plan – 20th May 2025
🕒 Timeframe: 15-Minute | 🎯 Strategy Focus: Price Reaction Zones + Structure-Based Trading + Psychological Triggers
📌 Key Zones to Watch:
🔴 Resistance Zone: 25,081 – 25,101
🟠 Opening Pivot Zone: 24,960 – 24,980
🟦 Initial Support/Resistance: 24,862 – 24,878
🟢 Last Intraday Support: 24,732
🟢 Final Breakdown Support: 24,623
🔺 Last Intraday Resistance: 25,239
📈 Scenario 1: GAP UP Opening (🔺 100+ points) – Opening Above 25,050
If Nifty opens with a strong gap-up directly into or above the resistance zone 25,081 – 25,101 , it enters a supply zone from where reversals have occurred in the past.
Avoid rushing into long trades immediately after a gap-up.
Wait for a 15-minute candle close above 25,101 with strong follow-up buying volume to confirm breakout strength.
On confirmation, expect targets toward 25,180 → 25,239 (last intraday resistance) .
However, if price gets rejected from the resistance zone with upper wicks or bearish engulfing candles, then short trades toward 24,980 → 24,960 become favorable.
A failed breakout from this level often leads to a short-trap liquidation move.
📌 Educational Note: A gap-up into resistance is a liquidity magnet. Always seek candle confirmation before acting. Momentum traders should only participate if the breakout sustains with strength.
⚖️ Scenario 2: FLAT Opening (Within ±100 points) – Between 24,860 – 24,980
This scenario offers the most balanced opportunity to trade both sides, depending on where price moves post-opening.
If price sustains above 24,980 for 15–30 minutes, a breakout attempt toward 25,081 → 25,101 is likely.
A clear break and close above 25,101 may trigger long trades aiming for 25,180 → 25,239 .
On the downside, if price fails to hold above 24,960 and breaks below 24,878 , a slide toward 24,732 → 24,623 can unfold.
For rangebound movement, you may consider deploying neutral strategies like Iron Fly or ATM straddle with tight SLs.
📌 Educational Note: Flat opens are where the market seeks direction. Don’t trade the first candle — observe whether buyers or sellers dominate before committing capital.
📉 Scenario 3: GAP DOWN Opening (🔻 100+ points) – Opening Below 24,860
A gap-down below the initial support zone 24,862–24,878 sets a bearish tone, but it can trap emotional sellers if not confirmed.
If the price opens near 24,840–24,860 and shows early signs of holding, a short-covering move back to 24,960 is possible.
However, if price breaches below 24,732 (last intraday support) , the index could slide further toward 24,623 .
Avoid buying blindly just because it's a gap-down — instead, wait for a reversal confirmation (hammer, morning star).
Momentum traders can go short below 24,732 with SL above 24,780, targeting 24,650 – 24,623 .
📌 Educational Note: Gap-downs often trigger panic. Smart traders stay calm and react only when price gives clean structure — don’t bottom fish unless a reversal structure appears.
🛡️ Options Trading – Risk Management Tips:
✅ Respect the Premium Decay: Avoid buying far OTM options on Tuesday unless there's strong momentum confirmation.
✅ Set SL as a % of Premium: Use a 30–40% SL of premium for long option positions.
✅ Hedge Naked Options: If selling options, always hedge using defined-risk spreads.
✅ Use Time-Decaying Strategies: Calendar spreads or neutral plays work better in choppy zones.
✅ Position Sizing is Key: Don’t risk more than 1–2% of capital per trade — it protects your mental capital too.
✅ Avoid Holding Naked Positions Overnight: Carry only if hedged or directional clarity is backed by event data.
📊 Summary & Conclusion:
🔼 Above 25,101: Bullish momentum likely → Target 25,180 – 25,239
🔄 Between 24,862 – 24,980: Neutral zone → Wait for breakout or breakdown
🔽 Below 24,862: Bearish tone → Target 24,732 – 24,623 on confirmation
📌 Key Lesson: Let price confirm the move. React, don’t predict. Level-based action always wins over emotions.
📢 Disclaimer:
I am not a SEBI-registered analyst . The above content is shared purely for educational and informational purposes. Please consult your financial advisor or do your own research before taking any trades.
Niftyprediction
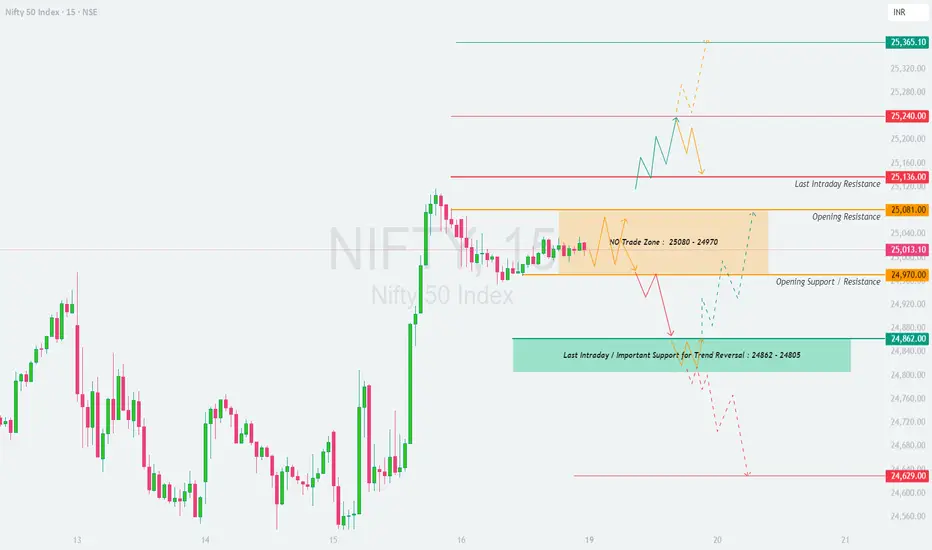
NIFTY : Trading levels and Plan for 19-May-2025📅 NIFTY 50 Trading Plan – 19th May 2025
⏰ Timeframe: 15-Minute | 🧠 Approach: Actionable, Risk-Reward Based, Psychological Zones
📍 Chart Key Levels:
🔸 No Trade Zone: 25,080 – 24,970
🟥 Opening Resistance: 25,081
🟧 Opening Support / Resistance: 24,970
🟩 Strong Support Zone: 24,862 – 24,805
🟥 Last Intraday Resistance: 25,136
🔺 Target/ATH Zone: 25,240 → 25,365
🟥 Breakdown Zone: Below 24,862 leads to weakness with next support at 24,629
📈 Scenario 1: GAP UP Opening (100+ Points Up) – Above 25,136 🚀
If Nifty opens with a gap-up above 25,136 , prices will already be near or inside the resistance zone. Avoid chasing trades at open.
Wait for a 15-min candle to close above 25,240 . This confirms strength and opens the way toward the ATH zone of 25,365+ .
Book profits gradually near ATH zone, and expect possible selling pressure here.
If price fails to sustain above 25,240 , avoid fresh longs and look for rejection patterns (like bearish engulfing) for quick intraday shorts back to 25,136 .
📌 Educational Note: When the market opens in a resistance zone, let it settle for the first 15–30 minutes to avoid false breakouts.
📉 Scenario 2: FLAT Opening (within 50 pts of previous close) – Inside No Trade Zone (24,970–25,080) 🔄
Opening in this range creates confusion. This zone is best avoided for fresh trades unless a breakout/breakdown is confirmed.
If price breaks above 25,081 with strong bullish momentum, you may consider a long entry targeting 25,136 → 25,240 .
If price breaks down below 24,970 , you can initiate short positions with target toward 24,862 → 24,805 .
Avoid any position inside the orange zone until one side is clearly broken.
📌 Educational Note: No Trade Zones often result in whipsaw moves – stay disciplined and wait for clean direction.
📉 Scenario 3: GAP DOWN Opening (100+ Points Down) – Below 24,862 ⚠️
If the market opens below the key support zone of 24,862 , sentiment turns bearish.
Look for follow-through selling below 24,805 to target 24,629 .
However, any bounce-back from 24,805 – 24,862 zone with volume confirmation can be used for intraday reversal trades back to 24,970 .
Wait for a proper rejection candle or bullish engulfing pattern before taking reversal long trades.
📌 Educational Note: Strong support zones can lead to high risk-reward reversal trades if combined with proper price action.
💡 Options Trading – Risk Management Tips:
🛡️ Always hedge directional positions when holding beyond intraday.
⏳ Avoid buying options when IV is high, especially after gap-ups.
💰 Use defined SLs like hourly candle closes to avoid panic exits.
📉 If trading breakout with options, consider buying near the money for better delta impact.
📊 Summary:
✅ Above 25,240 = bullish continuation zone
⚠️ 25,081 – 24,970 = No Trade Zone
🔻 Below 24,862 = Trend reversal or fresh weakness
Wait for first 15–30 min candle to confirm trade direction. Avoid emotional entries and focus on clean breakout or reversal confirmation patterns.
📢 Disclaimer:
I am not a SEBI-registered analyst . All views shared are for educational purposes only. Please do your own research or consult with a financial advisor before taking any trades.
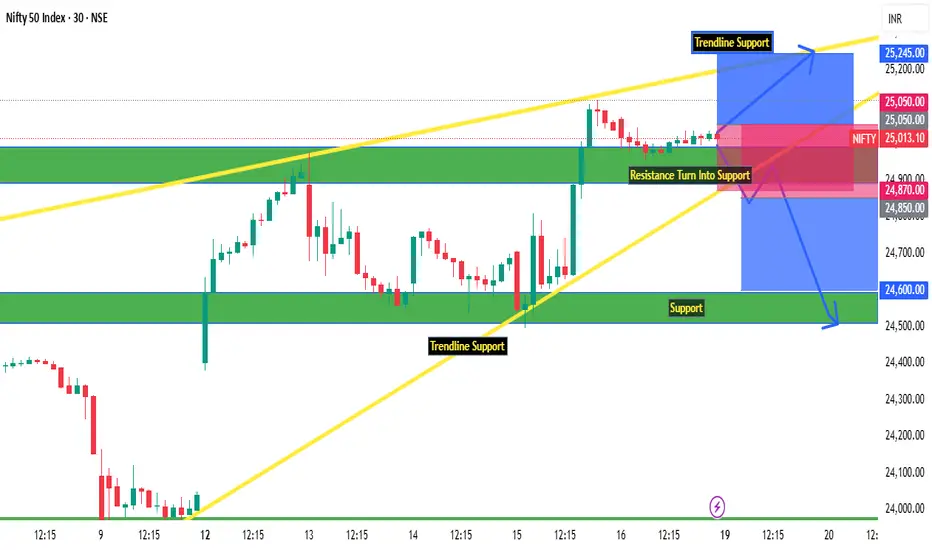
Nifty Intraday Levels : 19-May-25
Nifty Break Resistance and closed above of 25000,
Also above Trendline Support on 30 Min Timeframe.
Important zones mentioned on chart
Bearish < 25850
Bullish > 25050
Wait for Proper Rejection/Pattern :
@Support : Bullish
@Resistance : Bearish
*All views for educational purpose only
Nifty 50 outlook for the week of May 19–23, 2025
# The Nifty 50 index, a benchmark for the Indian stock market, has shown mixed signals recently, and the outlook for the week of May 19–23, 2025, depends on key technical levels, market sentiment, and global cues. Below is a technical analysis based on available data and trends, with a focus on price levels, support, resistance, and indicators.
Current Market Context
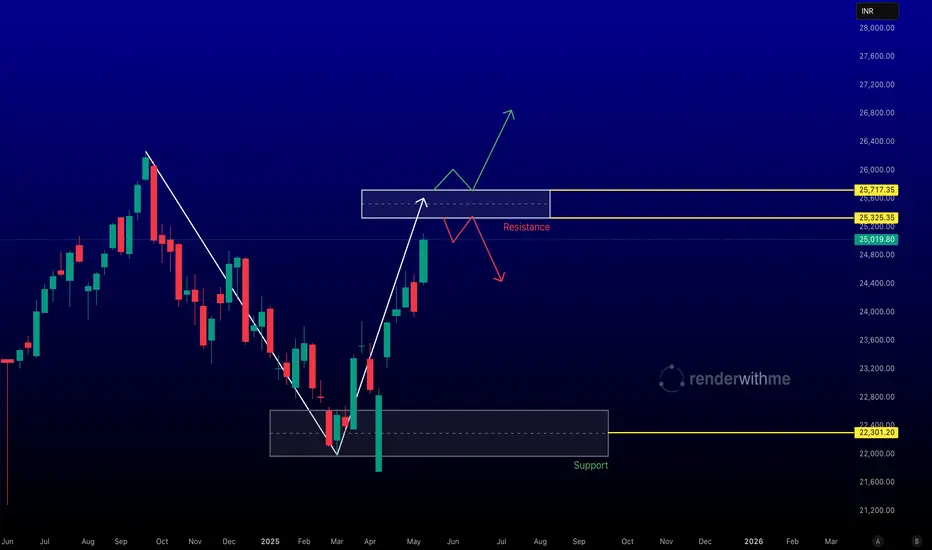
Latest Close (May 16, 2025): The Nifty 50 closed at 25,019.80, down 42.30 points (-0.17%).
Recent Performance: The index has shown volatility, with a strong rally of 550 points on May 15, closing above 25,000 for the first time in seven months, driven by FII buying (₹5,393 crore) and optimism around a potential US-India trade deal. However, it slipped slightly on May 16, testing the 25,000 mark.
Technical Analysis
Price Action and Trend
Current Trend: The Nifty is trading within an ascending channel on the daily chart, indicating a short-term bullish structure. However, it recently broke out of a descending channel on the 4-hour chart, suggesting potential for further upside if key levels hold.
Recent Volatility: The index experienced significant intraday volatility, closing at 25,062 on May 15 (up 395 points) but failing to sustain above 25,070 on May 16. This indicates profit-booking pressure at higher levels.
Sentiment: we suggest a cautious outlook, with some analysts pointing to a "breather-type chart pattern" for the upcoming week, indicating possible consolidation or a pullback before further moves.
Chart for your reference
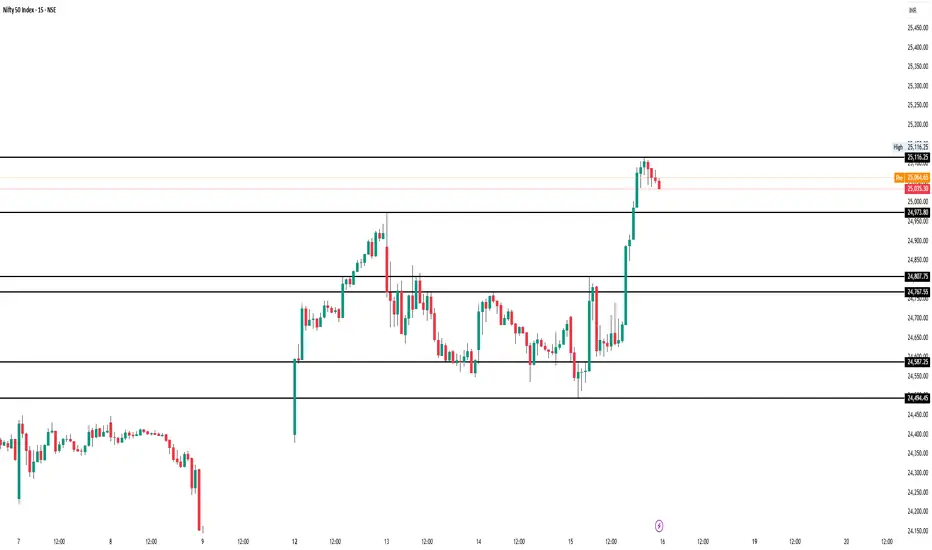
KEY SUPPORT RESISTANCE LEVELS ON 15 MINNifty 50 - Key Support and Resistance Levels
This 15-minute chart for the Nifty 50 index highlights the recent price action with key support and resistance zones clearly marked. After a sharp upward breakout, the index is currently trading around 25,035, facing immediate resistance at 25,116.25. Key support levels to watch include 24,973.80, 24,807.75, 24,767.55, 24,587.25, and 24,494.45, which might act as potential pullback zones in case of a correction.
Keep an eye on volume and price action around these levels for confirmation before taking trades.
Nifty 50 Technical Analysis - May 16, 2025Nifty 50 Technical Analysis - May 13, 2025
Current Market Overview:
Closing Price: The Nifty 50 closed at 25,035.30, Up 395.20 points.
Day Range: Low: 24,750.00 | High: 25,400.00
Market Sentiment: The market exhibited strong bullish momentum, driven by positive global cues, including a ceasefire between India and Pakistan and optimism around US-China trade negotiations
Chart for your reference

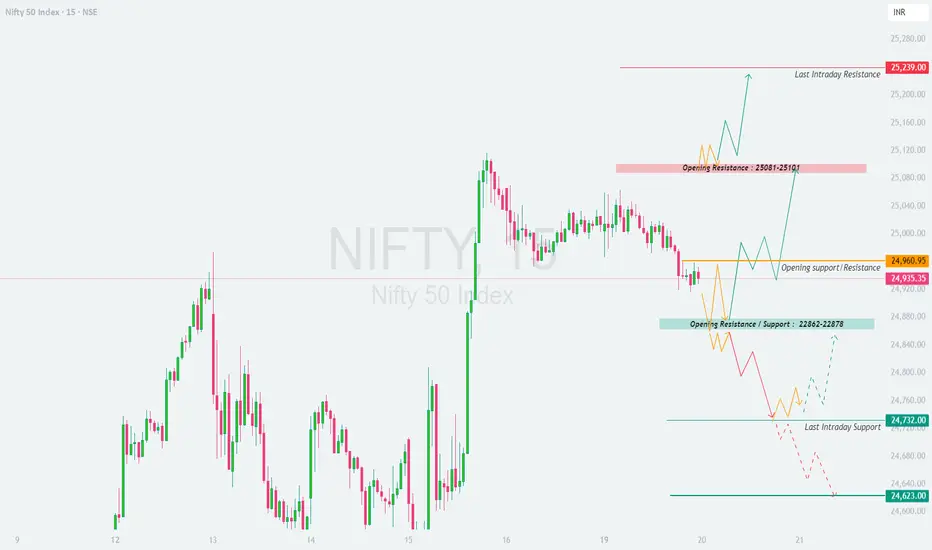
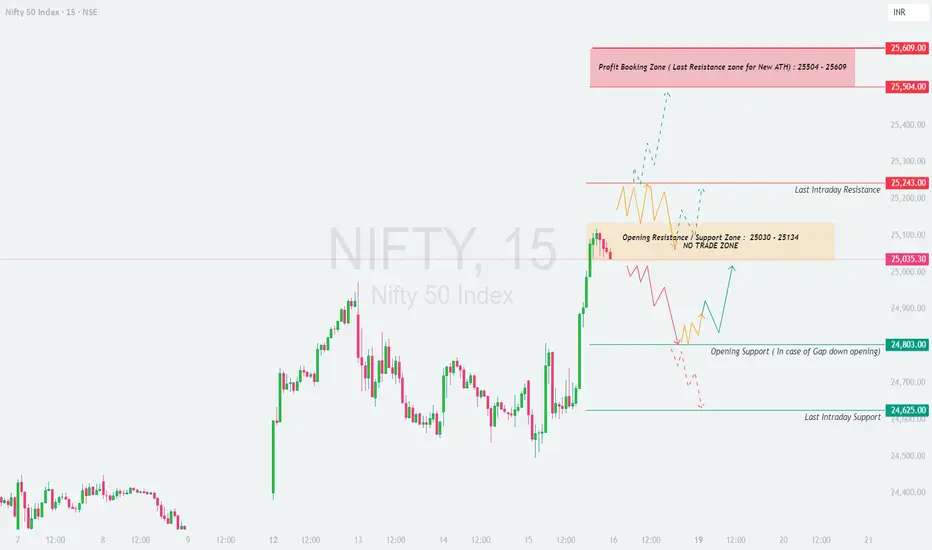
NIFTY : Trading levels and Plan for 16-May-2025📘 NIFTY TRADING PLAN – 16th May 2025 (15-Min Structure Based)
📍 Nifty closed at 25,035.30 on 15-May-2025. Price is currently hovering around the Opening Resistance/Support Zone (25,030 – 25,134) , which has been marked as a No Trade Zone due to potential whipsaws and lack of clear direction.
As per your rule, a Gap Opening is considered ±100 points or more from the previous close.
Let’s break down the strategy into three possible opening scenarios:
🚀 SCENARIO 1: GAP-UP OPENING (Above 25,135)
(Gap-up of 100+ points)
If Nifty opens above 25,135 , it will start trading near the Last Intraday Resistance zone at 25,243 . This zone may act as a strong supply area initially.
Price action near 25,243 must be closely watched. If there’s rejection or failure to sustain, a quick pullback toward 25,134 – 25,030 is possible.
However, if Nifty shows strength and sustains above 25,243 on 15-min closing basis with bullish structure, fresh long entries can be considered.
Upside targets will be 25,504 and potentially 25,609 , which is the Profit Booking / Last Resistance zone for a New All-Time High .
Risk increases if you chase long trades right at open without confirmation candles.
👉 📚 Tip: Prefer a breakout-retest strategy above 25,243 for cleaner long trades. Avoid buying at peak unless there’s strong momentum confirmation.
📊 SCENARIO 2: FLAT OPENING (Between 25,030 – 25,134)
(Flat to minor gap opening)
This zone is marked as the Opening Resistance/Support Zone (25,030 – 25,134) and is a NO TRADE ZONE due to the likelihood of choppy moves and indecision.
Wait for a directional break — either above 25,243 for bullish trades or below 25,030 to consider bearish setups.
If price consolidates within this zone during the first 30 minutes, it’s best to stay patient and avoid noise trades.
A 15-min candle closing below 25,030 could trigger shorting opportunities with targets at 24,803 and then 24,625 .
Above 25,134 , longs should only be taken after a 15-min close above 25,243 to avoid being trapped.
👉 📚 Tip: This zone is not ideal for option buying as theta decay will hurt both sides. Let the direction become clear before entering.
🔻 SCENARIO 3: GAP-DOWN OPENING (Below 24,935)
(Gap-down of 100+ points)
A gap-down below 24,935 pushes Nifty closer to Opening Support zone at 24,803 , which has the potential to act as a bounce area.
If price bounces from 24,803 with a bullish 15-min candle, a quick recovery toward 25,030 can be expected.
However, if Nifty breaks below 24,803 decisively with volume and a follow-up 15-min candle close, further downside may continue toward 24,625 (Last Intraday Support).
This zone may provide scalping opportunities on both sides but demands high discipline and tight SLs.
Aggressive traders may also look for PE buying or bear put spreads below 24,803 , targeting 24,625 and potentially further if global cues support weakness.
👉 📚 Tip: Watch for volume and structure at 24,803 — it's a decision point. If it cracks, ride the trend but be cautious near 24,625 as it may trigger a short-covering bounce.
🛡️ RISK MANAGEMENT & OPTIONS TRADING TIPS:
⏰ Avoid trading within the first 15 minutes post-market open unless a clean breakout/breakdown is visible.
⚖️ Never trade both sides at once — choose the direction based on price structure and stick with it.
💼 Use ATM or ITM options to minimize theta impact during intraday trades.
📉 If the market consolidates, avoid buying options. Use spreads (Bull Call / Bear Put) or wait for V-shaped moves.
🔄 Exit OTM options by 2:45 PM unless holding momentum trades.
📊 Keep SL on candle close basis (15-min preferred) and don’t average your loss-making trades.
👉 💡 Bonus Tip: For momentum confirmation, look for confluence of volume spike + candle body closing beyond marked zone.
📌 SUMMARY & CONCLUSION:
🔸 Bullish Breakout Trigger: 25,243 → Targets: 25,504 / 25,609
🔸 Bearish Breakdown Trigger: Below 25,030 → Targets: 24,803 / 24,625
🔸 Flat Zone: 25,030 – 25,134 → Avoid trading until a clear breakout or breakdown
🔸 Critical Supports: 24,803 (Gap-down cushion), 24,625 (last support zone)
🔸 Risk Focus: Wait for structure confirmation, don’t get trapped in emotional trades
📈 Nifty is currently poised near a decision zone. A clean breakout or breakdown can set the tone for the day, but avoid premature entries in the No Trade Zone. Let price confirm its intent, and then follow with disciplined execution.
⚠️ DISCLAIMER:
I am not a SEBI-registered analyst . This trading plan is shared strictly for educational and informational purposes only . Please conduct your own analysis or consult a registered advisor before initiating any trade. Trading carries risks – protect your capital at all times.
16th May 2025 Nifty 50 Prediction & Trading Zone#Nifty50 #option trading
🚀 If you like my trading plan and levels, don't forget to boost the post
99% working trading plan ( Opning Possibility FLAT to down )
👉Gap up open 25173 above & 15m hold after positive trade target 25422, 25533
👉Gap up open 25173 below 15m not break upside after nigetive trade target 24880 , 24680
👉Gap down open 24880 above 15m hold after positive trade target 25173,25422
👉Gap down open 24880 below 15m not break upside after nigetive trade target 24680, 24500
📌 Trade plan for education purpose I'm not responsible your trade
More education follow social media and boost my idea
📌 koi bhi trade leval se 20 point ke sl ke bhina karan nahi hi
📌 koi trade app activate tabhi karana hota hi level pe 2 candle uper ya niche closing aati hai to
📌 leval par Ane pe turant trade plan na kare ...
📌 Full risk apaki hi hi meri nahi
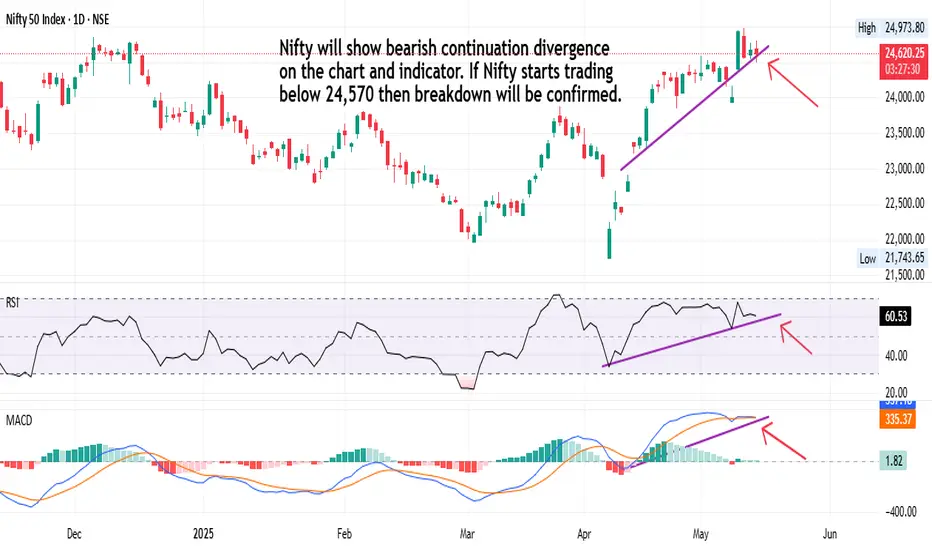
Nifty 50 Shocking Bearish Continuation Divergence!Nifty will show bearish continuation divergence on the chart and indicator. If Nifty starts trading below 24,570 then breakdown will be confirmed.
NIFTY 50 Index – 4H Technical Outlook🔍 Chart Overview
Index: Nifty 50 (NSE)
Timeframe: 4H
Current Price: 24,563.50
Bias: Bullish, but awaiting retracement
🧠 Market Structure Analysis
✅ 1. Trendline Breakout
Long-term descending trendline has been clearly broken, signaling a shift from bearish to bullish structure.
Strong bullish move post-breakout confirms momentum on the buy side.
🧱 2. Key Supply and Demand Zones
Zone Type Price Range Comment
Demand Zone 1 24,150 – 24,300 Strong structure zone, likely to hold on first retest
Demand Zone 2 23,500 – 23,750 Deeper retracement support, highly reactive
Demand Zone 3 22,900 – 23,100 Last stronghold; potential for swing reversal if tested
Supply Zone 25,000 – 25,300 Short-term resistance before bullish continuation
Target Zone 26,250 – 26,500 Next major upside target
🔄 Two Potential Bullish Scenarios Drawn
🅰️ Scenario 1: Shallow Pullback
Retrace to Demand Zone 1 (24,150–24,300)
Bounce and continuation toward 25,000 → 26,000+
Quick retest of structure support → higher high
🅱️ Scenario 2: Deeper Pullback
Break below Zone 1, retest Zone 2 or 3 (as deep as 23,000)
Strong demand and liquidity here could fuel a massive rally toward 26,000
This offers better risk-to-reward for long-term buyers
✅ Bullish Confluences
Signal Description
✅ Trendline Breakout Major signal for bullish reversal
✅ Higher High Formed Structure confirms bulls are in control
✅ Clean Demand Zones Zones are respected and visible
✅ Liquidity Grab Below Potential trap move below 24,000 to grab liquidity before continuation
✅ Fibonacci Confluence Likely overlap with 50–61.8% retracement (not shown, but expected)
❌ Invalidation Level
If price closes below 22,900, it may indicate a breakdown and trend reversal.
Watch for signs of bullish absorption around this level.
📊 Trade Idea: Buy on Dip
Entry Area Stop Loss Target 1 Target 2 Risk:Reward
24,150–24,300 23,950 25,200 26,250 ~1:3
23,500–23,700 23,200 25,200 26,250+ ~1:4
Disclaimer:
The information provided in this post/video/chart is for educational and informational purposes only. It should not be considered financial advice or a recommendation to buy or sell any security, financial product, or instrument.
I am not a SEBI-registered investment advisor. All trading and investing decisions are at your own risk. Past performance does not guarantee future results. Always consult with a qualified financial advisor before making any financial decisions.
15th May 2025 Nifty 50 Prediction & Trading Zone#Nifty50 #option trading
🚀 If you like my trading plan and levels, don't forget to boost the post
99% working trading plan ( Opning Possibility FLAT TO up )
👉Gap up open 24725 above & 15m hold after positive trade target 24890, 25090
👉Gap up open 24725 below 15m not break upside after nigetive trade target 24588 , 24340
👉Gap down open 24588 above 15m hold after positive trade target 24725 ,24890
👉Gap down open 24588 below 15m not break upside after nigetive trade target 24490, 24384
📌 Trade plan for education purpose I'm not responsible your trade
More education follow social media and boost my idea
📌 koi bhi trade leval se 20 point ke sl ke bhina karan nahi hi
📌 koi trade app activate tabhi karana hota hi level pe 2 candle uper ya niche closing aati hai to
📌 leval par Ane pe turant trade plan na kare ...
📌 Full risk apaki hi hi meri nahi
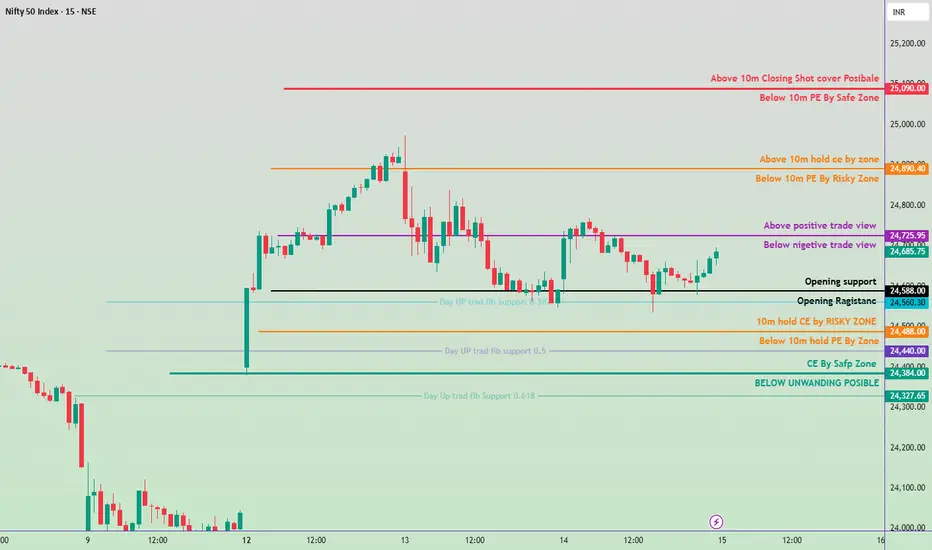
NIFTY : Trading Levels and Plan for 15-May-2025📊 NIFTY TRADING PLAN – 15th May 2025 (15-Min Chart Structure Analysis)
Nifty closed at 24,685.75 on 14-May-2025. Based on the chart setup, price is attempting to break out from consolidation but still trades below the crucial resistance level of 24,752 . Support remains around 24,468–24,490 , and below that, a key demand zone lies at 24,313–24,356 .
We will consider a Gap Opening to be 100+ points as per standard practice.
🟢 SCENARIO 1: GAP-UP OPENING (Above 24,785)
(Gap up of 100+ points above last close)
If Nifty opens above 24,785 , it enters the Last Intraday Resistance Zone of 24,878–25,026 .
A direct open into resistance could invite profit booking or a reversal unless bulls show strength.
Wait for the first 15–30 minutes — if Nifty forms a strong bullish candle and sustains above 25,026 , it confirms a continuation rally. You can consider a long entry with a target of 25,100+ and stop-loss below 24,950 .
However, if price struggles to cross or shows rejection candles around 24,878–25,000 , then look for shorting opportunities with downside targets of 24,752 and 24,690 .
Do not chase a gap-up at open. Let structure confirm strength before acting.
👉 Educational Insight: Gaps into resistance zones often get filled if early momentum fails. Price needs strong follow-through to avoid being faded.
🟨 SCENARIO 2: FLAT OPENING (Between 24,600 – 24,750)
(Minor move from previous close)
If Nifty opens between 24,600 and 24,750 , it remains within the previous range — suggesting possible sideways action or a breakout setup.
The upside breakout level is 24,752 . A candle close above this with volume can trigger bullish momentum towards 24,878 and 25,026 .
On the downside, support lies near 24,468–24,490 . If that zone breaks, Nifty may slip to 24,313–24,356 .
Ideal strategy: Wait for price to break above 24,752 or below 24,468 and then trade with the trend.
Inside this zone, avoid aggressive trades — let market establish a clear direction.
👉 Educational Insight: Flat openings after consolidation days can lead to strong trending moves once breakout levels are breached. Don’t preempt; react to structure.
🔻 SCENARIO 3: GAP-DOWN OPENING (Below 24,590)
(Gap-down of 100+ points)
A gap-down below 24,590 brings Nifty closer to the key support zone of 24,468–24,490 .
If price opens and sustains below 24,468 , it confirms a breakdown and can extend losses toward 24,313–24,356 (Buyer’s Support Zone) .
Look for breakdown + retest structure. A bearish candle rejection near 24,468–24,490 post-open offers a high-probability shorting setup.
On the contrary, if price reverses from 24,468 or 24,313 with strong bullish candles (like hammer or engulfing), you can consider long trades for intraday pullbacks with targets back to 24,600–24,685 .
Avoid bottom fishing blindly. Let structure confirm reversal or continuation.
👉 Educational Insight: Gap-downs near support zones can trap both bulls and bears. Always let confirmation come through – don’t force entries on emotion.
💡 RISK MANAGEMENT & OPTIONS TRADING TIPS:
⚠️ Don’t chase premiums in first 5–10 mins — let volatility settle.
📌 Prefer ATM or slightly ITM options for intraday directional trades.
📊 Use spreads (e.g., Bull Call or Bear Put) to limit risk in breakout/breakdown setups.
⏳ Don’t hold out-of-the-money options too long — theta decay can erode value quickly.
📉 Always have a stop-loss or defined risk — either on candle structure or option premium basis.
💰 Risk only 1–2% of your trading capital per trade.
👉 Pro Tip: Treat option premiums like a stock — don’t average losers, and use trailing SL to lock profits when trades move in your favor.
📌 SUMMARY & CONCLUSION:
🔹 Immediate Resistance Zone: 24,752 – 25,026
🔹 Immediate Support Zone: 24,468 – 24,490
🔹 Trend Reversal Support: 24,313 – 24,356
🔹 Breakout Confirmation: Above 25,026
🔹 Breakdown Confirmation: Below 24,468
🔹 No Trade Zone: Between 24,600 – 24,750 unless breakout confirmed
The market structure suggests a possible breakout or reversal in play depending on opening action. A patient trader should let the first few candles guide the direction. Stay disciplined, don’t predict — prepare, react, and protect capital.
⚠️ DISCLAIMER:
I am not a SEBI-registered analyst . This trading plan is shared for educational purposes only . Please consult with your financial advisor or do your own analysis before taking any trades. Markets are uncertain — trade responsibly.
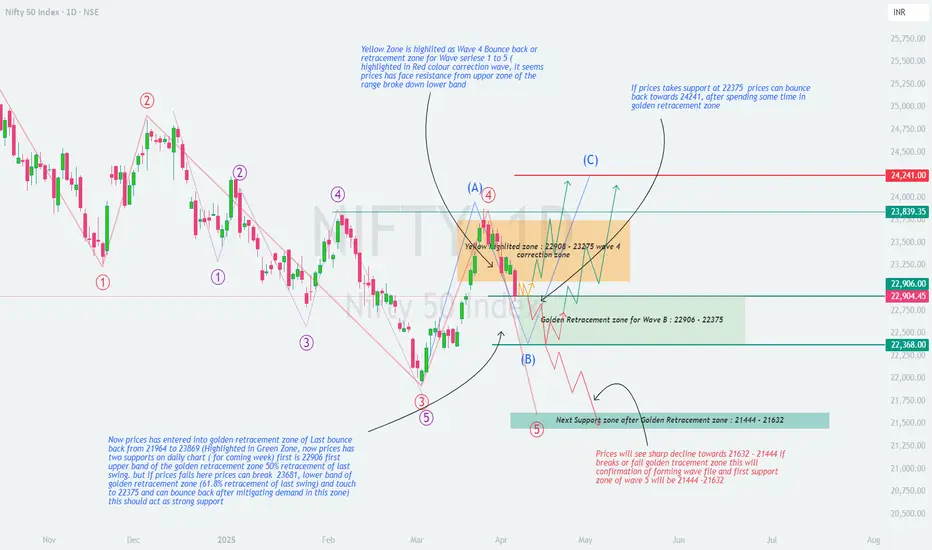
NIFTY : Weekly Analysis (07-Apr to 11-Apr)📊 NIFTY 50 Weekly Analysis – Elliott Wave & Retracement Outlook (April Week 2)
As per the latest Elliott Wave analysis and Fibonacci retracement zones plotted on the chart, NIFTY is currently at a critical juncture . Price action from here will define whether the market resumes upward correction or heads for a deeper fall.
🧠 Technical Structure Overview
The red-labelled impulse wave series 1 to 5 has completed, indicating a completed correction wave structure .
A corrective bounce has been observed post-Wave 5 in the form of Wave A .
Price is now moving in a Wave B correction and has entered a key Fibonacci retracement zone.
📍 Important Zones to Watch
🔶 Yellow Zone – Wave 4 Correction Resistance:
Range: 22,908 – 23,275
This was a previous bounce zone (Wave 4), now acting as a resistance range.
Price faced strong rejection here and reversed down into retracement territory.
🟩 Golden Fibonacci Retracement Zone for Wave B:
Range: 22,906 – 22,368
Price has entered this critical retracement zone.
This range corresponds to:
50% retracement = 22,906 (upper band)
61.8% retracement = 22,368 (lower band)
Implication: If NIFTY sustains within this zone and forms a base, it may initiate a move towards Wave C.
🧭 Scenarios for Coming Week
✅ Bullish Scenario:
If price sustains above 22,368 and reclaims 22,906, it can bounce back towards:
🎯 Target 1: 23,839
🎯 Target 2: 24,241 (Wave C projection)
Confluence: Wave A-B-C projection fits well within this move.
❌ Bearish Scenario:
If price breaks below 22,368 and fails to hold the golden zone:
Expect a sharp decline towards support zone: 21,444 – 21,632
This move would confirm the formation of another impulsive Wave 5 down .
🔍 Key Support and Resistance Levels
Resistance:
22,908
23,275
23,839
24,241
Support:
22,906 (Upper Golden Zone)
22,368 (Lower Golden Zone)
21,632 – 21,444 (Major Support Zone)
📌 Conclusion:
NIFTY is in a decisive zone. Whether we go for Wave C up or another Wave 5 down depends on price action within the 22,906 – 22,368 zone .
Traders should:
Watch for confirmation candles and volumes.
Use demand zone reactions to position accordingly.
Maintain strict risk management.
💬 Share your views in the comments – do you expect a bounce from here or a breakdown?
#NIFTY50 #ElliottWave #TechnicalAnalysis #TradingView #NIFTYAnalysis #Fibonacci #SwingTrading #PriceAction
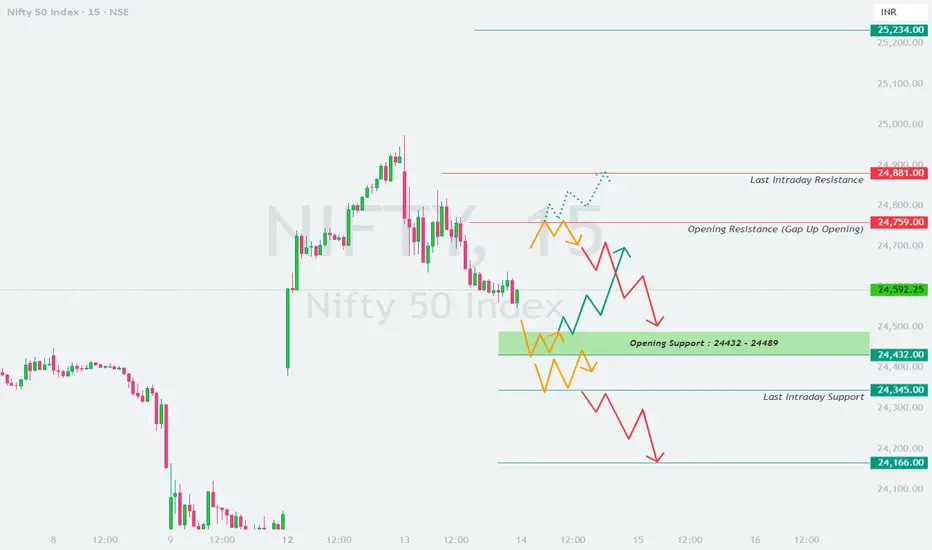
NIFTY : Trading Levels and Plan for 14-May-2025📊 NIFTY TRADING PLAN – 14th May 2025 (15-Min Chart Analysis)
Nifty closed at 24,592.25 on 13-May-2025. As per the structure, the index is consolidating near its immediate support zone of 24,432–24,489 , while facing resistance from 24,759–24,881 . The opening on 14-May-2025 will play a crucial role in deciding the next directional move.
Gap threshold considered = 100 points+ (as per your preference).
🟢 SCENARIO 1: GAP-UP OPENING (Above 24,692)
(100+ points gap-up from previous close)
If Nifty opens above 24,692 , price enters the Opening Resistance Zone of 24,759–24,881 , where sellers have been active previously.
Wait for the first 15–30 minutes to observe whether bulls are able to sustain above 24,881 (Last Intraday Resistance) .
If a strong bullish candle closes above 24,881 , you may consider going long with targets towards 25,000–25,234 and a stop-loss below 24,830.
However, if price faces rejection around 24,759–24,881 (e.g., long upper wicks or bearish engulfing), shorting opportunity opens up with target near 24,600 and 24,489 .
Avoid buying calls at open unless structure confirms breakout. Let the momentum build and structure get established.
👉 Educational Tip: Gaps near resistance zones often get filled. Waiting for a retest or breakout confirmation improves win probability.
🟨 SCENARIO 2: FLAT OPENING (Between 24,492 – 24,692)
(Minor change from previous close)
A flat opening between Opening Resistance (24,759) and Opening Support (24,432–24,489) suggests sideways bias.
Price action will likely chop between support and resistance unless a clean breakout or breakdown occurs.
Upside move will be considered only on a break above 24,759 , where one can go long with target near 24,881 . Stop-loss can be placed below 24,700.
If the price fails to hold 24,432 and closes below it, this breakdown may push Nifty towards 24,345 or even 24,166 (Last Intraday Support) .
Avoid trading in no-clear-structure zones. Let price establish a direction after opening range.
👉 Educational Tip: Flat opens after prior range-bound days often resolve into trending moves later in the session. Trade breakouts with volume confirmation.
🔻 SCENARIO 3: GAP-DOWN OPENING (Below 24,492)
(100+ points gap-down from previous close)
A gap-down below the Opening Support zone b implies bearish control at open.
If Nifty opens below 24,432 and sustains, shorting opportunities arise with targets at 24,345 and 24,166 .
Do not short aggressively at open. Let the first 5–10 mins settle, and look for confirmation candles (e.g., breakdown + retest).
In case of a bounce back toward 24,430–24,460 , if price fails to break above this zone, it may act as a fresh supply area. Use this level to reinitiate short trades.
If price reverses from 24,345 or 24,166 with strong bullish structure, counter-trend buying is allowed with defined SL.
👉 Educational Tip: A breakdown of a key level on a gap-down day often accelerates momentum. Don’t chase – wait for pullbacks.
💡 OPTIONS TRADING & RISK MANAGEMENT TIPS:
📌 Trade near-the-money (ATM) or slightly ITM options for better delta exposure.
📌 Avoid deep OTM option buying unless breakout or breakdown is confirmed.
📌 Use multi-leg strategies (like spreads) to reduce risk in volatile conditions.
📌 Place SL based on structure (previous candle low/high or support/resistance).
📌 Never risk more than 1–2% of capital per trade.
📌 Do not hold losing options hoping for recovery. Theta decay is unforgiving.
👉 Pro Tip: In flat or slow sessions, switch to stock-specific option plays rather than forcing trades on Nifty.
📌 SUMMARY & CONCLUSION:
🔸 Opening Resistance Zone: 24,759–24,881
🔸 Opening Support Zone: 24,432–24,489
🔸 Breakout Confirmation: Above 24,881
🔸 Breakdown Confirmation: Below 24,432
🔸 Major Targets: 25,234 on upside, 24,166 on downside
🔸 No Trade Zone: Inside 24,489–24,759 unless price breaks out or down with volume
Nifty remains at a decisive support area. A trending move is possible if price breaks out of the current compression zone. Let the market lead — follow the levels, not the emotions. Focus on structure, manage risk, and stay alert for trap candles at open.
⚠️ DISCLAIMER:
I am not a SEBI-registered analyst . The above analysis is for educational purposes only . Please do your own research or consult a SEBI-registered advisor before taking any trades. Trade at your own risk.
13th May 2025 Nifty 50 Prediction & Trading Zone#Nifty50 #option trading
🚀 If you like my trading plan and levels, don't forget to boost the post
99% working trading plan ( Opning Possibility FLAT TO DOWN )
👉Gap up open 24742 above & 15m hold after positive trade target 24923, 25040
👉Gap up open 24742 below 15m not break upside after nigetive trade target 24490, 24340
👉Gap down open 24490 above 15m hold after positive trade target 24742 ,24923, 25040
👉Gap down open 24490 below 15m not break upside after nigetive trade target 24340, 24108
📌 Trade plan for education purpose I'm not responsible your trade
More education follow social media and boost my idea
📌 koi bhi trade leval se 20 point ke sl ke bhina karan nahi hi
📌 koi trade app activate tabhi karana hota hi level pe 2 candle uper ya niche closing aati hai to
📌 leval par Ane pe turant trade plan na kare ...
📌 Full risk apaki hi hi meri nahi
Nifty 50 Technical Analysis - May 13, 2025Nifty 50 Technical Analysis - May 13, 2025
Current Market Overview:
Closing Price: The Nifty 50 closed at 24592.25, down 381.55 points.
Day Range: Low: 24,378.85 | High: 24,944.80
52-Week Range: Low: 21,281.45 | High: 26,277.35
Market Sentiment: The market exhibited strong bullish momentum, driven by positive global cues, including a ceasefire between India and Pakistan and optimism around US-China trade negotiations
Chart for your reference

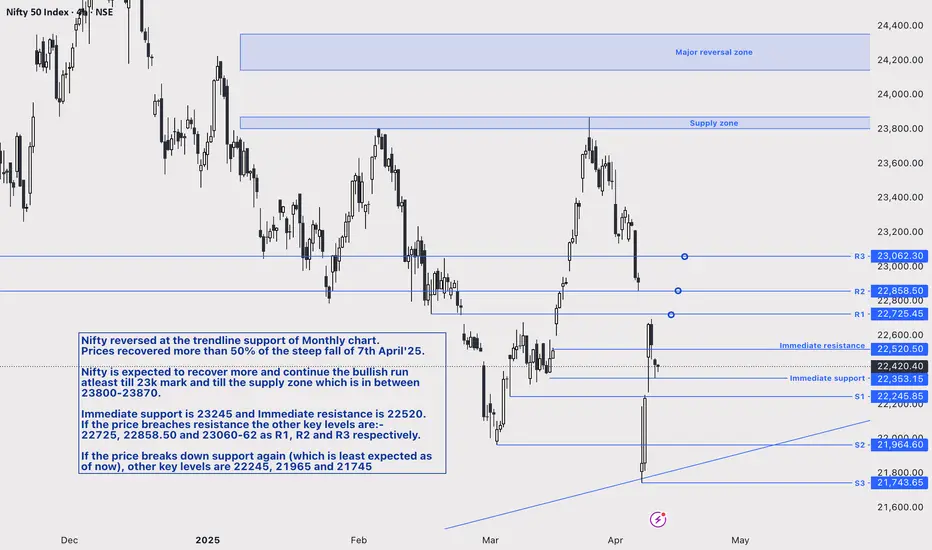
Nifty key levels for this weekNifty reversed at the trendline support of the Monthly chart.
Prices recovered over 50% of the steep fall of 7th April'25.
Nifty is expected to recover more and continue the bullish run at least until the 23k mark and until the supply zone, which is between 23800 and 23870.
Immediate support is 23245 and Immediate resistance is 22520.
If the price breaches resistance the other key levels are:-
22725, 22858.50 and 23060-62 as R1, R2 and R3 respectively.
If the price breaks down support again (which is least expected as of now), other key levels are 22245, 21965 and 21745
Prices in spot.
Nifty 50 Technical Analysis (as of May 12, 2025)Nifty 50 Technical Analysis - May 12, 2025
Current Market Overview:
Closing Price: The Nifty 50 closed at 24,924.70, up 916.70 points (+3.82%), marking its best single-day performance in four years.
Day Range: Low: 24,378.85 | High: 24,944.80
52-Week Range: Low: 21,281.45 | High: 26,277.35
Market Sentiment: The market exhibited strong bullish momentum, driven by positive global cues, including a ceasefire between India and Pakistan and optimism around US-China trade negotiations
Chart for your reference

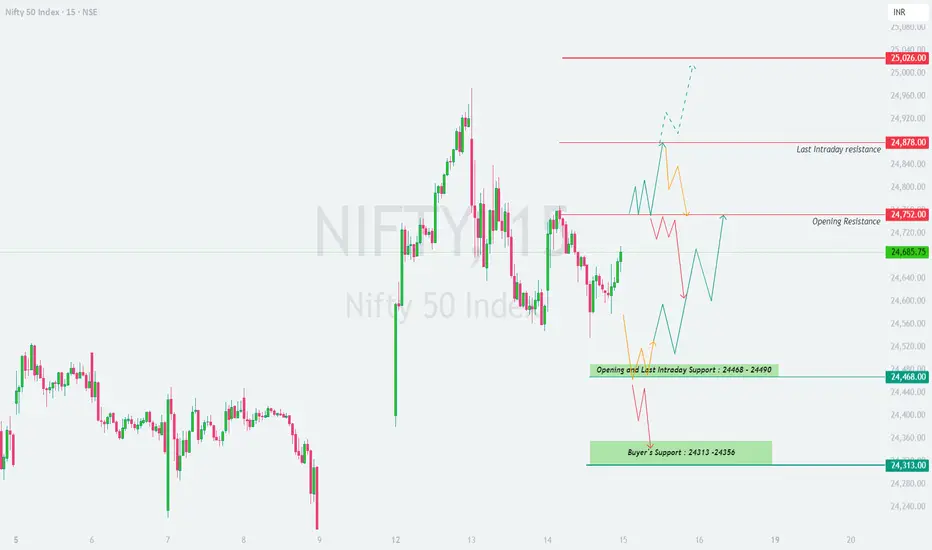
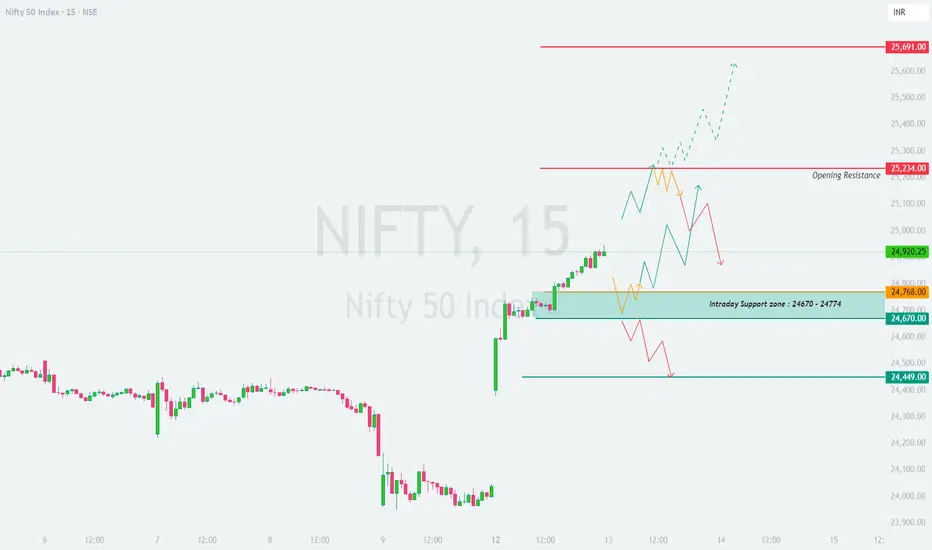
NIFTY : Trading Levels and Plan for 13-May-2025📈 NIFTY TRADING PLAN – 13th May 2025 (15-Min Chart Analysis)
Nifty closed at 24,920 on 12-May-2025. The recent structure shows a sharp bullish move with resistance forming near 25,234 and support around 24,670–24,768 .
The market is currently at a decision point, and the next move will depend heavily on where it opens. Below is a breakdown for each type of opening with actionable trade plans.
🟢 SCENARIO 1: GAP-UP OPENING (Opening Above 25,020)
(Gap up of 100+ points from previous close)
A gap-up above 25,020 places Nifty near the Opening Resistance zone at 25,234 . This is a crucial level that must be watched for either rejection or breakout.
If the index opens between 25,020 and 25,234 , wait and observe the first 15–30 minutes. Avoid jumping into a trade unless a clear bullish structure is formed.
A breakout and sustained move above 25,234 with strong candles can trigger a rally toward 25,691 . In such a case, long trades can be initiated with SL below 25,180 .
If price shows signs of rejection (wicks, bearish engulfing) near 25,234 , aggressive traders can look for a reversal trade with targets around 24,920 – 24,768 .
Avoid initiating trades at the opening candle in this zone — wait for follow-through confirmation.
👉 Educational Insight: Gap-ups near resistance zones often trap early buyers. Let the market confirm direction before committing.
🟨 SCENARIO 2: FLAT OPENING (Between 24,820 – 25,020)
(Open within previous close ±100 pts)
Flat openings inside the current range should be treated cautiously. Price is already in an indecisive zone.
Watch price behavior near 24,920 (previous close). If the index builds higher lows and breaks 25,020 with strength, it may attempt to test 25,234 .
On the downside, if the structure weakens and slips below 24,820 , we can see a dip toward the Intraday Support Zone of 24,670–24,768 .
Only trade breakout above 25,020 or breakdown below 24,768 with structure confirmation. This avoids getting trapped in sideways moves.
Avoid trades in tight 30–40 point ranges — these tend to chop traders with frequent reversals.
👉 Educational Insight: During flat opens, it’s best to let the initial price range form before making directional bets. Often, first 30–45 mins help define the day’s range.
🔻 SCENARIO 3: GAP-DOWN OPENING (Below 24,820)
(Gap down of 100+ points from previous close)
If Nifty opens below 24,820 , it will test the Intraday Support zone of 24,670 – 24,768 . This zone may offer a technical bounce.
Look for bullish reversal candles (hammer, morning star, bullish engulfing) in this zone. If seen, consider a long trade with target toward 24,920 and SL below 24,650 .
If this support zone breaks, and price sustains below 24,670 , expect further downside toward 24,449 .
In case of a breakdown below 24,670 followed by a retest and rejection from below, one may go short for intraday targets.
Avoid knife-catching on gap-downs. Let market absorb selling pressure first — wait for exhaustion or structure to form.
👉 Educational Insight: In gap-down scenarios, panic can create exaggerated moves. Patience and confirmation-based entries are key for safety.
🧠 RISK MANAGEMENT & OPTIONS TRADING TIPS:
Trade ATM or slightly ITM options to manage decay and increase responsiveness.
Never buy deep OTM options unless a very strong trending day is expected.
Use underlying index levels to define stop-loss — not just premium.
Keep maximum 2% of your capital at risk per trade .
Set alerts at key levels like 25,234, 24,768, and 24,670 to stay ahead of triggers.
Avoid overtrading. 1–2 good trades a day are more than enough.
Use a trailing SL once in profit zone to protect gains.
📌 SUMMARY & CONCLUSION:
🔸 Resistance Levels: 25,234 and 25,691
🔸 Support Zone: 24,670 – 24,768
🔸 Breakout Zone: Above 25,234
🔸 Breakdown Zone: Below 24,670
🔸 No Trade Zone: 24,820 – 25,020 (until clear move)
🧭 The market is currently resting just below a resistance zone. Confirmation-based breakout or pullback setups around key zones will offer the best opportunities. Don’t anticipate direction — let the market tell you.
⚠️ DISCLAIMER:
I am not a SEBI-registered analyst . The above trading plan is shared solely for educational purposes. Always consult a registered financial advisor before taking any trading or investment decision. Trade at your own risk with proper analysis and risk control.
Nifty Update: Key Supply Zone Test Ahead – Time to Book Partial On 27th February, I shared a detailed analysis explaining why Nifty was likely to take support from the Monthly Demand Zone .
At that time, the entire market was extremely bearish. FIIs were selling heavily, and most people believed that catching the bottom was impossible. But as demand and supply zone traders , we trusted the footprints of smart money—and as expected, Nifty took support exactly at that zone and reversed.
Today, Nifty is trading just below 5% of its all-time high . This shows the power of demand zones, which are not just random boxes but clear evidence of institutional activity.
Now, let's focus on the current market development .
📈 Nifty Nearing a Critical Supply Zone 📉
If you look at the chart, you'll see that Nifty is now approaching a Daily Supply Zone (Drop-Base-Drop) Which have strong follow-through, making this a strong resistance area .
In addition, I’ve marked a Weekly Supply Zone (Drop-Base-Rally) on the chart. Interestingly, the daily supply zone lies inside this weekly supply zone , creating a powerful confluence of resistance. This stacking of zones increases the probability of price facing rejection in this area.
📊 What Should Traders Do?
If you are holding profitable positions in stocks, this could be a good time to book partial profits .
Be prepared for a possible price rejection from the daily and weekly supply zone .
However, it’s not guaranteed that Nifty will fall from here. Price can also break through the zone, but as traders, capital protection comes first .
The most likely scenario is a small pullback , not a major fall. After the pullback, Nifty may resume its upward move.
Always focus on high-probability setups and manage your risk smartly.
📢 Conclusion:
Nifty is at a crucial supply zone cluster. A pullback is likely, so this could be a smart time to lock in some gains. Watch price action closely and adjust your strategy accordingly.
Lastly, Thank you for your support. Feel free to ask if you have questions.
“Trade what you see, not what you hear. The chart always whispers before the news screams.” 📊🔥
This analysis is purely for educational purposes and is not intended as a trading or investment recommendation. I am not a SEBI registered analyst.

Nifty Reversal Watch: Key Demand Zones & Moving Average in FocusAs a pure technical analyst, I rely solely on what the charts reveal, ignoring the noise of news and fundamentals. Charts tell the story in advance.
As a demand and supply zone trader, my primary focus is on identifying key areas where institutional activity is likely to drive price action. Today, we’ll analyze the Nifty 50 through the lens of demand zones and then complement it with traditional technical analysis using moving averages. This analysis aims to provide clarity on potential reversal zones and market behavior.
📊 Demand Zones: The Foundation of Analysis
Monthly & Quarterly Demand Zones : On the monthly timeframe, I’ve identified a critical demand zone. When we zoom into the quarterly timeframe, this zone aligns perfectly, creating a high-confluence area. These zones represent institutional footprints (Banks, mutual funds, etc. ), indicating where smart money is likely to step in. These are not just traditional lines or boxes on the chart; they are the footprints of institutions that control the market.
Significance of Demand Zones : Demand zones are areas where buyers are expected to dominate, often leading to price reversals. The confluence of monthly and quarterly demand zones increases the probability of a strong support level.
Current Price Action : Nifty is currently hovering near these demand zones, suggesting a potential bottom formation.
📊 Traditional Technical Analysis: Moving Averages
Now, let’s analyze the market through the lens of traditional technical analysts who rely on moving averages.
EMA 20 on Monthly Timeframe : The 20-period EMA on the monthly chart acts as a reliable support level historically. Since 2004, price reversals have consistently occurred near this moving average, marked by green circles on the chart.
EMA 20 as a Magnet : The EMA 20 on the monthly timeframe is equivalent to the 400-period EMA on the daily timeframe, representing the average price of almost 400 days. In trending markets, price always reverts to its average, making this a critical level to watch.
Historical Exceptions : While there are rare instances (marked by red circles) where Nifty has broken below the monthly EMA 20, the presence of demand zones adds an extra layer of support, reducing the likelihood of a significant breakdown.
Current Price Action : Nifty is currently near the monthly EMA 20, which coincides with the monthly and quarterly demand zones.
📊 Combining Both Approaches
High-Confluence Area : The alignment of monthly and quarterly demand zones with the monthly EMA 20 creates a high-confluence area. This increases the likelihood of a strong support level and a potential Bottom.
Risk Management : While the setup appears promising, it’s crucial to manage risk effectively. Always use strict stop-loss orders and avoid over-leveraging. Even high-probability setups can fail, especially when market sentiment is overwhelmingly negative.
📊 Conclusion
The Nifty 50 is at a critical juncture, with multiple technical indicators pointing towards a potential reversal or consolidation. The confluence of demand zones and the monthly EMA 20 provides a high-probability setup. However, always remember that no setup is foolproof, and risk management is crucial, it’s essential to remain cautious as markets can sometimes defy all technical setups.
This analysis is purely for educational purposes and is not intended as trading or investment advice. I am not a SEBI-registered analyst.
Lastly, thank you for your support.
"The market is a master of patience; trade with discipline, not emotion." 🚀📊

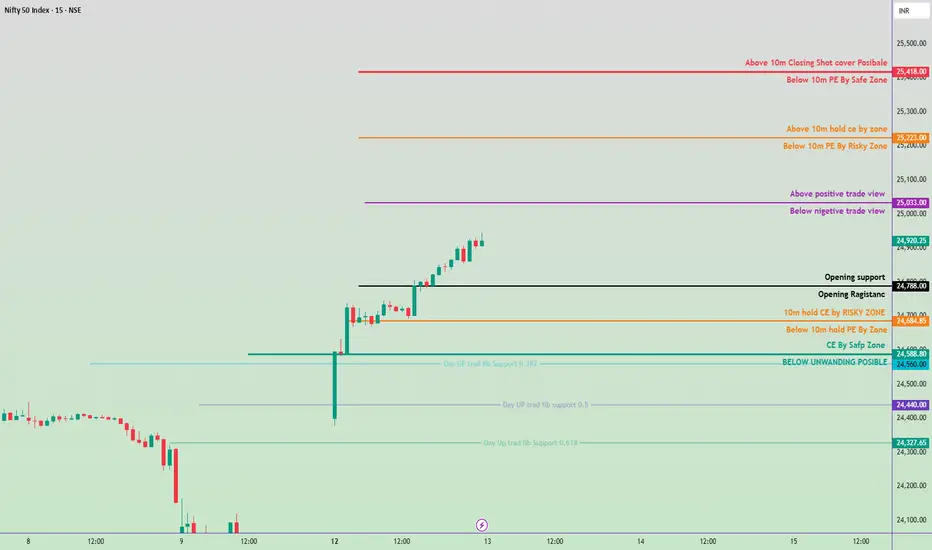
13th May 2025 Nifty 50 Prediction & Trading Zone#Nifty50 #option trading
🚀 If you like my trading plan and levels, don't forget to boost the post
99% working trading plan ( Opning Possibility gap Up)
👉Gap up open 25033 above & 15m hold after positive trade target 25223, 25420
👉Gap up open 25033 below 15m not break upside after nigetive trade target 24788, 24684
👉Gap down open 24788 above 15m hold after positive trade target 25033 ,25223, 25420
👉Gap down open 24788 below 15m not break upside after nigetive trade target 24684, 24588
📌 Trade plan for education purpose I'm not responsible your trade
More education follow social media and boost my idea
📌 koi bhi trade leval se 20 point ke sl ke bhina karan nahi hi
📌 koi trade app activate tabhi karana hota hi level pe 2 candle uper ya niche closing aati hai to
📌 leval par Ane pe turant trade plan na kare ...
📌 Full risk apaki hi hi meri n
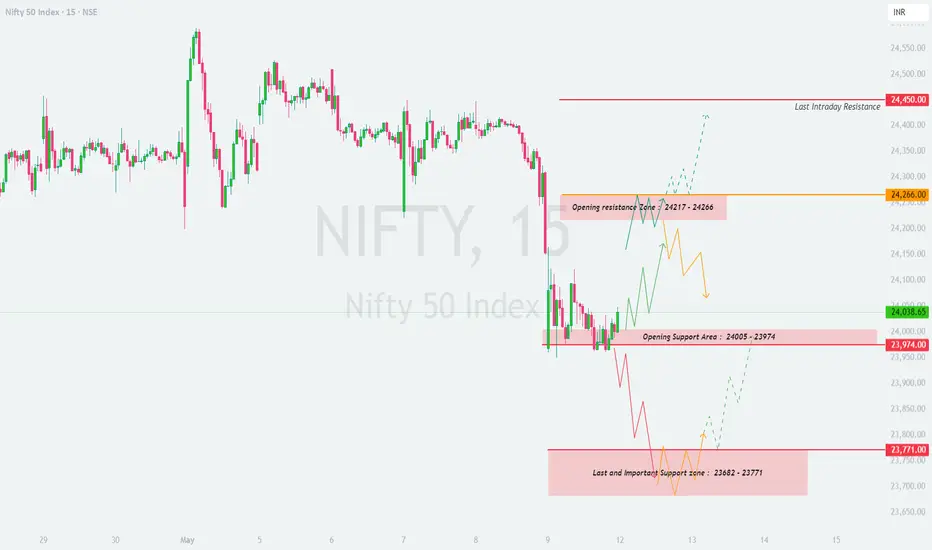
NIFTY : Trading levels and Plan for 12-May-2025📊 NIFTY Trading Plan for 12-May-2025 (15-min Chart)
We’re currently trading near the 24,038 level . The chart suggests clearly defined support and resistance zones which will guide our trading actions depending on the opening. Remember: we define a gap opening as 100+ points away from the previous close.
🟢 SCENARIO 1: Gap-Up Opening (Above 24,266)
If Nifty opens with a gap-up above the Opening Resistance Zone (24,217 – 24,266) and sustains above it:
Watch for price action near 24,266 – if it holds, bulls might push toward the last intraday resistance of 24,450 .
Ideal entry: On retest of 24,266 with a strong bullish candle.
Targets: 🎯 24,375 – 24,450
Stop Loss: 🔻 Below 24,200 on an hourly candle close.
However, if price opens above but slips back below 24,217, it might indicate a false breakout. In that case, wait for confirmation before taking aggressive trades.
🟨 SCENARIO 2: Flat Opening (Between 24,038 and 24,100)
A flat opening would place us within the current trading range. This is a zone of indecision, so patience is key.
Observe how price reacts near the Opening Resistance Zone (24,217 – 24,266) and Opening Support Zone (24,005 – 23,974) .
Bullish bias above 24,100 with confirmation candle targeting 24,217 and eventually 24,266.
Bearish bias only below 23,974 – look for breakdown and confirmation for short opportunities.
Avoid trades within this tight zone until a breakout or breakdown happens with volume.
Wait at least 15–30 mins post-opening for direction clarity. Let the market show its hand.
🔻 SCENARIO 3: Gap-Down Opening (Below 23,900)
This could lead to a test of the Last Support Zone: 23,682 – 23,771 . This zone is crucial.
If the index opens below 23,900 and heads toward 23,771–23,682, expect demand from this support.
Look for bullish reversal candles in this zone for a possible intraday bounce.
If breakdown happens below 23,682 with volume and a 15-min close, market could slide further towards 23,550–23,450 levels.
Avoid catching falling knives. Wait for confirmation (hammer, bullish engulfing).
Be cautious on put side here unless breakdown sustains – whipsaws are common near strong supports.
📘 Risk Management Tips for Options Traders 🧠
Avoid buying deep OTM options. Stick to ATM or slightly ITM contracts for better delta and lower decay.
Always define your risk with stop-loss based on candle closes (ideally 15 or 1-hour).
Don’t trade just on gap logic. Wait for the price to respect or reject key levels.
Trail your profits instead of aiming for unrealistic targets. Consistency > Jackpot.
Position sizing is key. Never risk more than 1–2% of your capital on a single trade.
📌 Summary & Conclusion:
Key Levels to Watch: 👀
🔸 Opening Resistance Zone: 24,217 – 24,266
🔸 Opening Support Zone: 24,005 – 23,974
🔸 Major Support Area: 23,682 – 23,771
🔸 Upside Resistance: 24,450
This is a day to let the market settle in early trades. Direction will be determined by breakout or breakdown from the marked zones . Don’t chase; instead react to the market’s structure with discipline.
⚠️ Disclaimer:
I am not a SEBI-registered analyst. All views shared here are for educational purposes only. Please consult your financial advisor before taking any position. Trade at your own risk.