NIFTY BLOW OFF TOP WITH GDP DATAI see nifty forming a blow off top on monday with the Gdp data of 8.2 of q2 ..
monthly, weekly, daily top open high same
Later falls by 18800 in the black wxy pattern forming bigger time frame wave a.
Even the last leg of uside forming diamteric bow tie pattern of neo wave theory..
ABCDEFG.. all are coming close to complete..
this December will be great to watch..
If it happen in the said time line then we are going to see a big bear market..
Welcome to 1929 again.. Fingers crossed..
* ONLY FOR TUTORIAL PURPOSE, DONOT TRADE ON THIS VIEW..
Niftyprediction

NIFTY KEY LEVELS FOR 28.11.2025NIFTY KEY LEVELS FOR 28.11.2025
Timeframe: 3 Minutes
If the candle stays above the pivot point, it is considered a bullish bias; if it remains below, it indicates a bearish bias. Price may reverse near Resistance 1 or Support 1. If it moves further, the next potential reversal zone is near Resistance 2 or Support 2. If these levels are also broken, we can expect the trend.
When a support or resistance level is broken, it often reverses its role; a broken resistance becomes the new support, and a broken support becomes the new resistance.
If the range(R2-S2) is narrow, the market may become volatile or trend strongly. If the range is wide, the market is more likely to remain sideways
please like and share my idea if you find it helpful
📢 Disclaimer
I am not a SEBI-registered financial adviser.
The information, views, and ideas shared here are purely for educational and informational purposes only. They are not intended as investment advice or a recommendation to buy, sell, or hold any financial instruments.
Please consult with your SEBI-registered financial advisor before making any trading or investment decisions.
Trading and investing in the stock market involves risk, and you should do your own research and analysis. You are solely responsible for any decisions made based on this research.

#NIFTY Intraday Support and Resistance Levels - 28/11/2025Nifty is expected to open with a slightly gap-up start today, reflecting a mild bullish tone as the market attempts to build on the recent recovery. The price is hovering near a crucial structure zone, and holding above the 26250–26300 range will be essential for sustaining upward momentum. If Nifty manages to remain stable above this breakout area after the opening, the long setup becomes active, targeting 26350, 26400, and 26450+. A strong continuation move above 26500 can further accelerate the upside, potentially pushing the index toward the higher targets of 26650, 26700, and even 26750+, especially if broader sentiment supports the move.
On the downside, any weakness will only be confirmed if the index faces rejection from the 26250–26200 zone, where a reversal short opportunity opens up. This downside structure carries immediate targets at 26150, 26050, and 26000-, indicating that sellers may try to reclaim short-term control if Nifty fails to hold the breakout region. Until then, the bias remains moderately positive due to the slightly gap-up opening, and intraday direction will largely depend on how price behaves around these key reaction levels.

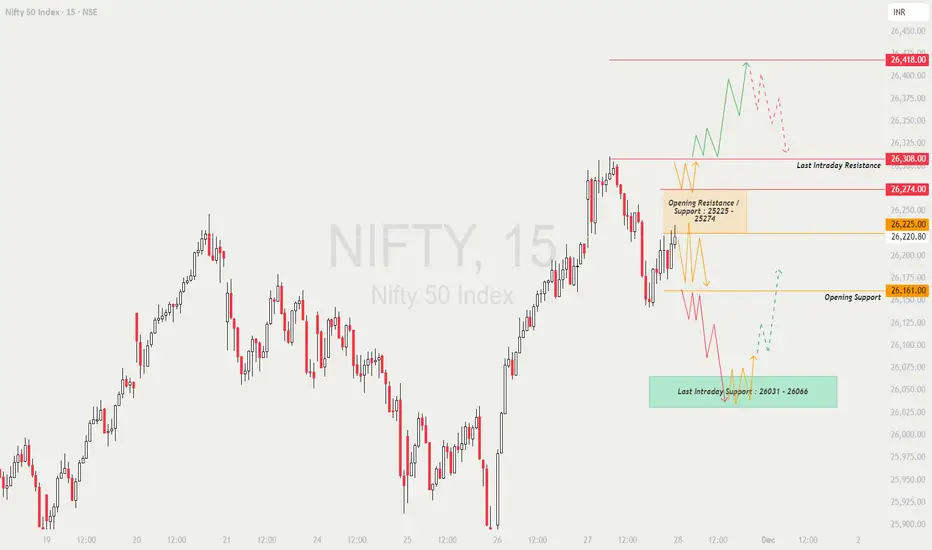
NIFTY : Trading levels and Plan for 28-Nov-2025📊 NIFTY TRADING PLAN — 28 NOV 2025
Nifty closed around 26,220, after bouncing strongly from lower levels and now sitting just below an important Opening Resistance / Support Zone (26,225–26,274).
The market is positioned between major overhead resistance and key intraday support.
This increases the importance of the opening direction.
Key Intraday Levels
🟧 Opening Resistance / Support Zone: 26,225 – 26,274
🟥 Last Intraday Resistance: 26,308
🟥 Profit Booking Zone: 26,418
🟩 Opening Support: 26,161
🟩 Last Intraday Support: 26,031 – 26,066
🟢 SCENARIO 1 — GAP-UP OPENING (100+ Points)
If Nifty opens around 26,300–26,350, it directly enters the resistance territory.
If price sustains ABOVE 26,308 for 10–15 minutes →
⭐ Expect bullish continuation toward → 26,360 → 26,395 → 26,418
If Nifty rejects 26,308 with sharp wicks →
Expect pullback toward → 26,274 → 26,225
Avoid long entries immediately at open — gap-ups near resistance can cause bull traps.
Best long setup = Breakout → Retest above 26,308 → Continuation.
📘 Educational Note:
Resistance-based gap-ups often create volatility. Always wait for confirmation candles, not emotional entries.
🟧 SCENARIO 2 — FLAT OPENING (26,200–26,250 Range)
A flat open places Nifty inside or just below the Opening Resistance / Support Zone.
A breakout above 26,274 →
Targets → 26,308 → 26,360 → 26,418
Failure to sustain above the zone may drag price back to 26,161.
Inside the 26,225–26,274 zone →
No high-probability trade. Avoid jumping into noise.
Best trades:
✔️ Breakout retest above 26,274
✔️ Breakdown below 26,161
✔️ Long from Last Intraday Support 26,031–26,066 (strong bounce zone)
💡 Educational Tip:
Flat openings provide the most reliable trend insight through the first 15-min candle. Let price choose direction — don’t force trades.
🔻 SCENARIO 3 — GAP-DOWN OPENING (100+ Points)
A gap-down around 26,080–26,120 brings Nifty near the Opening Support (26,161) area.
If price rejects 26,161 with bullish wick →
Reversal targets → 26,200 → 26,225 → 26,274
If price breaks 26,161 decisively →
Price will slide quickly toward the big support → 26,031–26,066
A strong bounce at 26,031–26,066 offers an attractive long opportunity.
If 26,031 breaks with momentum →
Expect downside extension → 25,980 → 25,940
📘 Educational Note:
Gap-downs into support often give excellent reversal trades — but NEVER without confirmation.
Watch for higher lows or bullish engulfing candles.
💼 RISK MANAGEMENT TIPS FOR OPTION TRADERS 💡
Avoid the first 5 minutes — large gap openings often reverse quickly.
Use ATM or ITM options for directional momentum.
NEVER average a losing option trade.
Use fixed SL based on structure, not on premium.
When VIX is low → prefer option buying.
When VIX is high → hedged option selling is safer.
Book partial profits near resistance zones like 26,308 & 26,418.
⚠️ Golden Rule:
Protect your capital first — good opportunities always come after clarity.
📌 SUMMARY
Bullish Above → 26,274
Targets → 26,308 → 26,360 → 26,418
Bearish Below → 26,161
Targets → 26,120 → 26,066 → 26,031 → 25,980
High-Risk Zones:
🟧 26,225–26,274 (Opening whipsaw zone)
🟥 26,308–26,418 (Profit booking region)
🧾 CONCLUSION
Nifty is approaching a strong overhead resistance zone, and the opening candle will decide whether we get a breakout continuation or a pullback day.
The highest-probability trades will come from:
✔️ Breakout retest above 26,274
✔️ Rejection / reversal at 26,308
✔️ Bounce from 26,031–26,066
✔️ Breakdown below 26,161 for momentum shorts
Trade only clean structures — avoid noise inside the middle consolidation zone.
⚠️ DISCLAIMER
I am not a SEBI-registered analyst.
This analysis is meant only for educational purposes.
Please consult a certified financial advisor before trading or investing.
NIFTY KEY LEVELS FOR 27.11.2025NIFTY KEY LEVELS FOR 27.11.2025
Timeframe: 3 Minutes
If the candle stays above the pivot point, it is considered a bullish bias; if it remains below, it indicates a bearish bias. Price may reverse near Resistance 1 or Support 1. If it moves further, the next potential reversal zone is near Resistance 2 or Support 2. If these levels are also broken, we can expect the trend.
When a support or resistance level is broken, it often reverses its role; a broken resistance becomes the new support, and a broken support becomes the new resistance.
If the range(R2-S2) is narrow, the market may become volatile or trend strongly. If the range is wide, the market is more likely to remain sideways
please like and share my idea if you find it helpful
📢 Disclaimer
I am not a SEBI-registered financial adviser.
The information, views, and ideas shared here are purely for educational and informational purposes only. They are not intended as investment advice or a recommendation to buy, sell, or hold any financial instruments.
Please consult with your SEBI-registered financial advisor before making any trading or investment decisions.
Trading and investing in the stock market involves risk, and you should do your own research and analysis. You are solely responsible for any decisions made based on this research.

Downtrendline Breakout Explained: Gravita India Limited case📊 Downtrendline Breakout Explained: Gravita India Limited Case Study
Gravita India Limited, currently trading near ₹1851 on the daily chart, offers a practical example of how technical analysis concepts like downtrendlines, breakouts, and risk management play out in real markets. Let’s break down the scenario step by step.
🔻 Understanding the Downtrendline & Its Resistance
A downtrendline is drawn by connecting successive lower highs during a declining phase.
It acts as a resistance line, where sellers consistently overpower buyers whenever price attempts to rally.
Since September 2024, Gravita India Limited has faced repeated rejections at this line, confirming the strength of the downtrend.
Each rejection reinforced bearish sentiment, discouraging long positions until a decisive breakout occurred.
⏳ Long Consolidation Before Breakout
After months of struggling under the downtrendline, the stock entered a consolidation phase.
Consolidation represents a period of accumulation, where buyers quietly absorb supply from sellers.
The longer the consolidation, the stronger the eventual breakout tends to be, as pent-up demand is released.
Gravita’s breakout above the downtrendline after this extended base-building adds credibility to the move.
🌐 Breakout Alignment with Broader Trend
While the short-term trend was down, the broader trend remained upward.
Breakouts that align with the primary trend are considered high-probability setups.
Gravita’s breakout is not a counter-trend rally but a resumption of the larger uptrend, making it more reliable for swing and positional traders.
⚖️ Risk Management & Stop Loss Strategy
No breakout strategy is complete without risk control. Traders typically manage risk as follows:
Stop Loss Placement
Place stops just below the breakout level or the most recent swing low.
For Gravita, this could mean a stop near the downtrendline or consolidation base.
Risk-Reward Ratio
Aim for at least a 2:1 or 3:1 reward-to-risk ratio.
Avoid chasing the breakout if price has already surged far; wait for a retest of the breakout zone.
False Breakout Awareness
Not every breakout sustains. A quick reversal below the line is a warning sign.
Volume confirmation (higher-than-average trading activity) adds conviction to the breakout.
💡 Opportunity in Gravita India Limited
The breakout signals a shift from downtrend to uptrend, opening opportunities for traders and investors.
With the broader trend already bullish, this breakout could mark the beginning of a fresh rally.
Traders may look for short-term momentum trades, while investors can view this as a continuation of the long-term growth story.
Patience and disciplined risk management remain key to capitalizing on such setups.
📝 Key Takeaways
Downtrendlines act as strong resistance during bearish phases.
A breakout after long consolidation signals a powerful trend reversal.
When aligned with the broader uptrend, breakouts carry higher reliability.
Stop losses and risk management protect against false signals.
Gravita India Limited’s breakout offers a textbook opportunity for traders to study and apply these principles.

#NIFTY Intraday Support and Resistance Levels - 27/11/2025Nifty is expected to open with a gap-up today, signalling strong bullish sentiment as price approaches the crucial resistance zone near 26250. If the index sustains above 26250 after the opening, the long setup becomes active with upside targets of 26350, 26400, and 26450+. A strong breakout above this level can extend the move further toward higher zones.
On the downside, a reversal short opportunity will emerge only if Nifty rejects the 26250–26200 zone, activating downside targets at 26150, 26050, and 26000-. Additionally, a long setup remains valid above the 26000–26050 zone with targets of 26150, 26200, and 26250+. With a gap-up opening, the early trend stays bullish, but sustaining above the breakout level is essential for continuation toward higher targets.

Market Isn’t Manipulated — It’s Just MisunderstoodI’ve seen so many FinGurus, influencers, and even new students say that the Indian market or the index is “manipulated.”
Let me break that illusion today — the index is not manipulated.
When people don’t understand something, they either blame it… or glorify it.
The market is neither God nor a gangster.
It simply reflects data, structure, and behaviour — all visible on the chart.
If you’ve been reading my commentary daily, you already know the truth:
The market is predictable when you track the right technicals and price action.
Most people just don’t pay attention to the details.
Now let’s come back to NSE:NIFTY
Exactly as expected, today’s dip got bought immediately.
And yesterday I clearly wrote that if Nifty sustains above 26000 even on hourly, the Sell-on-Rise idea becomes invalid.
That’s exactly what happened.
So from here on, the approach shifts to Buy the Dip —
but only from intraday supports + OI buildup zones.
Pivot is at 26087 and Nifty is comfortably above it.
Pivot Percentile is wide, which usually signals a sideway day where dips get bought.
Based on the structure, I think Nifty may form an Inside Bar tomorrow —
a day where both sides get trapped and liquidity is absorbed quietly.
So my plan is simple:
I’ll wait for the Pivot to tighten and prepare for the next breakout opportunity.
If the index doesn’t move according to my plan, I won’t trade — no matter how big the breakout looks.
I only trade what I can plan. Nothing else.
Let’s see what tomorrow brings and then act accordingly.
Take care. Have a profitable tomorrow.
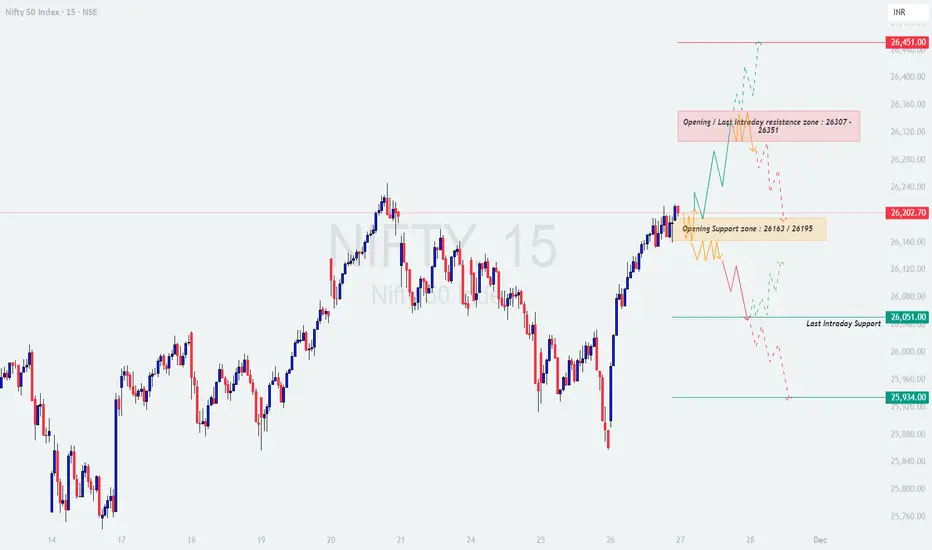
NIFTY : Trading levels and Plan for 27-Nov-2025📊 NIFTY TRADING PLAN — 27 NOV 2025
Nifty closed around 26,202, sitting right under the Opening / Intraday Resistance Zone (26,307–26,351) and above the Opening Support Zone (26,163–26,195).
Market structure is slightly bullish but still inside a supply region, meaning the opening reaction will decide trend strength.
Key Level Zones to Track:
🟥 Opening / Last Intraday Resistance Zone: 26,307 – 26,351
🟥 Major Resistance: 26,451
🟧 Opening Support Zone: 26,163 – 26,195
🟩 Last Intraday Support: 26,051
🟩 Major Downside Support: 25,934
🟢 SCENARIO 1 — GAP-UP OPENING (100+ Points)
If Nifty opens around 26,300–26,360, price immediately enters the opening/intraday resistance zone.
If price sustains above 26,351 for 10–15 minutes →
⭐ Upside targets → 26,395 → 26,420 → 26,451
If price rejects the 26,307–26,351 zone →
Expect a correction toward 26,250 → 26,195
A bullish retest above 26,307 can offer a continuation long opportunity.
Avoid chasing long directly on gap-up — opening candles at resistance often trap buyers.
📘 Educational Note:
Gap-ups near a major supply zone require confirmation. Look for higher low formation or strong bullish candle closing above resistance before entering.
🟧 SCENARIO 2 — FLAT OPENING (Near 26,170–26,210)
A flat open puts Nifty inside the Opening Support Zone (26,163–26,195) — a decision-making region.
Breakout above 26,210 →
Targets → 26,260 → 26,307 → 26,351
Breakdown below 26,163 →
Targets → 26,120 → 26,080 → 26,051
Avoid trading inside the 26,163–26,210 range until a clear breakout forms.
Best trades:
✔️ Breakout → Retest → Continuation
✔️ Support bounce from 26,163
💡 Educational Tip:
Flat openings usually define trend early. The first 15-minute candle often gives directional bias — don’t rush into the chop.
🔻 SCENARIO 3 — GAP-DOWN OPENING (100+ Points)
A gap-down below 26,120 brings price directly toward 26,051 (last intraday support).
If 26,051 holds with strong wick rejections →
Upside targets → 26,100 → 26,163 → 26,195
If price breaks 26,051 decisively →
Next downside zone → 25,980 → 25,934
A bounce from 25,934 can give a powerful reversal trade — but only after confirmation.
If price stays below 26,051, expect trend-day weakness and follow-through selling.
📘 Educational Note:
Gaps into strong support zones often create high-quality reversal opportunities, but ONLY after confirmation through candle structure + volume.
💼 RISK MANAGEMENT TIPS FOR OPTION TRADERS 💡
Avoid trading immediately at market open, especially during gaps.
Use ITM options for directional trades to reduce theta decay.
Follow strict SL based on structure — never widen stop losses.
Do NOT average losing trades.
If VIX is low → option buying works better.
If VIX is high → use spreads or hedged selling.
Book partial profits at levels to protect gains.
Focus on quality setups, not quantity.
⚠️ Golden Rule:
Your job is not to win every trade — your job is to protect capital and stay consistent.
📌 SUMMARY
Bullish above → 26,210
Targets → 26,260 → 26,307 → 26,351 → 26,451
Bearish below → 26,163
Targets → 26,120 → 26,080 → 26,051 → 25,934
Avoid Zones:
— 26,163–26,195 (Indecision zone)
— 26,307–26,351 (High resistance; risky for longs)
🧾 CONCLUSION
Nifty is at a crucial turning point between support at 26,163 and resistance at 26,307.
The directional trend for the day will come from:
✔️ Breakout & retest above 26,210
✔️ Reversal from 26,051
✔️ Momentum short below 26,163
Avoid trades inside choppy mid-zones and wait for the market to reveal direction.
⚠️ DISCLAIMER
I am not a SEBI-registered analyst.
This analysis is for educational purposes only.
Please consult a certified financial advisor before trading or investing.
NIFTY KEY LEVELS FOR 26.11.2025NIFTY KEY LEVELS FOR 26.11.2025
Timeframe: 3 Minutes
If the candle stays above the pivot point, it is considered a bullish bias; if it remains below, it indicates a bearish bias. Price may reverse near Resistance 1 or Support 1. If it moves further, the next potential reversal zone is near Resistance 2 or Support 2. If these levels are also broken, we can expect the trend.
When a support or resistance level is broken, it often reverses its role; a broken resistance becomes the new support, and a broken support becomes the new resistance.
If the range(R2-S2) is narrow, the market may become volatile or trend strongly. If the range is wide, the market is more likely to remain sideways
please like and share my idea if you find it helpful
📢 Disclaimer
I am not a SEBI-registered financial adviser.
The information, views, and ideas shared here are purely for educational and informational purposes only. They are not intended as investment advice or a recommendation to buy, sell, or hold any financial instruments.
Please consult with your SEBI-registered financial advisor before making any trading or investment decisions.
Trading and investing in the stock market involves risk, and you should do your own research and analysis. You are solely responsible for any decisions made based on this research.

Nifty - Buy the Dip + Sell-On-Rise Just like we planned for Tuesday, NSE:NIFTY went up to test 26025 and then dropped sharply.
We shorted exactly from that level as soon as it rolled down — clean and precise execution.
But here’s the thing: sellers still haven’t exhausted. They will soon, though.
For tomorrow, the Pivot is 25924 and the index is already trading below it — meaning the short buildup is still active.
The Macro Index also fell again, confirming weakness across the board.
So here’s my plan for tomorrow and the next 2–3 sessions:
As per technicals, Nifty may fall sharply below 25850, maybe even near 25790, and then bounce to 25900 — only to fall again.
So yes, Sell-on-Rise will continue…
But tomorrow will be a Buy-the-Dip day for me.
My approach is simple:
If Nifty touches near or below 25800, I will go long and book at 25900.
Then, if I see a rejection from 25900–25950 again, I’ll short it once more.
However, also remember - this whole plan will be invalid if Nifty closes above 26000 on daily chart or even hourly!
While most people will panic watching Nifty and BankNifty dropping, the broader market — especially Smallcaps — will quietly accumulate.
This is how smart money builds bases.
Only those who understand base formation will catch the next rally.
Everyone else will get shaken out.
So be careful.
Pick the right sector first, then pick the right stock.
📊 Levels at a Glance:
Pivot: 25924
Buy Zone: 25850–25790
Upside Booking Zone: 25900
Re-short Zone: 25900–25950
Macro View: Weak
Bias: Buy the Dip → then Sell the Rise
Broader Market: Accumulation phase in Smallcaps
That will be all for the day.
Take care. Have a profitable tomorrow.

Nifty closed below 26,000, BUT FIIs+DII are Buying📊 Key Levels for Wednesday (Snapshot):
⚠️ The Trap Zone (Neutral): 25,781 - 26,066 (Buy Support / Sell Resistance)
🔻 Bearish Breakdown: Only Below 25,781 (S1)
🚀 Bullish Reversal: Above 26,066 (R1)
⚔️ Pivot Point: 25,962
Institutional Data:
FII Net Buy: +₹917 Cr 🟢
DII Net Buy: +₹3,423 Cr 🟢
PCR: 0.73 (Bearish/Oversold) 🔴
👇 Join the Discussion: FIIs have started buying again. Do you think the Correction is OVER? Comment "TRAP" if you think Bears are about to get squeezed!

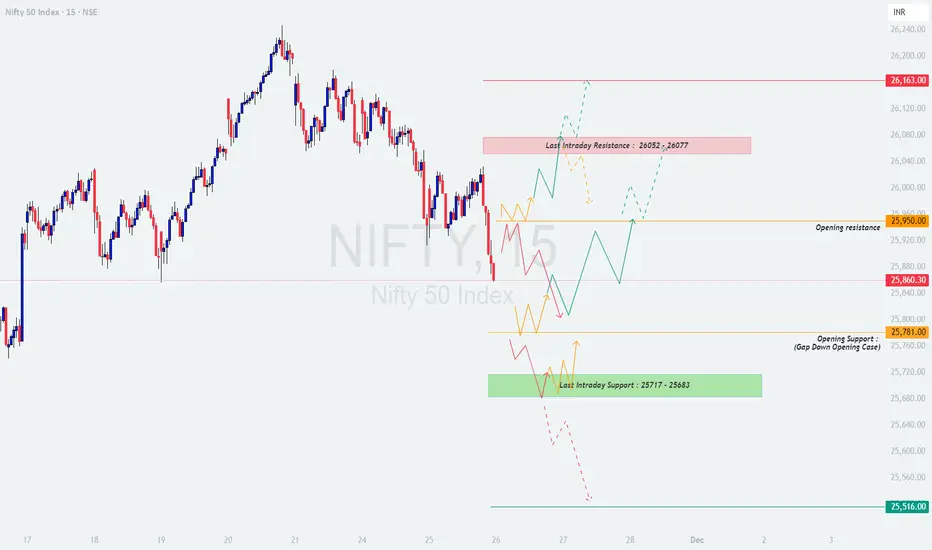
NIFTY : Trading levels and Plan for 26-Nov-2025📊 NIFTY TRADING PLAN — 26 NOV 2025
Current price sits around 25,860, right below the Opening Resistance (25,950) and just above the Opening Support (Gap-down case): 25,781.
The broader structure is weak, but Nifty is approaching a strong support zone around 25,717–25,683, which may trigger sharp intraday reversals.
Key Zones to Track:
🟥 Last Intraday Resistance: 26,052 – 26,077
🟥 Major Resistance: 26,163
🟧 Opening Resistance: 25,950
🟩 Opening Support (Gap-down case): 25,781
🟩 Last Intraday Support: 25,717 – 25,683
🟩 Major Support: 25,516
🟢 SCENARIO 1 — GAP-UP OPENING (100+ Points)
If Nifty opens around 25,960–26,050, price immediately enters the sellers’ zone near the Opening Resistance or slightly below the Last Intraday Resistance.
If price sustains above 26,052 for 10–15 minutes →
⭐ Upside targets: 26,077 → 26,120 → 26,163
If price rejects 26,052–26,077 zone →
Expect intraday pullback to 25,950 → 25,900 → 25,860
A bullish retest above 25,950 can give a continuation long opportunity.
Avoid aggressive longs at open — gap-ups into resistance often produce whipsaws.
📘 Educational Insight:
Gap-ups near resistance are continuation traps. Always wait for confirmation (higher low or strong candle close) before entering.
🟧 SCENARIO 2 — FLAT OPENING (Near 25,840–25,900)
A flat open places Nifty right inside the neutral compression zone, making direction unclear during the first 15 minutes.
Breakout above 25,950 →
Targets → 26,020 → 26,052 → 26,077
Breakdown below 25,840 →
Targets → 25,781 → 25,750
Avoid trading INSIDE 25,840–25,900 until price gives clear breakout/retest structure.
Best Opportunities:
— Breakout above 25,950 (retest entry)
— Breakdown below 25,840 (momentum entry)
💡 Educational Tip:
Flat opens help identify the day’s trend. The first clear breakout of the range usually decides the move for the next 1–2 hours.
🔻 SCENARIO 3 — GAP-DOWN OPENING (100+ Points)
A gap-down below 25,780 takes price directly into the Opening Support Zone and close to the Last Intraday Support (25,717–25,683).
If price holds 25,717–25,683 with strong wick rejections →
Upside targets: 25,781 → 25,840 → 25,900
If price fails to hold 25,683, next major support is:
➡️ 25,516
A bounce from 25,516 can provide a high-quality reversal long, but only after bullish confirmation.
If momentum remains bearish below 25,683, expect trend-day downside continuation.
📘 Educational Insight:
Gap-downs into major support often create the strongest reversal trades — but only after confirmation through volume + structure. Never jump early.
💼 RISK MANAGEMENT TIPS FOR OPTION TRADERS 💡
Avoid trading the first 5–10 minutes, especially on big gap opens.
Use ITM strikes for directional trades to reduce theta decay.
Always keep a fixed stop loss — do NOT widen SL after entry.
Avoid averaging losers (it damages your risk-reward and psychology).
Low VIX → good for option buying.
High VIX → prefer spreads or hedged selling.
Book partial profits at key swing levels; protect your capital.
⚠️ Golden Rule:
Your goal is not to catch every move — your goal is to stay in the game.
📌 SUMMARY
Bullish above → 25,950
Targets → 26,020 → 26,052 → 26,077 → 26,163
Bearish below → 25,840
Targets → 25,781 → 25,717 → 25,683 → 25,516
High-Risk Zones (Avoid Trading):
— 25,840–25,900 (choppy zone)
— 26,052–26,077 (strong supply; rejection possible)
🧾 CONCLUSION
Nifty is approaching a crucial support-resistance flip region. The reaction at 25,950 and 25,717 will decide the day’s trend.
The cleanest trades will come from:
✔️ Breakout & retest above 25,950
✔️ Reversal from 25,717–25,683 support
✔️ Momentum short below 25,840
Avoid trading the first volatile swings — let the direction develop clearly.
⚠️ DISCLAIMER
I am not a SEBI-registered analyst.
This analysis is strictly for educational purposes.
Please consult a certified financial advisor before taking any trading or investment decisions.
NIFTY 50 Nifty could test below white line or 24920 most probably within 27th Nov
if it moves sideways to bearish then it could reach within 8th Dec
Disclaimer:
It's a personal view not a financial advice and I assume no responsibility and liability whatever outcome arises.

NIFTY KEY LEVELS FOR 25.11.2025NIFTY KEY LEVELS FOR 25.11.2025
Timeframe: 3 Minutes
If the candle stays above the pivot point, it is considered a bullish bias; if it remains below, it indicates a bearish bias. Price may reverse near Resistance 1 or Support 1. If it moves further, the next potential reversal zone is near Resistance 2 or Support 2. If these levels are also broken, we can expect the trend.
When a support or resistance level is broken, it often reverses its role; a broken resistance becomes the new support, and a broken support becomes the new resistance.
If the range(R2-S2) is narrow, the market may become volatile or trend strongly. If the range is wide, the market is more likely to remain sideways
please like and share my idea if you find it helpful
📢 Disclaimer
I am not a SEBI-registered financial adviser.
The information, views, and ideas shared here are purely for educational and informational purposes only. They are not intended as investment advice or a recommendation to buy, sell, or hold any financial instruments.
Please consult with your SEBI-registered financial advisor before making any trading or investment decisions.
Trading and investing in the stock market involves risk, and you should do your own research and analysis. You are solely responsible for any decisions made based on this research.

Nifty Prediction for 25 Nov | FII vs DII Data & Expiry 📊 Key Levels for Tuesday (Snapshot):
🔻 Bearish Crash: Below 25,867 (S1) | Target: 25,774
🚀 Bullish Reversal: Above 26,098 (R1) | Target: 26,236
⚠️ The "Chop Zone": 25,867 - 26,098 (Avoid Trading)
Institutional Data:
FII Net Sell: -₹4,071 Cr
DII Net Buy: +₹4,373 Cr
PCR: 0.65 (Oversold/Bearish)
👇 Join the Debate: FIIs sold ₹4k Cr, DIIs bought ₹4k Cr. Who wins tomorrow? Comment "BEARS" or "BULLS" below!
#NIFTY Intraday Support and Resistance Levels - 25/11/2025Nifty is expected to open flat today, indicating a neutral start with no clear directional bias in the early session. If the index sustains above the 26050–26100 zone, it will activate the long setup with upside targets of 26150, 26200, and 26250+. A decisive move above this range may help Nifty recover back toward the higher resistance levels.
On the downside, weakness will confirm only if Nifty breaks below 25950, which will trigger the short setup with targets at 25850, 25800, and 25750-. Since the market is opening flat, initial movement may stay within the consolidation zone, and a breakout from these key levels will determine the trend for the day.

Nifty — Sell-on-Rise Still the My Strategy Market moved exactly the way I planned.
Good for my setups.
Don’t buy the dip right now. A better opportunity will come on Thursday.
NSE:NIFTY Pivot has now slipped to 26004 and the index is still closing below it — which clearly tells us the bulls are still weak.
The Macro Index also fell sharply today, confirming more weakness ahead.
Based on these data points, the plan for tomorrow stays simple: Sell-on-Rise.
Here’s how I’ll execute it:
If Nifty rises to 26025 and I spot a Pivot Low from there, I’ll short immediately.
My downside target will be 25850.
Plan B:
If we gap down and then rise, I’ll wait for another Pivot formation and short from new intraday levels.
If we gap down and fall again, I won’t touch the market. I’ll wait for Nifty to coil around a support and only then go long — with the same target as the resistance mentioned.
This entire plan becomes invalid if Nifty closes above 26132 in any way.
Stocks won’t perform anyway in this environment, so no point discussing them.
I’m only trading Nifty these days — and completely satisfied with the earnings.
📊 Levels at a Glance:
Pivot: 26004
Resistance for Shorting: 26025
Downside Target: 25850
Invalidation Level: 26132
Bias: Sell-on-Rise
Market View: Weak Macro + Weak Bulls
That will be all for the day.
Take care. Have a profitable tomorrow.

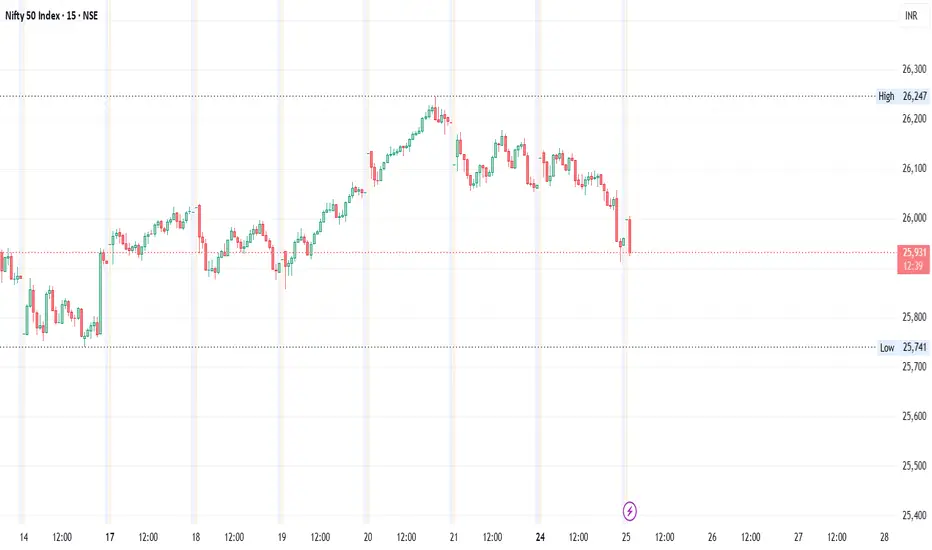
NIFTY : Trading levels and Plan for 25-Nov-2025📊 NIFTY TRADING PLAN — 25 NOV 2025
(Reference: 15-min structure & intraday reaction zones)
Nifty closed near 25,943, slipping into the Opening Support Zone (25,931–25,950) after a sharp late-day decline. The structure has shifted into a short-term bearish bias, but the first 15–20 minutes of the session will decide whether a reversal or continuation unfolds.
🔑 Key Levels to Track
🟥 Opening Resistance (Gap-up Case): 26,050 – 26,079
🟥 Last Intraday Resistance: 26,175
🟥 Major Upside Level: 26,307
🟧 Opening Support: 25,931 – 25,950
🟩 Last Intraday Support: 25,750 – 25,807
🟩 Major Downside Support: 25,516
🟢 SCENARIO 1 — GAP-UP OPENING (100+ Points)
If Nifty opens around 26,050+, price immediately enters the Opening Resistance Zone (26,050 – 26,079), a zone known for trapping early buyers.
If price sustains above 26,079 for 15–20 minutes →
📈 Targets: 26,120 → 26,175 → 26,225 → 26,307
If price rejects 26,079, expect pullback toward:
➡️ 26,020 → 25,970 → 25,950
The safest long trade is a retest–reclaim of 26,050 after rejection wicks.
Avoid aggressive buying directly at the open — resistance gaps often fade.
📘 Educational Note:
Gap-ups into resistance require confirmation via higher lows. A flat or weak breakout candle usually signals exhaustion, not strength.
🟧 SCENARIO 2 — FLAT OPENING (Around 25,930–25,960)
A flat open keeps Nifty inside the Opening Support Zone (25,931–25,950) — a decision-making region.
Breakout above 25,970 →
Targets: 26,020 → 26,050 → 26,079
Failure to hold 25,931 →
Decline toward 25,807 → 25,750
Avoid trading inside the 25,930–25,970 region until direction is clear.
Best trades:
✔️ Breakout–retest above 25,970
✔️ Support bounce at 25,807–25,750
💡 Educational Tip:
Flat openings reveal trend direction quickly — wait for the first candle to close before acting.
🔻 SCENARIO 3 — GAP-DOWN OPENING (100+ Points)
A gap-down below 25,880 pushes price rapidly toward the Last Intraday Support Zone (25,750 – 25,807).
If 25,807–25,750 holds with bullish wicks →
📈 Reversal targets: 25,900 → 25,950 → 26,020
If 25,750 breaks →
Next downside targets: 25,640 → 25,580 → 25,516
A sharp bounce from 25,516 provides a low-risk reversal trade setup.
Avoid picking bottoms blindly — wait for structure (HH/HL) to form.
📘 Educational Note:
Gap-downs into strong support often offer the best risk-to-reward if reversal signs appear — but only after confirmation.
💼 RISK MANAGEMENT TIPS FOR OPTIONS TRADERS 💡
Avoid trading during first 5–10 minutes after open.
Prefer ATM or ITM options for directional momentum.
Never widen your stop-loss under emotional pressure.
Avoid averaging losers — compound losses destroy accounts.
When VIX is low → option buying works better.
When VIX is high → use spreads or hedged selling.
Book partial profits to secure gains during volatility.
⚠️ Golden Rule:
Focus on capital preservation first — opportunities come daily, capital does not.
📌 SUMMARY
🔼 Bullish Above → 26,020 / 26,079
Targets: 26,120 → 26,175 → 26,225 → 26,307
🔽 Bearish Below → 25,931 / 25,807
Targets: 25,750 → 25,640 → 25,580 → 25,516
🚫 No-Trade Zone
25,930 – 25,970 (Flat opening zone — high noise, low clarity)
🧾 CONCLUSION
Nifty is approaching a high-volatility reversal area with both upside and downside swings possible. The reaction to the 25,931 support and 26,050 resistance will decide the trend for the day.
The most reliable trades will come from:
✔️ Breakout–retest above 26,020/26,079
✔️ Reversal confirmation at 25,807–25,750
✔️ Continuation trades after breakdown below 25,750
Patience and discipline are essential — avoid chasing.
⚠️ DISCLAIMER
I am not a SEBI-registered analyst.
This analysis is for educational purposes only.
Please consult a certified financial advisor before trading or investing.

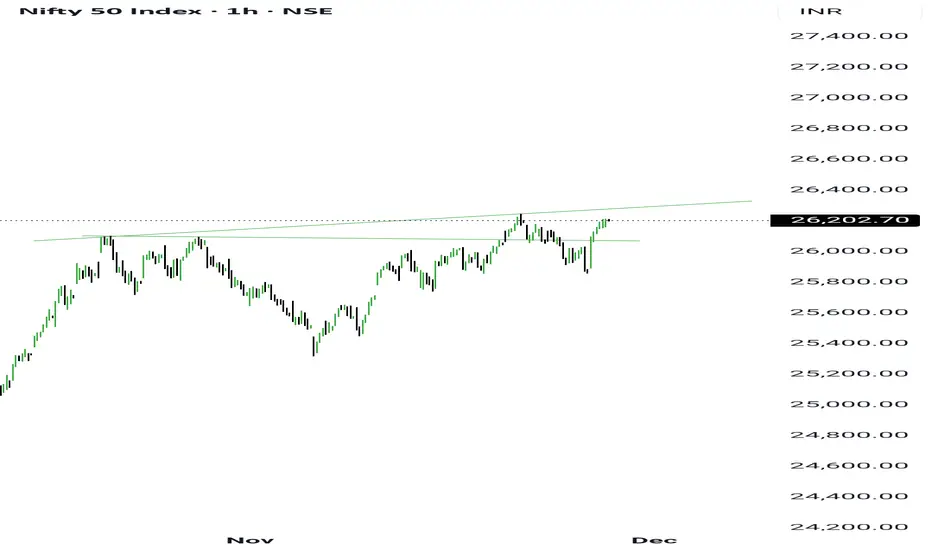
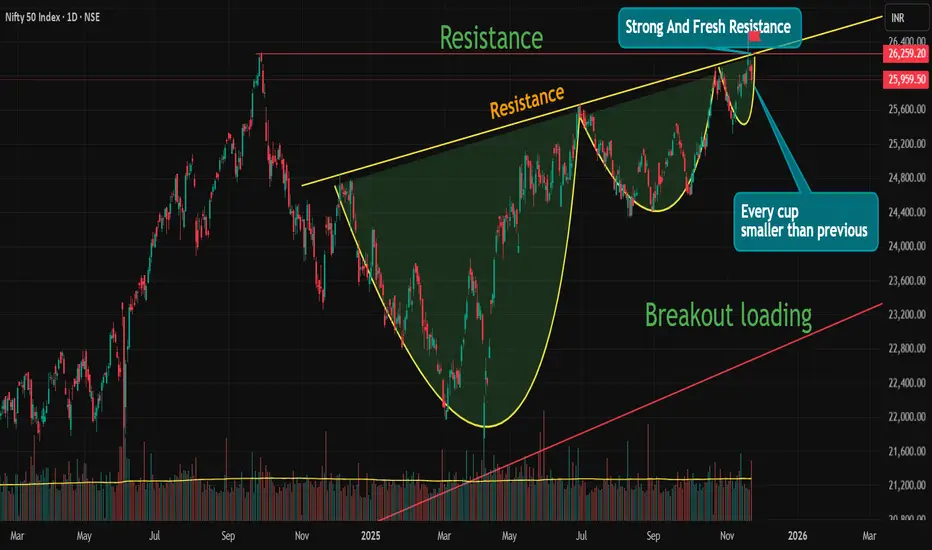
Something is cooking big than patternNSE:NIFTY
Nifty make continuously cup pattern smaller than previous cup . this is good sign for uptrend. but here also some negative points like all time resistance, negative pattern at all time resistance also another trend line resistance. global uncertainty here is big role. these are negative point.
you think i make confusion right but only half.
every analysis has two side
1. if analysis will right than we are ready for plan of action.
2. if analysis will wrong than we also ready for plan of action.
So, be prepared for both side.
Here is another 3 side if nifty make another cup 😅
hahahhaha
Trading with Volume1. What is Volume in Trading?
Volume is the total number of shares, contracts, or lots traded in a market during a particular period. Every time a buyer and seller make a transaction, it adds to the volume count.
For example:
If 10,00,000 shares of a stock are bought and sold during a day, that stock’s daily volume is 10 lakh.
If Bitcoin has 50,000 transactions in a 1-hour timeframe, that is its hourly volume.
Volume acts as the pulse of the market. When market participants are active, volume increases. When they lose interest, volume shrinks.
2. Why is Volume Important for Traders?
Volume helps traders answer critical questions:
a. Is the trend strong or weak?
A price trend supported by high volume is considered trustworthy. A trend on low volume is often weak and may collapse.
b. Is the breakout real or fake?
Strong volume during breakouts confirms genuine market interest. Low-volume breakouts often fail.
c. Is a reversal coming?
Volume spikes at tops or bottoms often indicate exhaustion and potential reversal.
d. Where are big players active?
Institutional traders like banks, funds, and smart money leave “footprints” through volume surges.
Thus, volume is a confirmation tool that helps traders avoid traps and make informed decisions.
3. Understanding Volume in Different Market Conditions
a. Volume in Uptrends
When volume rises along with price, the uptrend is considered healthy. Buyers are active and willing to buy at higher levels.
Signs of strong uptrend:
Price ↑ and Volume ↑ → Strong bullish trend
Pullback with low volume → Healthy correction
Signs of weakening uptrend:
Price ↑ but Volume ↓ → Weak trend, risk of reversal
b. Volume in Downtrends
In downtrends, high volume indicates strong selling pressure.
Strong downtrend signals:
Price ↓ and Volume ↑ → Strong bearish trend
Pullback with low volume → Continuation likely
Weak downtrend signals:
Price ↓ but Volume ↓ → Bear trend losing strength
c. Volume in Ranging Markets
In sideways markets, volume generally remains low. A sudden volume spike during range breakout signals trend formation.
4. How to Use Volume for Trading – Practical Techniques
Technique 1: Volume Breakout Trading
Breakouts are powerful signals but also come with fake moves. Volume confirms the authenticity.
Bullish breakout confirmation:
Price breaks resistance
Volume rises above average
Candle closes above breakout level
Bearish breakout confirmation:
Price breaks support
Volume spikes downward
Close is below the support level
Without volume confirmation, breakouts often fail and trap traders.
Technique 2: Volume Divergence
Divergence occurs when price and volume move opposite.
Examples:
Price making higher highs but volume making lower highs → Bullish trend weakening
Price making lower lows but volume decreasing → Bearish trend weakening
Such divergence often signals trend reversal.
Technique 3: Volume Spike Analysis
Sudden large volume spikes can mean:
A big player entering or exiting a position
Market turning point
Start of strong trend
At market bottoms, huge buying volume often appears. At tops, big selling volume may signal reversal.
Technique 4: Using Volume with Indicators
Some popular volume-based indicators:
a. Volume Moving Average (VMA)
Shows average volume to identify when current volume is unusually high or low.
b. On-Balance Volume (OBV)
Adds volume on up days, subtracts on down days to show accumulation/distribution.
c. Volume Weighted Average Price (VWAP)
Used by institutional traders; shows average price weighted by volume.
d. Money Flow Index (MFI)
Combines price and volume to detect overbought/oversold zones.
Using these indicators with price action increases trading accuracy.
5. Volume and Candlestick Patterns
Volume adds strength to candlestick signals.
Examples:
Bullish engulfing with high volume → Strong reversal
Hammer with high volume at support → Buyers entering
Doji with high volume → Indecision among big players
Volume validates candlestick reliability.
6. Volume and Support/Resistance Levels
Support and resistance zones are crucial. Volume helps confirm their strength.
At Support:
Price touches support with low volume → Support likely to hold
Price breaks support with high volume → Strong breakdown
At Resistance:
Price hits resistance with low volume → Resistance holding
Breaks resistance with high volume → Breakout confirmed
Volume acts as the deciding factor in whether levels hold or break.
7. How Smart Money Uses Volume
Institutional traders use volume to accumulate or distribute positions quietly.
Accumulation phase:
Price stays in range
Volume gradually increases
No big price movement
This indicates smart money buying.
Distribution phase:
Price stops rising
Volume spikes at peaks
Smart money selling to retail traders
Recognizing these phases helps traders identify big trends early.
8. Common Mistakes Traders Make with Volume
a. Believing every volume spike means breakout
Volume should be analyzed with price action, not in isolation.
b. Ignoring trend context
High volume in a range is meaningless unless combined with price breakout.
c. Misreading low-volume pullbacks
These are actually healthy for trends, not signs of weakness.
d. Trading without confirming volume
Entering trades based on price alone increases risk.
9. Best Practices for Volume Trading
Compare volume with average volume, not previous candles
Combine volume with trendlines, levels, and patterns
Avoid trading false breakouts without volume confirmation
Watch volume at key supports/resistances
Use volume indicators only as a supplement
Focus on multi-timeframe volume behavior
These practices significantly improve trading accuracy.
Conclusion
Trading with volume gives traders an edge by revealing the hidden strength behind price movements. Volume confirms trends, validates breakouts, identifies reversals, and exposes the actions of big players. When used correctly with price action, support/resistance, and technical indicators, volume becomes one of the most reliable tools in trading. For both beginners and advanced traders, mastering volume analysis is essential for smart, confident, and profitable trading decisions.
NIFTY KEY LEVELS FOR 24.11.2025NIFTY KEY LEVELS FOR 24.11.2025
Timeframe: 3 Minutes
If the candle stays above the pivot point, it is considered a bullish bias; if it remains below, it indicates a bearish bias. Price may reverse near Resistance 1 or Support 1. If it moves further, the next potential reversal zone is near Resistance 2 or Support 2. If these levels are also broken, we can expect the trend.
When a support or resistance level is broken, it often reverses its role; a broken resistance becomes the new support, and a broken support becomes the new resistance.
If the range(R2-S2) is narrow, the market may become volatile or trend strongly. If the range is wide, the market is more likely to remain sideways
please like and share my idea if you find it helpful
📢 Disclaimer
I am not a SEBI-registered financial adviser.
The information, views, and ideas shared here are purely for educational and informational purposes only. They are not intended as investment advice or a recommendation to buy, sell, or hold any financial instruments.
Please consult with your SEBI-registered financial advisor before making any trading or investment decisions.
Trading and investing in the stock market involves risk, and you should do your own research and analysis. You are solely responsible for any decisions made based on this research.

#NIFTY Intraday Support and Resistance Levels - 24/11/2025Nifty is expected to open with a gap-up today, indicating early strength after the recent decline and signalling that buyers may attempt a recovery from lower levels. If the index sustains above the 26050–26100 zone, the long setup becomes active with upside targets of 26150, 26200, and 26250+. A breakout above the major resistance at 26250 can further extend the bullish momentum toward 26350, 26400, and 26450+.
On the downside, any weakness or reversal will be confirmed only if the index rejects the 26250–26200 zone, activating the reversal short setup toward 26150, 26100, and 26050-. An additional short opportunity emerges only if Nifty breaks below 25950, which opens targets of 25850, 25800, and 25750-. With a gap-up opening, early price action around the key zones will determine whether the market continues upward or faces resistance-driven pullback.
