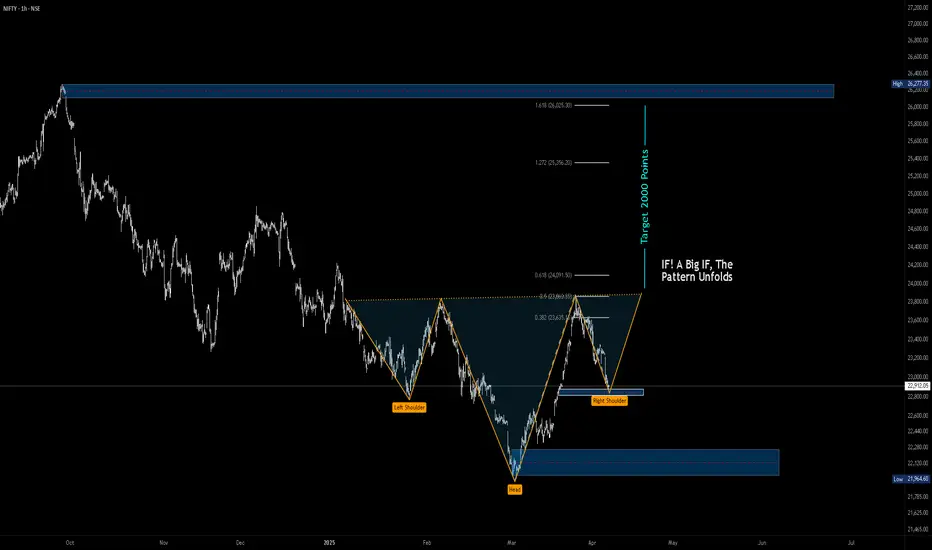
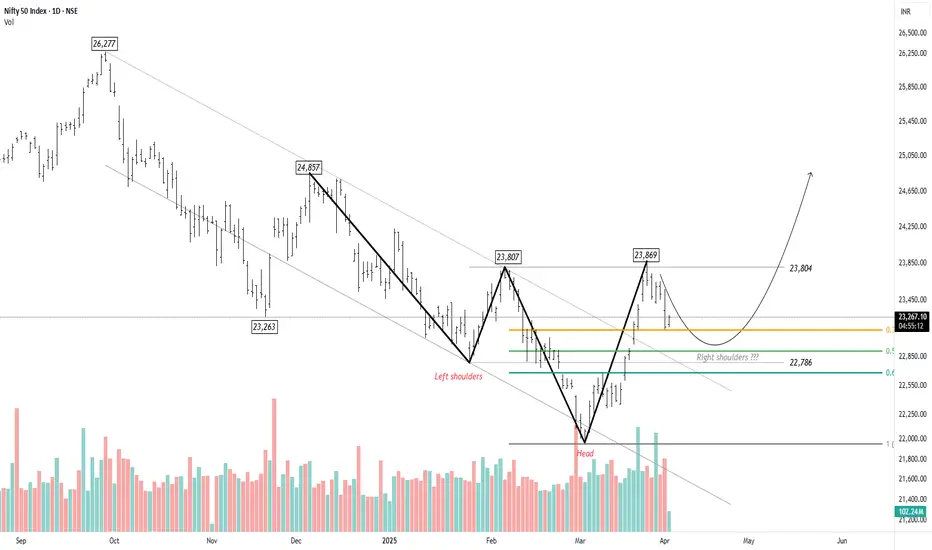
Nifty Prediction for coming days April 4th 2025A Big IF is because we are talking about probability here as the pattern is not yet shaped to its prime.
Lets Understand the Inverted Head and Shoulder Pattern
Left Shoulder : After a downtrend, the price of the respective asset makes a low and then rallies to a higher point, forming the left shoulder.
Head : Following the formation of the left shoulder, the price declines to a point lower than the left shoulder and then rallies again, forming the head.
Right Shoulder : Finally, the price declines again but not as low as the previous decline or the head, and then rallies one more time, forming the right shoulder. The right shoulder is typically roughly equal in depth to the left shoulder.
Neckline : A trendline is drawn connecting the high points (or "peaks") after the formation of each shoulder and the head. This line serves as a level of resistance that the price must break through to confirm the pattern.
Lets not get in to the Psychology part. you can find many around.
---------------------------------------------------------------
To Our analysis of nifty for the coming days we can see the same pattern on the chart above.
1st Trade : Advanced Users
If price takes support at around 22800 - 22750 and If you are good in reading volume find reversal to neck line and beyond if you can.
2nd Trade :
If You see price breaking the neck line with good volume (Volume greater than volume average and or greater than previous 3 or 4 candles in Daily Timeframe, Target Is shown on the Chart Nearly All time High.
-----------------------------------------------------------------
One can see that i have plotted FIb Ext on the chart, That clearly shows that the target of this Inverted H&S is absolutely at around 1.618 of FIb Ext.
One can even Consider this as Elliott Wave 3rd wave (I'm not a master in Elliott wave so correct me if i'm wrong)
Note.
A simple Yet powerful Patter so wait for the pattern to unfold for better results.
------------------------------------------------------------------
Monthly Nifty
In the above Picture You can see Monthly Nifty Chart. Which clearly shows that retracement is done and took support at Moving average. Formed a kicker pattern Which is my fav pattern for reversal. Now a retest of Last month candle Mid we can expect a reversal from there. That's where the market closed today. So rest you need work on your analysis. Good Day and Have a nice weekend
Niftyprediction
NIFTY50 - DON'T MISTAKE THIS RALLY FOR A TREND REVERSALSymbol - NIFTY50
CMP - 23350.40
The Nifty50 is still trading within a bearish technical structure. As of now, the index is currently trading at 23350 after a strong up move. Given the ongoing downtrend and resistance levels, there is a strong possibility that Nifty may experience a pullback from these levels.
I had shared a trading idea on Nifty50 when it was trading around the 21900-22100 levels, stating that a retracement on the long side was due and that it could easily touch the 22800-23000 levels. Nifty gave a strong up move from those levels, and both targets have been reached.
Upon closer inspection of the Nifty chart, it is evident that the index is still in a downtrend, making lower lows since the beginning of its fall. We witnessed a sharp rally from the 21800-22000 zone, which is common in a bear market. Such sharp rallies are often misinterpreted as trend reversals, but in reality, the faster these rallies come, the quicker they tend to get sold.
The bearish structure remains intact and has not been broken. For now, Nifty still appears to be a sell on rise. For those following the trend, the 23300-23600 zone is the ideal range to go short, as this area aligns with a strong resistance zone and the formation of another swing high.
At this point, it seems likely that the market may consolidate between the 23300-23600 zone before showing a sharp down move. If the market does reverse its trend, we can only consider that possibility after a breakout above the 24000 zone, which would be a key signal for a trend shift.

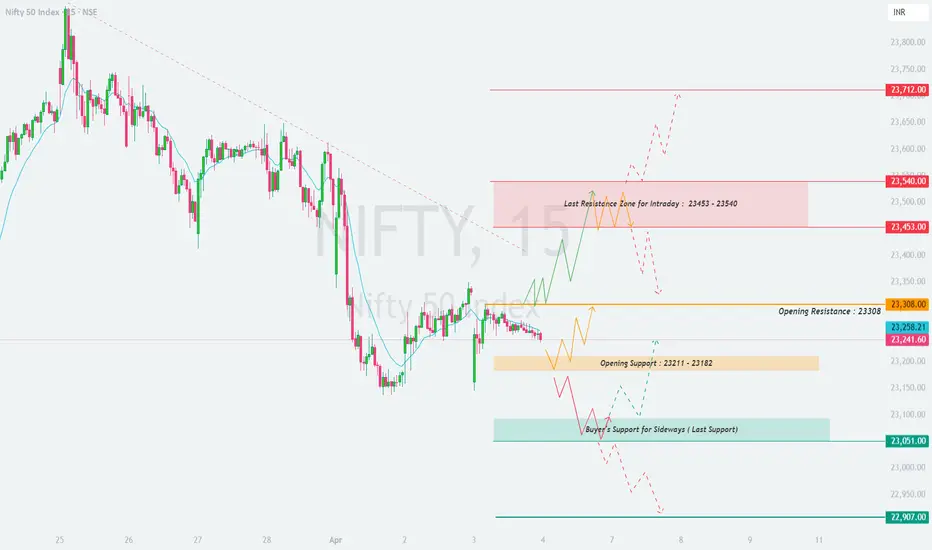
NIFTY : Intraday Trading Levels and Plan for 04-Apr-2025📌 NIFTY Trading Plan – 04-Apr-2025
📊 Market Overview:
Nifty closed at 23,241.60, showing signs of consolidation around a key support zone. The opening resistance at 23,308 and opening support at 23,211 – 23,182 will be crucial in determining the day's trend.
To navigate this session effectively, we will analyze all potential market opening scenarios and provide an actionable trading strategy.
🔼 Scenario 1: Gap-Up Opening (100+ points above 23,308)
A gap-up above 23,308 signals bullish momentum, but the intraday resistance zone of 23,453 – 23,540 will determine if the rally continues.
✅ Plan of Action:
If Nifty sustains above 23,308, expect a move towards 23,453 → 23,540. A breakout above 23,540 could trigger further buying towards 23,712.
If Nifty faces rejection at 23,453 – 23,540, expect a pullback towards 23,308, where it may either bounce or break down.
Avoid aggressive long positions near 23,540 unless a strong breakout with volume occurs.
🎯 Pro Tip: If the gap-up struggles to hold 23,308 in the first 15 minutes, profit booking may follow, leading to consolidation or a dip.
⚖ Scenario 2: Flat Opening (Within ±100 points, around 23,241)
A flat opening suggests indecision, where price action around the opening support (23,211 – 23,182) and resistance (23,308) will set the trend.
✅ Plan of Action:
Upside case: If Nifty sustains above 23,308, expect a test of 23,453 – 23,540.
Downside case: If Nifty slips below 23,211, it could test 23,182, followed by 23,051 (last buyer’s support zone).
No Trade Zone: Avoid trading inside 23,211 – 23,308 unless a strong breakout or breakdown occurs.
🎯 Pro Tip: Wait for a strong 15-minute candle close outside the range before initiating a trade to avoid false breakouts.
🔽 Scenario 3: Gap-Down Opening (100+ points below 23,182)
A gap-down below 23,182 indicates bearish sentiment, with key support at 23,051 being the last buyer’s zone.
✅ Plan of Action:
If Nifty sustains below 23,182, expect a decline towards 23,051. A breakdown below 23,051 could push the index towards 22,907.
If Nifty finds support at 23,051 and rebounds, look for a possible recovery towards 23,182 → 23,211.
Avoid panic shorting on a gap-down open; wait for confirmation before entering trades.
🎯 Pro Tip: A gap-down near a strong support zone could trigger a short-covering bounce. Wait for a reversal signal before taking long positions.
⚠️ Risk Management Tips for Options Traders
🛑 Avoid Over-leveraging – Stick to defined risk per trade and avoid emotional trading.
⌛ Theta Decay Awareness – If the market remains sideways, option premiums will erode rapidly.
🔄 Use Spreads for Risk Control – Consider hedged positions like Bull Call or Bear Put spreads instead of naked options.
📊 Trade at Key Levels – Avoid random trades; focus on high-probability setups.
📌 Summary & Conclusion
📍 Key Levels to Watch:
🟥 Resistance: 23,308 → 23,453 → 23,540 → 23,712
🟧 Opening Support/Resistance Zone: 23,211 – 23,182
🟩 Support: 23,051 → 22,907
🔸 Bullish Bias: Above 23,308, targeting 23,453 – 23,540
🔸 Bearish Bias: Below 23,182, expecting a drop towards 23,051 – 22,907
🔸 Neutral/Choppy: Inside 23,211 – 23,308, wait for a breakout
🎯 Final Advice:
Stick to the trading plan and execute trades only at key levels.
The first 15-30 minutes will define market sentiment—observe price action carefully.
Risk management is crucial—never risk more than you can afford to lose.
📢 Disclaimer
I am not a SEBI-registered analyst. This trading plan is for educational purposes only. Please conduct your own research or consult a financial advisor before making any trades.
🚀 Stay updated with real-time trade setups!
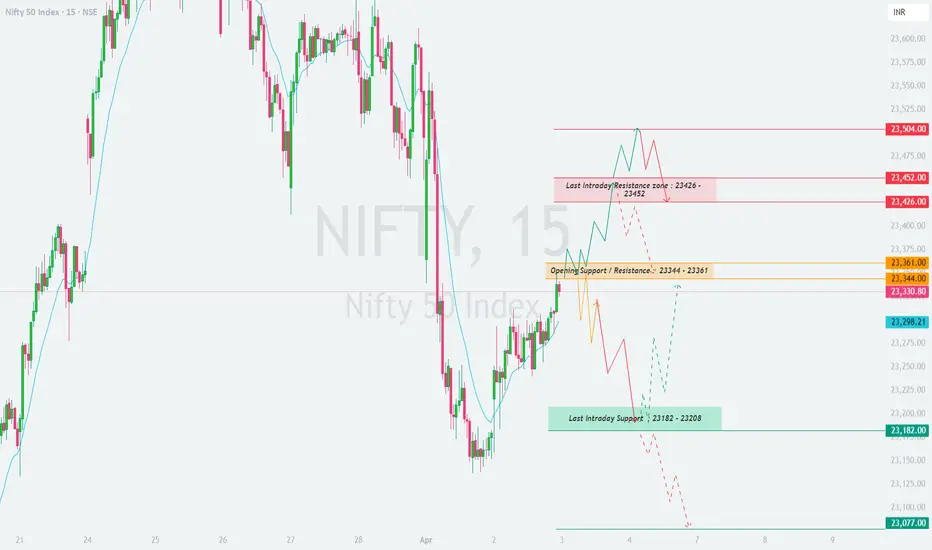
NIFTY : Trading levels and plan for 03-Apr-2025📌 NIFTY Trading Plan – 03-Apr-2025
📊 Market Overview:
NIFTY closed at 23,330.80, showing signs of recovery from the last intraday support level at 23,182. The opening support/resistance zone (23,344 – 23,361) will be the critical level to watch. The broader trend will be determined by price action near 23,426 – 23,452 resistance and 23,182 – 23,077 support zones.
To trade effectively, let's analyze all possible opening scenarios and structure a trading plan accordingly.
🔼 Scenario 1: Gap-Up Opening (100+ points above 23,426)
A gap-up above 23,426 signals bullish momentum, but the resistance zone at 23,452 – 23,504 will determine whether buyers can sustain higher levels.
✅ Plan of Action:
If NIFTY holds above 23,426, it may attempt to break 23,452 and head toward 23,504. A sustained move above 23,504 can push the index towards 23,575.
If price struggles near 23,452 – 23,504, expect profit booking and a potential retracement towards 23,361 → 23,344. A breakdown below 23,344 could trigger further selling towards 23,298.
Avoid aggressive longs at resistance (23,452 – 23,504) unless a strong breakout with volume occurs. Instead, look for either a retest entry or a breakout confirmation.
🎯 Pro Tip: If the gap-up fails to hold 23,426 within the first 15 minutes, it indicates weak buying strength, increasing the probability of a pullback.
⚖ Scenario 2: Flat Opening (Within ±100 points, around 23,330)
A flat opening suggests indecision, where price action near the opening support/resistance zone (23,344 – 23,361) will determine the direction.
✅ Plan of Action:
Upside case: If NIFTY sustains above 23,361, expect a move towards 23,426 → 23,452. A breakout above 23,452 could push it towards 23,504.
Downside case: If NIFTY falls below 23,344, expect a decline towards 23,298 → 23,182. A breakdown below 23,182 will confirm bearish momentum.
No Trade Zone (23,344 – 23,361): Avoid trading within this range unless a clear direction is established.
🎯 Pro Tip: Patience is key in a flat opening. Wait for a strong 15-minute candle closing outside the range before entering a trade.
🔽 Scenario 3: Gap-Down Opening (100+ points below 23,182)
A gap-down below 23,182 indicates bearish sentiment, with buyers likely to step in near the major support zone (23,077 – 23,000).
✅ Plan of Action:
If NIFTY sustains below 23,182, expect a drop towards 23,077 → 23,000. A breakdown below 23,000 could accelerate selling towards 22,907.
If NIFTY finds support at 23,077 and rebounds, look for a potential recovery towards 23,182 → 23,298. A strong breakout above 23,298 would signal a bullish reversal.
Be cautious of bear traps – If the market gaps down but quickly recovers, short-covering rallies can trigger a sharp upside move.
🎯 Pro Tip: If the gap-down happens near a strong support zone, wait for bullish confirmation (e.g., reversal candlestick patterns) before going long.
⚠️ Risk Management Tips for Options Traders
🛑 Avoid Over-leveraging – Maintain proper position sizing to control risk.
⌛ Theta Decay Awareness – Sideways movement will erode option premiums; avoid buying options in a choppy market.
🔄 Use Spreads for Risk Control – Instead of naked options, use spreads to hedge and improve probabilities.
📊 Trade at Key Levels – Avoid random trades; focus on well-defined support and resistance zones.
📌 Summary & Conclusion
📍 Key Levels to Watch:
🟥 Resistance: 23,426 → 23,452 → 23,504 → 23,575
🟧 Opening Support/Resistance Zone: 23,344 – 23,361
🟩 Support: 23,298 → 23,182 → 23,077 → 23,000
🔸 Bullish Bias: Above 23,426, targeting 23,452 – 23,575
🔸 Bearish Bias: Below 23,182, expecting a drop towards 23,077 – 23,000
🔸 Neutral/Choppy: Inside 23,344 – 23,361, avoid unnecessary trades
🎯 Final Advice:
Stick to the structured trading plan and execute only at key levels.
Avoid emotional trading—wait for confirmation before entering trades.
The first 15-30 minutes after market open will provide better clarity—observe price action before committing to a trade.
📢 Disclaimer
I am not a SEBI-registered analyst. This trading plan is for educational purposes only. Please conduct your own research or consult a financial advisor before making any trades.
🚀 Stay updated with live trade setups!
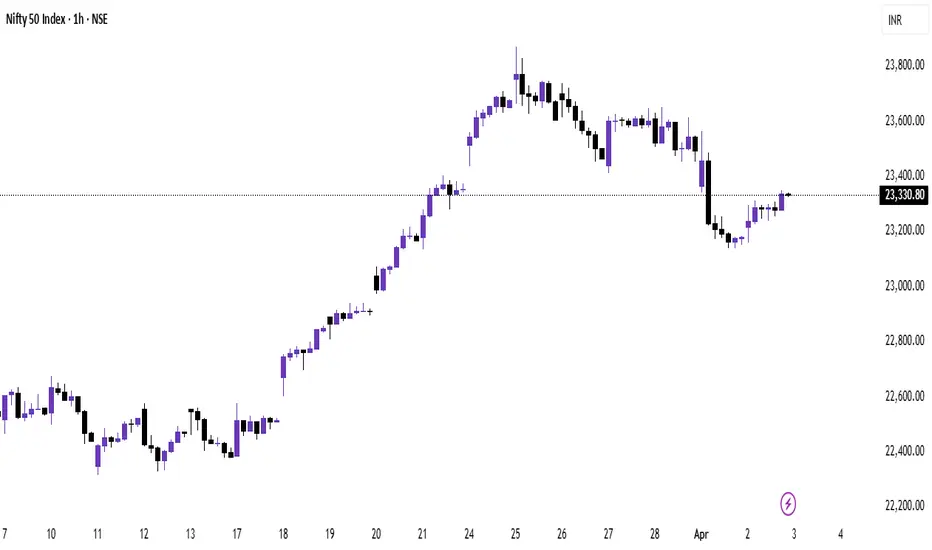
NIFTY 50 - ICT & SMC Analysis (April 3, 2025)1. Market Structure & Trend Overview
1D Chart (Higher Timeframe Bias)
Bearish Market Structure: The market has been in a downtrend, breaking market structure (MSS) at key levels. The recent rally from March was a retracement into a premium zone.
Key Resistance Areas:
Order Block (OB) at ~23,600: Market is rejecting this supply zone.
Previous Daily High (PDH) & Premium Liquidity Zone: Price recently swept liquidity above PDH and is rejecting.
Key Support Areas:
Fair Value Gap (FVG) at 22,800-22,900: This is the next area where price may drop to seek liquidity.
PDL (Previous Daily Low): A liquidity pool where price may react.
📌 Prediction:
If price stays below 23,600, the market may seek liquidity at 23,000 or even 22,800.
If price reclaims 23,600, a move towards 24,000 is possible.
4H Chart (Mid-Timeframe Confirmation)
Bearish Market Structure: Price is forming lower highs and recently had a Change of Character (ChoCH) to the downside.
Key Levels to Watch:
23,600 OB & FVG: Market is rejecting this area.
23,200-23,250 (Liquidity Area): Price is building liquidity below.
22,900 (FVG & Key Support): If price breaks down, this will be a magnet.
Strong Resistance at 23,600: If price gets here, it could be a sell opportunity.
📌 Prediction:
A potential short trade if price retraces back to 23,500-23,600 (OB) with targets at 23,200 & 22,900.
If 23,200 holds, a bounce to 23,500 is possible.
1H Chart (Execution Level)
Price Action Observations:
Liquidity Sweep at PDH: Market took out buy-side liquidity and is now retracing.
FVG Below 23,200: This is a draw on liquidity.
PWL (Previous Week’s Low) at 23,150-23,200: This could act as support before further downside.
📌 Trade Idea (Bearish Setup)
Entry: Sell near 23,500-23,600 (OB & FVG Zone).
Stop Loss: Above 23,650 (Above liquidity zone).
Take Profit Targets:
TP1: 23,200 (First liquidity pool).
TP2: 22,900 (FVG fill & support area).
🔹 Alternative Bullish Scenario: If price does not break 23,200 and forms bullish structure, a long towards 23,600 can be considered.
Option and Database tradingTo study an option chain, focus on the current market price, displayed in the centre. Analyse the built-up data to understand market direction based on recent changes in open interest and price. ITM call options are typically highlighted in yellow, making it easier to distinguish them from other options.
The put-call ratio measures trading volume using put options versus call options. Instead of the absolute value of the put-call ratio, the changes in its value indicate a change in overall market sentiment.

Nifty - Awaiting the Fifth Wave for a BreakoutNifty recently hit a low of 21,905 , marking a key reversal point in the trend. A well-defined Head and Shoulders pattern is emerging, with the right shoulder currently forming. The ongoing pullback has retraced to the 38.2% level, but there is potential for it to extend towards the 50% mark at 22,906 . However, the upward move appears to be losing momentum, with buying interest remaining subdued.
Based on the chart, the head of the pattern signifies the beginning of a new impulse wave. This appears to be the fourth wave within the larger first wave. Once Nifty completes this corrective phase, the fifth wave is expected to present a trading opportunity. If wave equality holds, Nifty could potentially rise to 24,857 .
NIFTY : Trading levels and Plan for 01-Apr-2025📌 NIFTY Trading Plan – 01-Apr-2025
📊 Market Overview:
NIFTY closed at 23,179, forming a consolidation base near the Opening Support Zone (23,164 – 23,210). The index has shown sharp volatility in previous sessions, and its next move will depend on how price reacts at key resistance and support levels.
For a disciplined and well-planned approach, let’s analyze all possible opening scenarios and formulate a structured trading plan accordingly.
🔼 Scenario 1: Gap-Up Opening (100+ points above 23,275)
A gap-up above 23,275 suggests bullish momentum, but whether it sustains or reverses will depend on the key resistance zone (23,351 – 23,385).
✅ Plan of Action:
If NIFTY sustains above 23,275, expect a bullish move towards 23,351 → 23,385. If it breaks and holds above 23,385, the rally could extend towards the major resistance at 23,502.
If price faces resistance at 23,351 – 23,385 and starts reversing, expect a pullback toward 23,275 → 23,210. A breakdown below 23,210 could signal further weakness.
Avoid entering long trades directly at 23,351 – 23,385, as this is a potential profit-booking zone. Look for either a clean breakout or a bearish rejection before making a move.
🎯 Pro Tip: If the gap-up starts fading in the first 15-30 minutes, it indicates weak buying pressure, increasing the probability of a sell-off.
⚖ Scenario 2: Flat Opening (Within ±100 points, around 23,179)
A flat opening near 23,179 suggests indecision, where price action will decide the next direction. The critical range to watch is 23,164 – 23,275.
✅ Plan of Action:
Upside case: If NIFTY breaks and sustains above 23,275, it may test 23,351 → 23,385. Monitor price action near these levels before entering fresh longs.
Downside case: If NIFTY breaks below 23,164, it could slide towards 23,067 → 22,907. A breakdown below 22,907 would confirm further downside pressure.
Avoid trading inside the No Trade Zone (23,164 – 23,275), as price might consolidate before a decisive move.
🎯 Pro Tip: In a flat opening, wait for a strong 15-minute candle close above/below key levels before taking any trade.
🔽 Scenario 3: Gap-Down Opening (100+ points below 23,067)
A gap-down below 23,067 could indicate selling pressure, but strong buyers might step in around the 22,907 support zone.
✅ Plan of Action:
If NIFTY sustains below 23,067, expect a decline towards 22,907. A breakdown below 22,907 could extend the fall to 22,800 – 22,750.
If NIFTY finds support at 22,907 and rebounds, expect a recovery towards 23,067 → 23,164. A strong close above 23,164 would signal buyer strength.
Be cautious of bear traps – If the market gaps down but quickly recovers, it could trigger short covering, leading to a sharp upside reversal.
🎯 Pro Tip: If the gap-down occurs near a major support zone, wait for bullish confirmation (e.g., reversal patterns) before going long.
⚠️ Risk Management Tips for Options Traders
🔹 Avoid over-leveraging – Proper position sizing is key to managing risk.
🔹 Theta Decay Awareness – If the market consolidates, option premiums will decay rapidly.
🔹 Use Spreads for Protection – Instead of naked options, use spreads to control risk and improve trade probabilities.
🔹 Trade at Key Levels – Avoid impulsive trades; focus on defined support and resistance zones.
📌 Summary & Conclusion
📍 Key Levels to Watch:
🟥 Resistance: 23,275 → 23,351 → 23,385 → 23,502
🟧 No Trade Zone: 23,164 – 23,275
🟩 Support: 23,067 → 22,907 → 22,800
🔸 Bullish Bias: Above 23,275, targeting 23,351 – 23,502
🔸 Bearish Bias: Below 23,067, expecting a fall towards 22,907 – 22,800
🔸 Neutral/Choppy: Inside 23,164 – 23,275, avoid unnecessary trades
🎯 Final Advice:
Stick to the structured trading plan and execute only at key levels.
Avoid emotional trading—wait for confirmation before entering trades.
The first 15-30 minutes after market open will provide better clarity—observe price action before committing to a trade.
📢 Disclaimer
I am not a SEBI-registered analyst. This trading plan is for educational purposes only. Please conduct your own research or consult a financial advisor before making any trades.

Nifty 50 Index Analysis & Trade Setup (April 1, 2025)1. Current Market Overview
Last Close: 23,495.15
Day’s Range: 23,450.20 (Low) – 23,545.30 (High)
Change: -48.50 (-0.21%) – Minor bearish close
Key Observations:
The index faced resistance near 23,545 and closed slightly lower.
The 15-minute chart shows consolidation between 23,450–23,545.
The 1-hour chart suggests a broader range between 23,200–23,800.
2. Technical Analysis Breakdown
a) Support & Resistance Levels
Immediate Support: 23,450 (Day’s Low)
Strong Support: 23,200–23,400 (Previous swing low & psychological level)
Immediate Resistance: 23,545–23,600 (Day’s High & round number)
Strong Resistance: 23,800 (Key swing high)
b) Price Action & Trend
Bearish Bias: The index closed below the opening price, indicating selling pressure.
Neutral Zone: If 23,450–23,545 holds, expect sideways movement.
Breakout Scenario:
Bullish Break: Above 23,600, target 23,800.
Bearish Break: Below 23,450, target 23,200–23,300.
c) Volume & Momentum
The decline was not extreme, suggesting cautious selling rather than panic.
A retest of 23,500–23,600 could confirm direction.
3. Trade Strategy (Intraday/Swing)
A) Short Trade (Bearish Bias)
Entry Zone: 23,500–23,550 (Retest of resistance)
Stop Loss: 23,600 (Above day’s high)
Target 1: 23,400 (Minor support)
Target 2: 23,200–23,300 (Strong support)
Risk-Reward: ~1:2 (Favorable)
B) Long Trade (Bullish Reversal)
Entry Zone: 23,450–23,400 (Support bounce)
Stop Loss: 23,350 (Below swing low)
Target 1: 23,600 (Resistance)
Target 2: 23,800 (Major resistance)
Risk-Reward: ~1:3 (High reward if breakout occurs)
4. Key Takeaways & Final Thoughts
Bearish until 23,600 breaks – The close below 23,500 suggests weakness.
Watch 23,450 closely – A breakdown could accelerate selling.
Bullish only above 23,600 – Confirmation needed for upside momentum.
Ideal Strategy: Wait for a clear break (either side) before committing.
Final Note: If the market opens near 23,500, watch for rejection (short) or bounce (long). Adjust stops based on volatility.

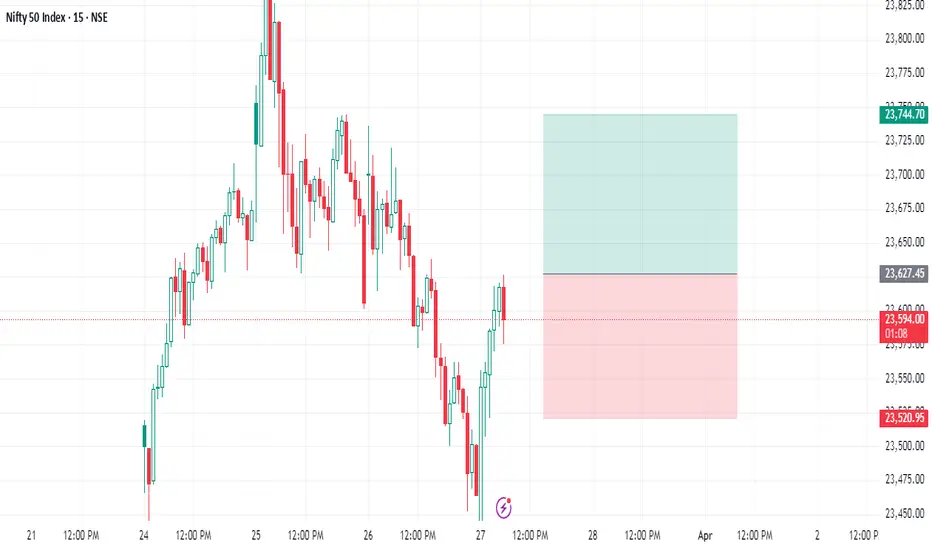
Nifty next Target 23750...112 points..SpikeNifty buy above 23627
Stoploss 23520....107 points
Target ........23740++ 112 points
Wait for active .. If active move oneside direct..check
This level only for education purpose only
Do ur own analysis
NIFTY IS READY FOR ANOTHER DOWNFALL? 23000!!dollar is weakened due to tarriffs on automobile, EURO region slammed 25% tariffs by Trump for imported vehicles.
In technical price of dollar(dxy) is rejecting from fvg.
So my opinion is dollars is going down today, for that reason I expect nifty to go down.
It's my opinion,if you have anything comment.

NIFTY Elliott Wave Analysis - Long Term targetAfter taking a strong run-up from COVID swing low, Nifty corrected 18% from Oct 2021 till June 22. The correction also followed Elliott Wave principles of the 5 main waves.
From June 2022, a larger Elliott Wave is in progress with Wave 3 lasting almost 1.5 years, from March 2023 till Sep 2024.
Wave 5 targets can take Nifty above 30k, before we see another major correction that can bring it down to 20k levels.
This timeline coincides with the famous Samuel Benner's Market Cycle theory, which states 2026 as a "year of good times, high prices and right time to sell stocks".
medium.com

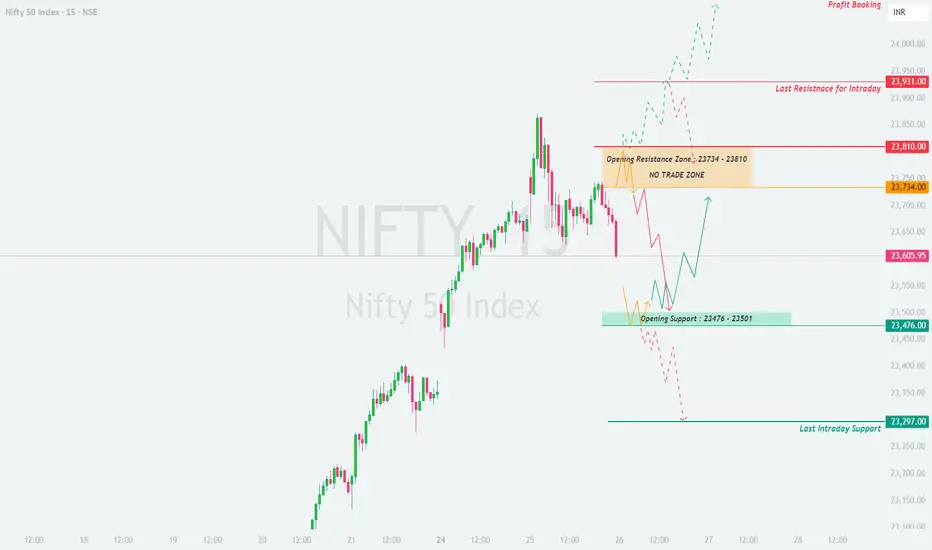
NIFTY : Intraday Trading levels and Plan for 26-Mar-2025
📊 Current Market Status:
NIFTY closed at 23,605.95, showing a decline from recent highs. The price action suggests that the index is at a crucial juncture, with key resistance and support levels defining tomorrow’s possible movement. Let’s analyze the plan for different opening scenarios.
🔼 Scenario 1: Gap-Up Opening (100+ points)
If NIFTY opens above 23,734, it will enter the Opening Resistance Zone (23,734 – 23,810), which is a crucial level for bulls. A sustained breakout above this zone will determine further upside movement.
✅ Plan of Action:
If NIFTY sustains above 23,810, expect a move towards 23,931 (last intraday resistance). A further breakout above 23,931 could take it towards 24,087 (Profit Booking Zone).
If the index rejects 23,810 and starts reversing, look for short opportunities targeting 23,734 → 23,605.
Avoid trading within the No Trade Zone (23,734 – 23,810) unless a clear breakout or breakdown occurs.
🎯 Pro Tip: A strong gap-up near 23,810 might trigger profit booking, so avoid aggressive longs unless momentum is confirmed.
⚖ Scenario 2: Flat Opening (Within ±100 points)
A flat opening around 23,605 means NIFTY is indecisive, requiring confirmation at key levels before entering trades.
✅ Plan of Action:
Upside case: If NIFTY breaks above 23,734, it could retest 23,810, and a breakout above that can push it towards 23,931 – 24,087.
Downside case: If the index breaks below 23,605, expect selling pressure towards the Opening Support Zone (23,476 – 23,501).
Neutral Approach: Avoid trading within the No Trade Zone (23,734 – 23,810) unless a strong breakout occurs.
🎯 Pro Tip: If volatility is low, options traders can use Iron Condors or Straddle Sells for range-bound strategies.
🔽 Scenario 3: Gap-Down Opening (100+ points)
If NIFTY opens below 23,476, bearish sentiment might take control, and we must assess the strength of support zones.
✅ Plan of Action:
If price sustains below 23,476, expect a decline towards 23,297 (Last Intraday Support).
If price takes support at 23,476 – 23,501 and rebounds, a potential pullback entry can be considered, targeting 23,605 – 23,734.
Watch for trap setups—if NIFTY opens low but quickly reverses above 23,476, it could be a bear trap leading to a short squeeze.
🎯 Pro Tip: In a gap-down scenario, avoid panic selling and wait for a breakdown retest before entering trades.
⚠️ Risk Management Tips for Options Traders
🔹 Avoid over-leveraging – Trade within your risk capacity and manage exposure wisely.
🔹 Theta Decay Awareness – Options traders should be mindful of premium decay, especially near expiry.
🔹 Hedge Your Positions – Use spreads instead of naked options to reduce risk.
🔹 Wait for Confirmation – Never enter trades based on emotions; always wait for price action confirmation.
📌 Summary & Conclusion
📍 Key Levels to Watch:
🟥 Resistance: 23,734 → 23,810 → 23,931 → 24,087
🟧 No Trade Zone: 23,734 – 23,810
🟦 Support: 23,476 – 23,501 → 23,297
🔸 Bullish Bias: Above 23,810 for targets of 23,931 – 24,087
🔸 Bearish Bias: Below 23,476 for a move towards 23,297
🔸 Neutral/Range-Bound: If price remains between 23,734 – 23,810
🎯 Final Advice:
Follow levels with discipline.
Avoid overtrading in No Trade Zones.
Let the first 15-30 minutes settle before making aggressive trades.
📢 Disclaimer
I am not a SEBI-registered analyst. This analysis is for educational purposes only. Please do your research or consult with a financial advisor before making trading decisions.
🚀 Stay updated on live trading levels & setups!
NIFTY : Intraday Trading Levels and Plan for 25-Mar-2025📅 NIFTY 50 Trading Plan – 25th March 2025
⏰ Timeframe: 15-min | 📊 Index Spot Reference: 23,674
🔍 Opening Scenario 1: GAP-UP Opening (100+ points)
If NIFTY opens significantly higher and trades above the 23,750 mark:
Keep a close eye on the Opening Resistance Zone between 23,863–23,931 . This area has historically acted as supply pressure, and price may show signs of rejection or pause here. If price action shows exhaustion in this zone (long upper wicks or bearish reversal candles), it can offer a high-probability short opportunity with tight risk. If a 15-min candle sustains and closes above 23,931 , Nifty may continue its bullish momentum towards the next level around 24,089 – marked as the “Last and Strong Resistance for Intraday.” Avoid aggressive buying near resistance. Instead, look for a pullback entry post-breakout with SL below the breakout candle’s low.
🧠 Tip: Don’t chase price. Let it stabilize before entry. In options, use OTM puts to short with defined SL and strict risk reward of at least 1:2.
🔍 Opening Scenario 2: FLAT Opening (±100 points)
If NIFTY opens near Friday’s close (23,651–23,674):
Wait for the first 15–30 mins to settle volatility. The price is currently in the middle of a decision zone. Watch for directional cues near 23,582–23,651 . Holding above this zone with strength can signal a move towards resistance zones mentioned above. If the index breaks below 23,582 , it may test the next demand zone between 23,507–23,491 . For bullish bias, price must sustain above 23,651 with volume and momentum. Look for bullish reversal candles like Hammer or Bullish Engulfing for confirmation.
🧠 Tip: For flat openings, straddles or strangles can be considered in options, but manage the premiums with strict SL, especially if the index remains range-bound.
🔍 Opening Scenario 3: GAP-DOWN Opening (100+ points)
If NIFTY opens around or below 23,500:
Watch 23,507–23,491 zone for any immediate bounce-back reaction. If buyers step in with volume, a quick pullback to 23,582+ is possible. If price slips below 23,491 , then 23,368 becomes the last support for the day. Breakdown below 23,368 could lead to a sharp fall toward lower psychological supports. Reversal trades should only be taken if there’s a bullish candle confirmation near support zones with increasing volume. If Nifty stabilizes and forms a base near 23,368, short-covering rallies can be sharp and tradeable.
🧠 Tip: Use spreads (bear call or bull put) in high volatility gaps. Avoid naked options with aggressive sizing post gap-down as premiums get inflated.
💡 Risk Management Tips for Options Traders:
Always trade with a fixed capital allocation per setup – ideally 2–5% of total capital. Don’t hold losing positions past your defined stop loss – honor SL with discipline. For intraday option trades, use 5-min/15-min candles to trail SL for locking in profits. Avoid holding zero-value options till expiry unless it's part of a hedge. Focus more on setups with favorable risk-reward, not just option premiums.
📌 Summary & Conclusion:
✅ Upside Zones to Watch: 23,863–23,931 (resistance), 24,089 (extension target)
✅ Support Zones: 23,582 → 23,507 → 23,491 → 23,368
✅ Strategy Focus: Wait for clear price action in respective zones; avoid emotional trades on gap days. Respect the market structure and plan trades only with confirmations.
⚠️ Disclaimer: I am not a SEBI-registered analyst. This plan is shared purely for educational and informational purposes. Please consult with your financial advisor before making any trading decisions.

Nifty 50 upcoming levelThe Nifty 50 has recently formed a bottom around 21,964.
Nifty is showing a one-directional move from that level, and momentum is increasing with each candle.
Previously, Nifty faced resistance around 23,780, and the current price is 23,658, just 120 points away from the previous resistance.
After a quick rally, Nifty 50 may encounter resistance near 23,780, and an Inverse Head & Shoulders formation is possible.
Note: Resistance does not guarantee a confirmed reversal, but we need to monitor price action at that level to determine whether it is breaking and sustaining the resistance.
Stay tuned for more updates!
Hit the Boost button for regular updates!

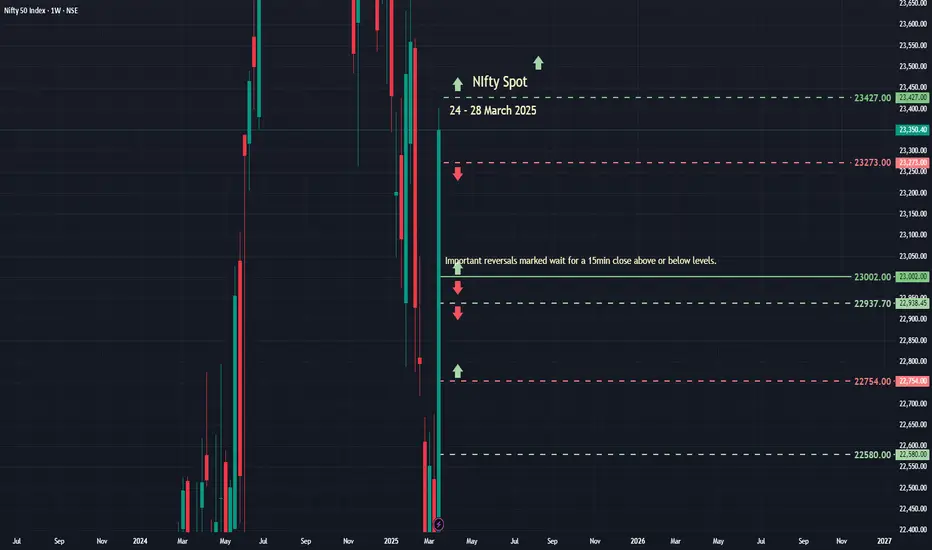
Nifty SpotNifty Spot
for 24 - 28 March 2025
last week NS opened @ 22353.15 as O=L
gave incredible 1000+ points
The important level is 23427 (30min close) for the market to give a fresh breakout.
Similarly if the market makes a 30m close below 23427 then probably 23400 PE can be a bes t bet for options players....
Again exiting position at a level mentioned below that...
Level to level trading is recommended...
Happy trading and Profit making with proper planning..
Like.. Share.. Comment...
NIFTY Prediction for Tomorrow – March 25, 2025What happened on last day:
As we discussed, the NIFTY has been in a sideways accumulation phase, and it has now broken to the upside.
If we look at the chart now:
The market is trading just below the 200 EMA (1D-tf) , which is acting as a strong resistance. Price has shown strong bullish momentum and has successfully broken out from the descending PINK trendline , which had held the price for over 10 months.
Structure-wise, NIFTY is forming higher highs and higher lows , suggesting a clear shift in momentum from bearish to bullish.
Price is trading above the 13, 50, and 100 EMAs , but still below the 200 EMA , which remains the immediate level to cross.
RSI = 64 , showing strong bullishness but not yet in the overbought zone — bulls still have strength.
Price is also trading above VWAP , confirming healthy bullish bias on the day.
All important breakout levels, retest zones, and trendlines are clearly marked on the chart.
Support levels: 22,775, 21,987, 21,840
Resistance levels: 23,600, 23,870, 24,790
If we look at the OI data:
PCR = 1.1 , showing a strong bullish structure in the options market.
There is strong Put writing at 23,000, 23,100, and 23,200 levels which are likely to act as near-term supports.
On the upside, significant Call writing is seen at 23,600, 23,700, and 23,800 levels — making them key resistance levels.
We are currently in the last week of the March monthly expiry (27 Mar) , so this OI structure gives strong directional cues.
If we look at the news & sentiment:
INDIA VIX = 12.6 , showing low volatility expectations.
No negative macro or global cues, INR and crude oil are stable.
Sentiment across financial media is cautiously bullish , with attention on whether NIFTY can sustain above the 23,600 zone.
I am expecting
The market to be sideways to bullish unless it breaks above 23,600 decisively, which could lead to further rally toward 23,870 and 24,790 .
Reasons:
✅ Breakout from 10-month falling channel
❗Price > EMA(13, 50, 100) but just below 200 EMA (Bullish but watch for breakout)
✅ Volume spike confirms institutional participation
✅ Clean higher-low structure forming
✅ Above 50 EMA and approaching 200 EMA
Verdict: Sideways or Bullish
Plan of action:
Sell 23,600 CE and 23,600 PE — hold the position within range.
Exit one leg if price breaks on either side with momentum and volume.

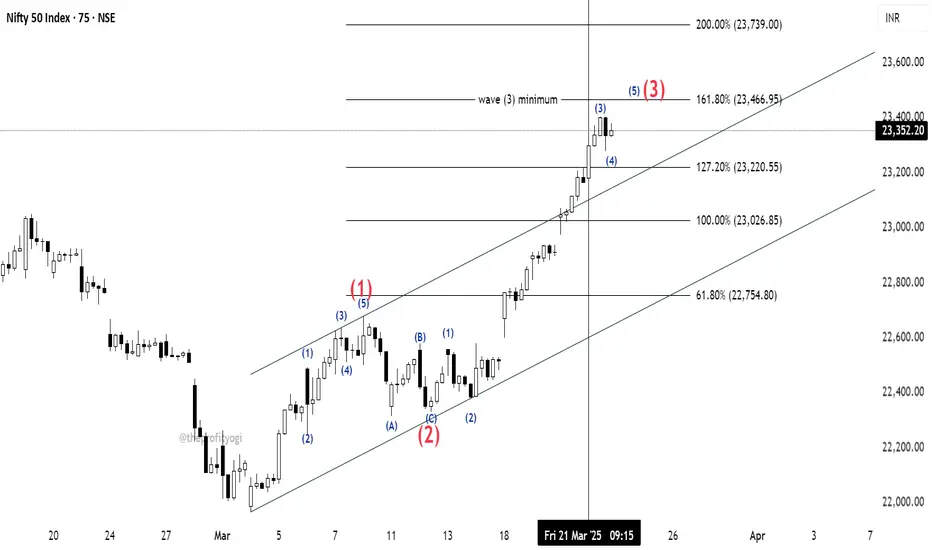
NIFTY detailed countingAs discussed in the last post, NIFTY's price has crossed over 23026.85 before 21st March so we can count the current move as wave (3). We can also see that price has broken the base channel, which is an important sign of wave (3) progression.
The detailed counting is given in the chart.
As we can see, the price is in subordinate wave 3 of the bigger wave (3).
The minimum target of Trending Impulse is 161.8% as per the rule.
We can expect the price to touch that level in the upcoming session.
I have marked, for now, a bigger wave (3) (in red) at 161.8% but as mentioned earlier, it is just the minimum target of it and the price may go beyond this level too.
This analysis is based on Elliott Wave theory and Fibonacci.
This is not any buying recommendation.
This analysis is for educational purposes only.
Advanced Candlesticks Part -2Candlestick patterns provide insight into price action at a glance. While the basic candlestick patterns may provide some insight into what the market is thinking, these simpler patterns often generate false signals because they are so common. Below, we will look at more advanced candlestick patterns that offer a higher degree of reliability.
The Tweezer Top candlestick pattern is a bearish reversal pattern that signals a potential shift from an uptrend to a downtrend, characterized by two consecutive candlesticks with nearly identical highs, suggesting buyers are losing control and sellers are gaining ground.

KOTAK BANK NEAR FLAG BReakoutKotakBank is nearly Flag Breakout on Monthly Candle (Wait more 7 days to Finish MOnthly Candle with Big Bull Breakout)
Wait for Proper Breakout beacuse its 4 time where Chart is going to test same Trendline.
Flag Pattern Start from 2020- After 5 years its will going to break
If we see fulll chart Stock taking support over 2013 Trendline before two months so there is more more possibility to give breakout
if we see RSI chart its also show Breakout over MOnthly RSI trendline..
## THis is my Just View, take position after all confromations and research by yourself##
also see weekly chart - weekly showing strong big bull canle ( 1more Weekly Candle Require for final conformations)

Dead Cat Bounce or Trend Reversal: What's Next for the Nifty?● After a significant decline from its all-time high, Nifty found strong support near the 22,000 level.
● Since then, the index has rebounded and recently breached its trendline resistance, signaling a potential shift in market sentiment. 🚀
📊 Open Interest (OI) Data Analysis:
● The OI data indicates a substantial increase in put open interest at the 23,000 strike price, establishing this level as a key immediate support.
● Conversely, the 23,500 strike price has emerged as a strong resistance zone, with the highest concentration of call OI.
❓ Key Question:
Has the Nifty truly bottomed out, or is there still room for further correction? 🤔
💬 Share your insights and perspectives in the comments below! 👇

NIFTY MATHEMATICAL LEVELSThese Levels are based on purely mathematical calculations.
Validity of levels are upto expiry of current week.
How to use these levels :-
* Mark these levels on your chart.
* Safe players Can use 15 min Time Frame
* Risky Traders Can use 5 min. Time Frame
* When Candle give Breakout / Breakdown to any level we have to enter with High/Low of that breaking candle.
* Targets will be another level marked on chart
* Stop Loss will be Low/High of that Breaking Candle.
* Trail your SL with every candle.
* Avoid Big Candles as SL will be high then.
* This is one of the Best Risk Reward Setup.
For Educational purpose only
NIFTY Intraday Trade Setup For 20 Mar 2025NIFTY Intraday Trade Setup For 20 Mar 2025
Bullish-Above 22950
Invalid-Below 22900
T- 23125
Bearish-Below 22800
Invalid-Above 22850
T- 22635
NIFTY has closed on a slight bullish note with 0.32% gain today. Yesterday we discussed that 22900 will act as a confluence zone as that was 50% retracement zone , which resulted into sideways market. Index is at striking distance from 50 EMA in daily TF. Intraday traders should lower position size as it is a confluence zone in which bulls and bears may start tug of war. Let breakout happen or resistance to be taken.
Coming to Thursday's trade setup, if index opens flat and a 15 Min candle closes above 22950 then we will long for the target of 23125.
For selling we need a 15 Min candle close below 22800. T- 22635.
In case of a big gap up/down, wait till 10 o'clock and mark the high and low of the trading range (5MIN). Trade on this range breakout.
==========
I am Not SEBI Registered
This is my personal analysis for my personal trading. Kindly consult your financial advisor before taking any actions based on this.
