NIFTY : Trading levels and Plan for 24-Nov-2025📊 NIFTY TRADING PLAN — 24 NOV 2025
(Reference: 15-min chart structure & mapped intraday levels)
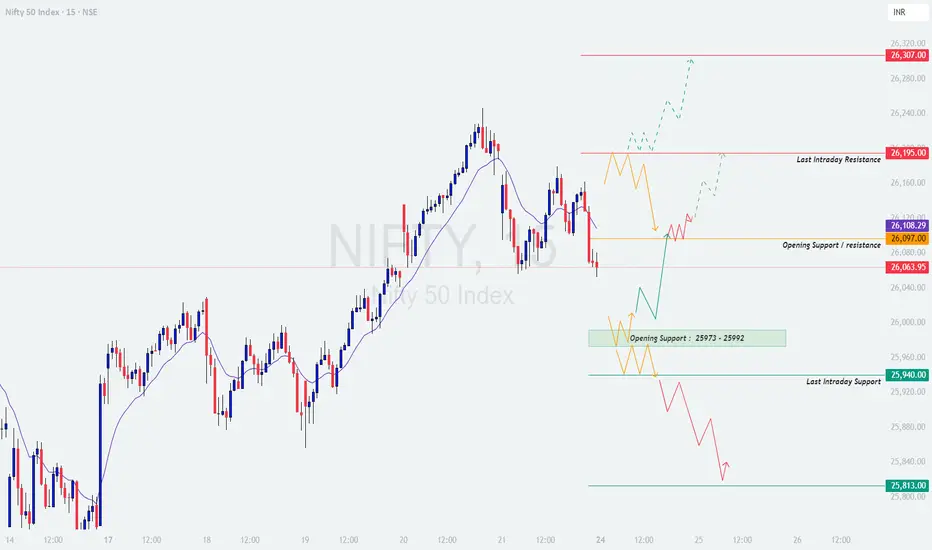
Nifty closed near 26,064, sitting just below the Opening Support / Resistance Zone (26,097–26,108).
The recent fall has brought price into a critical region where buyers and sellers will fight for control, making tomorrow’s open highly important.
🔑 Key Levels
🟥 Last Intraday Resistance: 26,195
🟥 Major Resistance: 26,307
🟧 Opening S/R Zone: 26,097 – 26,108
🟩 Opening Support Zone (Gap-Down Case): 25,973 – 25,992
🟩 Last Intraday Support: 25,940
🟩 Deep Support: 25,813
Below is the complete scenario-wise actionable plan 👇
🟢 SCENARIO 1 — GAP-UP OPENING (100+ points)
If Nifty opens around 26,160–26,210, price immediately tests the Last Intraday Resistance (26,195).
If price sustains above 26,195 for 10–20 mins with strong green candles →
🎯 Upside targets → 26,240 → 26,275 → 26,307
If price rejects 26,195 with long wicks →
Expect correction toward 26,120 → 26,097
A bullish retest at 26,097–26,108 can offer a low-risk long entry.
Avoid chasing the breakout candle—gap-ups near resistance often create bull traps.
📘 Educational Note:
Gap-up trades work best when price forms higher lows immediately after opening. A sideways or weak first 5–15 mins signals exhaustion.
🟧 SCENARIO 2 — FLAT OPENING (Near 26,050–26,100)
This puts price directly inside the Opening S/R Zone (26,097–26,108) — a decision-making region.
A clean breakout above 26,108 with a retest →
🎯 Targets → 26,150 → 26,195
On breakdown below 26,050, expect a drop toward:
➡️ 25,992 → 25,973
Avoid trading inside 26,050–26,108 zone initially; wait for direction clarity.
Best trend trades will come from:
— Breakout → Retest → Continuation
— Support bounce from 25,973–25,992
💡 Educational Tip:
Flat opens often give clean directional plays once the first 15-min candle closes. Patience pays.
🔻 SCENARIO 3 — GAP-DOWN OPENING (100+ points)
A gap-down into 25,973–25,992 brings price directly into strong support.
If 25,973–25,992 holds with bullish wick rejection →
🎯 Upside targets → 26,020 → 26,063 → 26,108
If price breaks below 25,973, next strong support is:
➡️ 25,940 (Last Intraday Support)
If 25,940 also fails → expect deeper fall toward 25,813
A sharp V-shaped reversal from 25,813 can become the best long trade of the day.
📘 Educational Note:
Gap-downs into major supports often produce intraday reversals—but only after confirming rejection with strong candles.
💼 RISK MANAGEMENT TIPS FOR OPTION TRADERS 💡
Avoid trading the first 5–10 minutes after open.
Prefer ATM/ITM options for directional moves.
Always predefine your SL—don’t widen it emotionally.
Never average losing trades.
When VIX is low → option buying works better.
When VIX is high → use spreads or hedged selling.
Book profits in parts to lock in gains during reversals.
⚠️ Golden Rule:
Protect capital first—opportunities come every day.
📌 SUMMARY
Bullish above → 26,108
🎯 Targets → 26,150 → 26,195 → 26,240 → 26,307
Bearish below → 25,992
🎯 Targets → 25,973 → 25,940 → 25,813
No-Trade Zones:
— 26,050–26,108 (choppy decision zone)
— 26,175–26,195 (high-risk supply zone)
🧾 CONCLUSION
Nifty sits near a sensitive reversal region.
Tomorrow’s trend depends entirely on how price reacts to:
✔️ 26,108 breakout
✔️ 25,973 support
The safest and highest-quality trades will come from retests, not impulsive entries.
Let the market reveal direction before you act.
⚠️ DISCLAIMER
I am not a SEBI-registered analyst.
This analysis is purely for educational purposes.
Please consult a certified financial advisor before trading or investing.
Niftyprediction
Why 26,000 is Critical for Monday (24 Nov)📊 Key Levels for Monday (Snapshot):
🔻 Bearish Breakdown: Below 26,020 (S1) | Target: 25,972
🚀 Bullish Recovery: Above 26,147 (R1) | Target: 26,226
⚠️ Neutral Zone: 26,020 - 26,147 (No Trade Zone)
Institutional Data:
FII Net Sell: -₹1,262 Cr
DII Net Buy: +₹1,757 Cr
👇 Join the Discussion: Do you think DIIs can save the 26,000 level on Monday? Comment "26k" if you trust the support!

Nifty Big update ready for buy tgt 30900if nifty close above 26300 for 2days then entry for fresh buying and tgt is 30900 for positional
please maintain stoploss 25300

NIFTY KEY LEVELS FOR 21.11.2025NIFTY KEY LEVELS FOR 21.11.2025
Timeframe: 3 Minutes
If the candle stays above the pivot point, it is considered a bullish bias; if it remains below, it indicates a bearish bias. Price may reverse near Resistance 1 or Support 1. If it moves further, the next potential reversal zone is near Resistance 2 or Support 2. If these levels are also broken, we can expect the trend.
When a support or resistance level is broken, it often reverses its role; a broken resistance becomes the new support, and a broken support becomes the new resistance.
If the range(R2-S2) is narrow, the market may become volatile or trend strongly. If the range is wide, the market is more likely to remain sideways
please like and share my idea if you find it helpful
📢 Disclaimer
I am not a SEBI-registered financial adviser.
The information, views, and ideas shared here are purely for educational and informational purposes only. They are not intended as investment advice or a recommendation to buy, sell, or hold any financial instruments.
Please consult with your SEBI-registered financial advisor before making any trading or investment decisions.
Trading and investing in the stock market involves risk, and you should do your own research and analysis. You are solely responsible for any decisions made based on this research.

Nifty 50 On UP Trend for 2026Nifty has formed a channel pattern for the past 1 year and in Nov 2025 it has broken the channel and has also done a retracement. Based on the height of the channel, we can expect Nifty to touch 29000, but maybe it can go beyond that and touch 30K by end of 2026 or early 2027.
Disclaimer: Kindly check with your financial advisor before taking any trade.

NIFTY : Trading levels and Plan for 20-Nov-2025📊 NIFTY TRADING PLAN — 20 NOV 2025
(Reference: 15-min chart structure & key intraday levels)
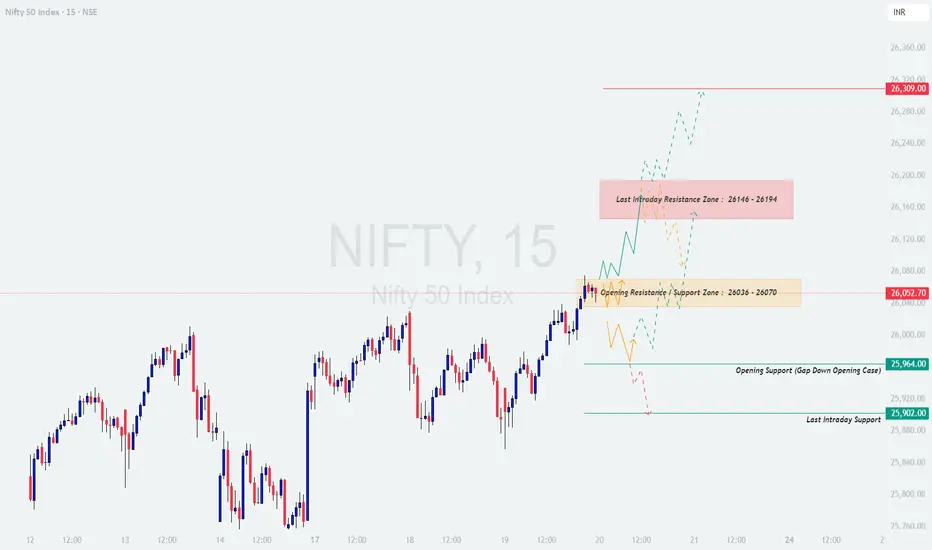
Nifty closed around 26,052, sitting just above the Opening Resistance / Support Zone (26,036 – 26,070). Price action is now heading toward a crucial supply area above 26,140–26,194, and short-term structure suggests volatility around the opening price.
Here are the major actionable levels for 20 Nov 2025:
🟧 Opening Resistance / Support Zone: 26,036 – 26,070
🟥 Last Intraday Resistance Zone: 26,146 – 26,194
🟥 Major Resistance: 26,309
🟩 Opening Support (Gap-down case): 25,964
🟩 Last Intraday Support: 25,902
Below is the complete plan for all opening scenarios 👇
🟢 SCENARIO 1 — GAP-UP OPENING (100+ Points)
If Nifty opens around 26,150–26,200, this places price directly inside or just under the Last Intraday Resistance Zone (26,146–26,194).
If price sustains above 26,194 for 10–20 minutes with strong volume →
⭐ Upside targets → 26,245 → 26,280 → 26,309
If price rejects 26,146–26,194, expect a correction toward:
➡️ 26,100 → 26,070
A bullish retest at 26,070 with reversal candles offers a safe long entry.
Avoid buying immediately at open — gap-ups near resistance often trap traders.
📘 Educational Note:
Gap-ups work best only when price makes higher lows after the open. A flat or weak first candle at resistance often signals exhaustion.
🟧 SCENARIO 2 — FLAT OPENING (Near 26,020–26,070)
A flat open places Nifty inside the Opening Resistance / Support Zone (26,036–26,070) — a decision region.
A clean breakout above 26,070 →
Targets → 26,110 → 26,146 → 26,194
If price breaks below 26,036, expect a drop to:
➡️ 25,964 (Opening Support)
Avoid trading inside the 26,030–26,070 zone until direction is clear.
Best trades will be:
— Breakout → Retest → Continuation
— Support bounce from 25,964
💡 Educational tip:
Flat openings are ideal for trend identification. The first 15-min candle usually gives strong directional clues — don’t rush in.
🔻 SCENARIO 3 — GAP-DOWN OPENING (100+ Points)
A gap-down below 25,970 puts price directly into the Opening Support zone (25,964).
If 25,964 holds with bullish wick rejection →
Upside targets → 26,020 → 26,070 → 26,110
If price breaks 25,964 decisively, next support zone:
➡️ 25,902 (Last Intraday Support)
A strong bounce from 25,902 can provide an excellent low-risk long entry.
If 25,902 breaks with momentum, downside expands to:
➡️ 25,860 → 25,820
📘 Educational Note:
Gap-downs into support often give the strongest reversal trades of the day — but only after confirmation.
💼 RISK MANAGEMENT TIPS FOR OPTION TRADERS 💡
Avoid trading the first 5–10 minutes after market opens.
Use ATM or ITM options for directional trades.
Define your stop loss BEFORE entering — never adjust it emotionally.
Avoid averaging in losing positions.
When VIX is low → option buying works better.
When VIX is high → prefer hedged option selling strategies.
Book partial profits — don’t wait for full target if momentum weakens.
⚠️ Golden Rule:
Your objective is to survive long enough to catch the big moves — protect your capital first.
📌 SUMMARY
Bullish above → 26,070
Target zone → 26,110 → 26,146 → 26,194 → 26,309
Bearish below → 25,964
Target zone → 25,902 → 25,860 → 25,820
Key No-Trade Areas:
— 26,036–26,070 (Flat opening zone)
— 26,150–26,194 (High-risk supply zone)
🧾 CONCLUSION
Nifty is trading near a heavy resistance cluster, and the market’s reaction to the 26,070 level will define the day’s trend.
The cleanest and safest trades will come from:
✔️ Breakout & retest above 26,070
✔️ Reversal from 25,964
✔️ Momentum breakout above 26,194
Avoid trading inside choppy zones and let the market reveal its direction.
⚠️ DISCLAIMER
I am not a SEBI-registered analyst . This analysis is for educational purposes only . Please consult a certified financial advisor before making any trading or investment decisions.
NIFTY : Trading levels and Plan for 21-Nov-2025📊 NIFTY TRADING PLAN — 21 NOV 2025
(Reference: 15m chart structure & mapped zones)
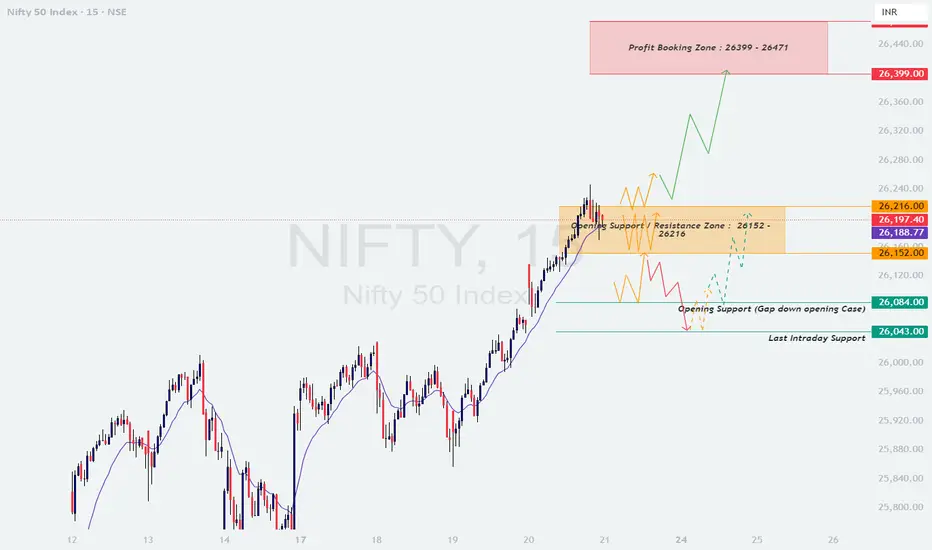
Nifty closed around 26,197, right inside the Opening Support / Resistance Zone (26,152 – 26,216).
Price is consolidating after a strong uptrend, and the market is testing a critical decision zone before attempting either a breakout toward 26,300+ or a pullback toward intraday supports.
Here are the major actionable zones for 21 Nov 2025:
🟧 Opening Support / Resistance Zone: 26,152 – 26,216
🟥 Profit Booking Zone: 26,399 – 26,471
🟩 Opening Support (Gap-down case): 26,084
🟩 Last Intraday Support: 26,043
🟢 SCENARIO 1 — GAP-UP OPENING (100+ Points)
If Nifty opens around 26,260–26,320, price opens above the decision zone and heads closer to resistance.
If price sustains above 26,216 with strong volume →
🎯 Targets → 26,260 → 26,310 → 26,399
Once price enters the Profit Booking Zone (26,399 – 26,471), expect volatility & selling pressure.
💡 Safe to book profits in this region.
If gap-up gets rejected from 26,260–26,300, expect:
➡️ Pullback to 26,216 → 26,180
A bullish reversal at 26,180–26,216 gives a safe continuation long.
📘 Educational Note:
Gap-ups near major resistance can trap buyers. Always wait for confirmation (higher low or retest breakout) before entering.
🟧 SCENARIO 2 — FLAT OPENING (Near 26,150–26,210)
A flat opening places Nifty directly in the Opening Support / Resistance Zone (26,152–26,216) — a “no-direction” zone.
A breakout above 26,216 →
Targets → 26,260 → 26,310
A breakdown below 26,152 →
Targets → 26,120 → 26,084
Avoid trading between 26,152–26,216 until clear breakout or breakdown occurs.
Best trades will be:
✔️ Breakout → Retest → Long
✔️ Breakdown → Retest → Short
💡 Educational Tip:
Flat opens require patience — the first 15-minute candle usually sets the trend for the day.
🔻 SCENARIO 3 — GAP-DOWN OPENING (100+ Points)
A gap-down below 26,120 pushes Nifty toward the Opening Support (26,084) or lower.
If 26,084 holds with a wick-rejection →
Upside targets → 26,150 → 26,180 → 26,216
If price breaks below 26,084, next support:
➡️ 26,043 (Last Intraday Support)
A strong bounce from 26,043 can give an excellent low-risk long entry.
If 26,043 fails, next downside targets expand to:
➡️ 25,990 → 25,950
📘 Educational Note:
Gap-downs into support can reverse sharply — but only when confirmation (reversal candle + volume) is present.
💼 RISK MANAGEMENT TIPS FOR OPTION TRADERS 💡
Avoid trading the first 5–10 minutes if volatility is high.
Prefer ATM or slight ITM options for directional moves.
Always place SL based on structure — not based on emotional comfort.
Don’t average losing positions — trend can continue longer than expected.
Scalp profits quickly during sideways markets.
In high VIX environments → prefer spreads or hedged strategies.
Trail stop-loss if momentum breakout happens.
⚠️ Golden Rule:
Protecting capital > Catching every move. Consistency beats aggression.
📌 SUMMARY
Bullish above → 26,216
🎯 Targets → 26,260 → 26,310 → 26,399 → 26,471
Bearish below → 26,152**
🎯 Targets → 26,120 → 26,084 → 26,043
Key No-Trade Area:
— 26,152–26,216 (opening chop zone)
🧾 CONCLUSION
Nifty is at a decision zone, and the move away from the 26,152–26,216 range will guide the day’s trend.
The safest opportunities will occur from:
✔️ Breakout above 26,216 → Retest → Long
✔️ Reversal from 26,399–26,471 (for intraday short)
✔️ Bounce from 26,084 or 26,043 in gap-down scenarios
Stay patient at the open, trade with confirmation, and avoid the noisy zones.
⚠️ DISCLAIMER
I am not a SEBI-registered analyst.
This analysis is purely for educational purposes.
Please consult your financial advisor before taking any trades.
NIFTY KEY LEVELS FOR 20.11.2025NIFTY KEY LEVELS FOR 20.11.2025
Timeframe: 3 Minutes
If the candle stays above the pivot point, it is considered a bullish bias; if it remains below, it indicates a bearish bias. Price may reverse near Resistance 1 or Support 1. If it moves further, the next potential reversal zone is near Resistance 2 or Support 2. If these levels are also broken, we can expect the trend.
When a support or resistance level is broken, it often reverses its role; a broken resistance becomes the new support, and a broken support becomes the new resistance.
If the range(R2-S2) is narrow, the market may become volatile or trend strongly. If the range is wide, the market is more likely to remain sideways
please like and share my idea if you find it helpful
📢 Disclaimer
I am not a SEBI-registered financial adviser.
The information, views, and ideas shared here are purely for educational and informational purposes only. They are not intended as investment advice or a recommendation to buy, sell, or hold any financial instruments.
Please consult with your SEBI-registered financial advisor before making any trading or investment decisions.
Trading and investing in the stock market involves risk, and you should do your own research and analysis. You are solely responsible for any decisions made based on this research.

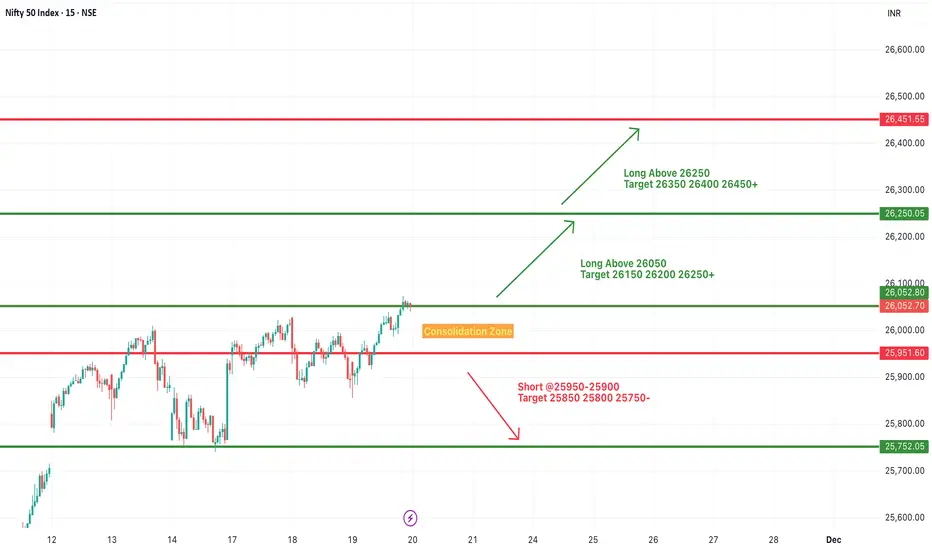
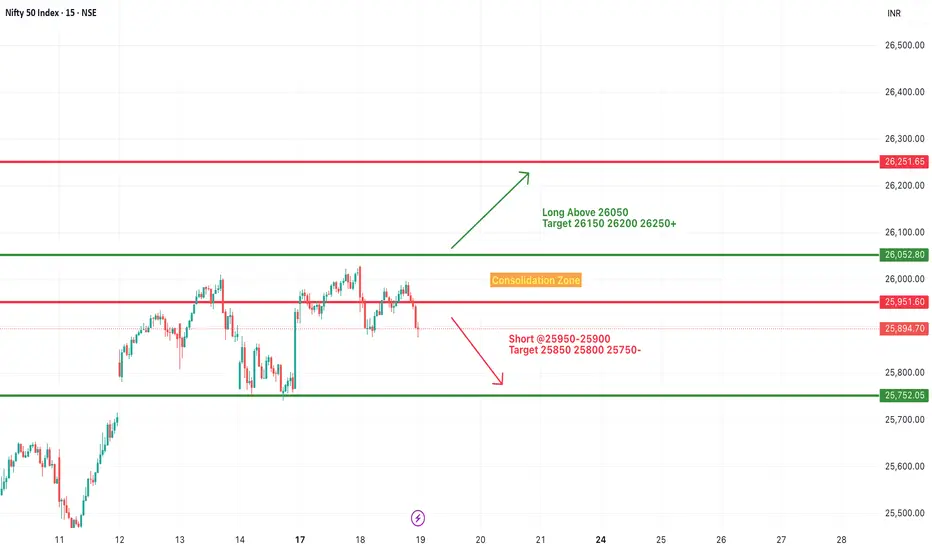
#NIFTY Intraday Support and Resistance Levels - 20/11/2025Nifty is expected to open with a gap-up, indicating continued bullish sentiment and strength above the immediate consolidation zone. If the index sustains above the 26050 level after the opening, it will activate the long trade setup with upside targets of 26150, 26200, and 26250+. A further breakout above 26250 may fuel the next bullish leg toward 26350, 26400, and 26450+.
On the downside, weakness will only come if Nifty slips below the 25950–25900 zone, where short opportunities open up with downside targets at 25850, 25800, and 25750-. For now, the structure remains positive, and the gap-up opening is likely to keep buyers in control as long as key support levels hold firm.
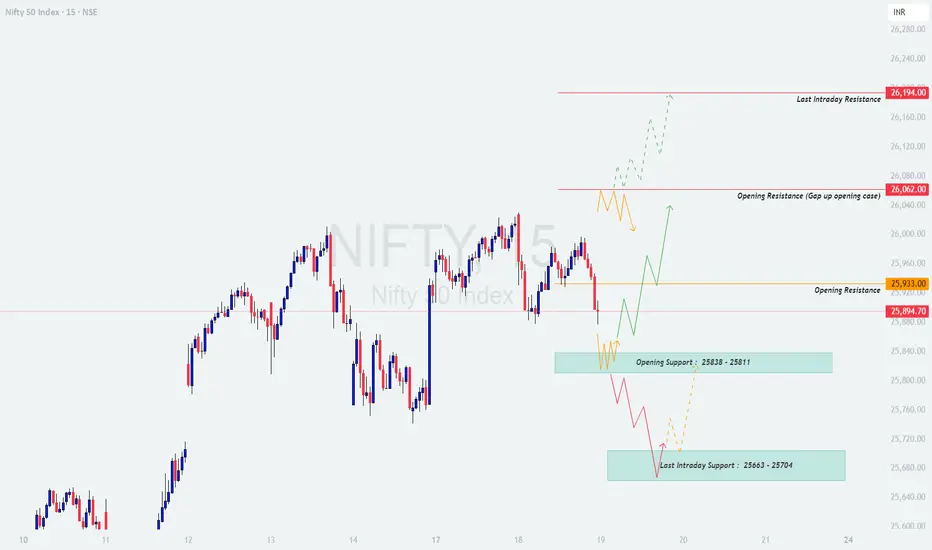
NIFTY - Trading levels and Plan for 19-Nov-2025📊 NIFTY TRADING PLAN — 19 NOV 2025
(Reference: 15-Minute Chart)
Nifty closed near 25,894 with a clear rejection from higher levels and is now sitting just above the crucial Opening Resistance (25,933) . The short-term trend remains mixed, and the market is positioned between two critical zones:
🟩 Opening Support Zone: 25,838 – 25,811
🟩 Last Intraday Support: 25,663 – 25,704
🟥 Opening Resistance: 25,933
🟥 Gap-up Opening Resistance: 26,062
🟥 Major Resistance: 26,194
This structure indicates that Nifty could either attempt a recovery toward 26,050+ or continue a pullback toward 25,700 levels depending on opening behavior.
Below is a detailed plan for all three opening scenarios 👇
---
🟢 SCENARIO 1: GAP-UP OPENING (100+ Points)
If Nifty opens above 26,000 – 26,050 , it will immediately test the Gap-Up Opening Resistance (26,062) , which is a highly reactive supply zone.
If price sustains above 26,062 for 15–20 minutes with good volume, a breakout is confirmed → Target zone:
➡️ 26,120 → 26,194
If price rejects from 26,062, expect a pullback to the Opening Resistance (25,933) .
A retest of 25,933 followed by a bullish candle offers a safe long entry.
Avoid buying immediately at open — gap-up near resistance often traps traders.
🧠 Educational Note:
Gap-ups work well only when follow-through volume confirms strength. If candles are small-bodied or wicks are long at resistance, it indicates exhaustion rather than continuation.
---
🟧 SCENARIO 2: FLAT OPENING (Near 25,880 – 25,930)
A flat opening keeps Nifty exactly at the Opening Resistance (25,933) , turning this level into a decision zone.
A break and sustained close above 25,933 → Targets:
➡️ 26,000 → 26,062 → 26,120
If Nifty fails to cross 25,933 and strongly reverses, expect a dip into the Opening Support (25,838–25,811) .
Only buy after a clean breakout or strong bullish reversal from the support zone.
Avoid trading inside the 25,880–25,930 congestion area in the first 15–20 minutes.
💡 Educational Tip:
Flat openings allow the market to “choose a side.” The best trades come after the breakout of the first 15-min range — not before it.
---
🔴 SCENARIO 3: GAP-DOWN OPENING (100+ Points)
A gap-down near 25,820 – 25,780 pushes Nifty directly into the Opening Support (25,838–25,811) or possibly the Last Intraday Support (25,663–25,704) .
If price holds 25,811 and forms a bullish reversal pattern → Target recovery toward:
➡️ 25,900 → 25,933 → 26,000
If price breaks below 25,811, next support zone is:
➡️ 25,663 – 25,704
A bounce from this zone can offer an excellent low-risk long entry.
If 25,663 breaks decisively with volume → Trend may turn bearish for the day toward 25,580 – 25,520 .
📘 Educational Insight:
Gap-downs near major supports usually give the best reversal trades of the day — but only after confirmation. Never buy blindly expecting a bounce.
---
💼 RISK MANAGEMENT TIPS FOR OPTION TRADERS 💡
Never trade the first 5–10 minutes — wait for trend clarity.
Use ITM or ATM options for directional trades; avoid far OTM unless trend is strong.
Always place a strict stop-loss (15–25 points for options).
Book partial profits after the trade moves 40–50 points in your favor.
Do not average losing trades — exit and re-enter only with confirmation.
When VIX is high → prefer option selling with hedges.
When VIX is low → prefer buying options; avoid selling naked premium.
⚠️ Golden Rule:
Protect your capital. A missed opportunity is better than a forced loss.
---
📈 SUMMARY
Above 25,933 → Bullish toward 26,062 → 26,120 → 26,194
Below 25,838 → Weakness toward 25,811 → 25,704 → 25,663
Major trend level for the day:
➡️ Bullish above 25,933
➡️ Bearish below 25,811
No-trade zones:
➡️ 25,880–25,930 (Flat opening congestion)
---
📚 CONCLUSION
Nifty is positioned at a critical pivot ahead of 19th November. A move above 25,933 can revive bullish momentum, while rejection here may drag it toward the support zones.
The best trades will come from:
✔️ Breakout–retest setups
✔️ Confirmed reversals from marked support zones
✔️ Avoiding early trades in congestion
Trade the reaction, not the prediction. Let the market show you its intention before you commit.
---
⚠️ DISCLAIMER
I am not a SEBI-registered analyst . This analysis is purely for educational purposes . Please consult a certified financial advisor before trading or investing.
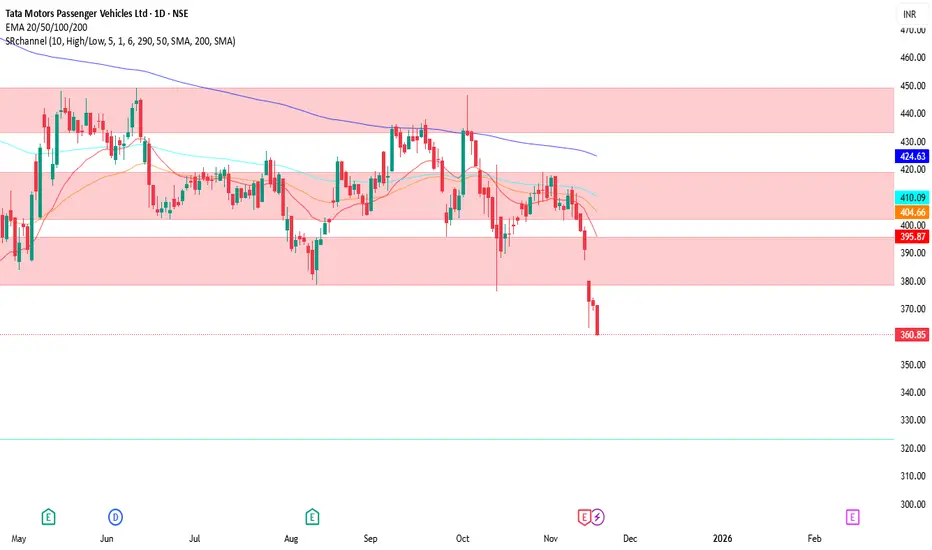
TMPV Short Setup: Expected Decline from 364 to 310 LevelThis trading idea revolves around Tata Motors Passenger Vehicles (TMPV), currently trading around 364 INR. Based on technical analysis and market sentiment, the stock is anticipated to decline towards the 310 INR level.
Analysis Walkthrough:
Current Price Action: The stock is trading near 364 INR, showing weakness with recent downward momentum. The price is below significant moving averages, suggesting bearish pressure.
Resistance and Support: Price action indicates strong resistance around current levels, with previous lows and support zones around 310 INR serving as a potential target area.
Indicators & Confirmation: Momentum indicators (such as RSI and MACD) likely signal bearish divergence or downward trend continuation, supporting the short bias.
Volume Analysis: Volume trends may confirm selling pressure, reinforcing the probability of a downside move.
Trade Setup:
Entry: Initiate a short position near the current level (around 364 INR).
Target: Set a profit target near the key support at 310 INR, which aligns with historical price reactions and expected market behavior.
Stop Loss: Place a stop loss above recent swing highs, ideally around 375-380 INR, to protect against unexpected bullish reversals.
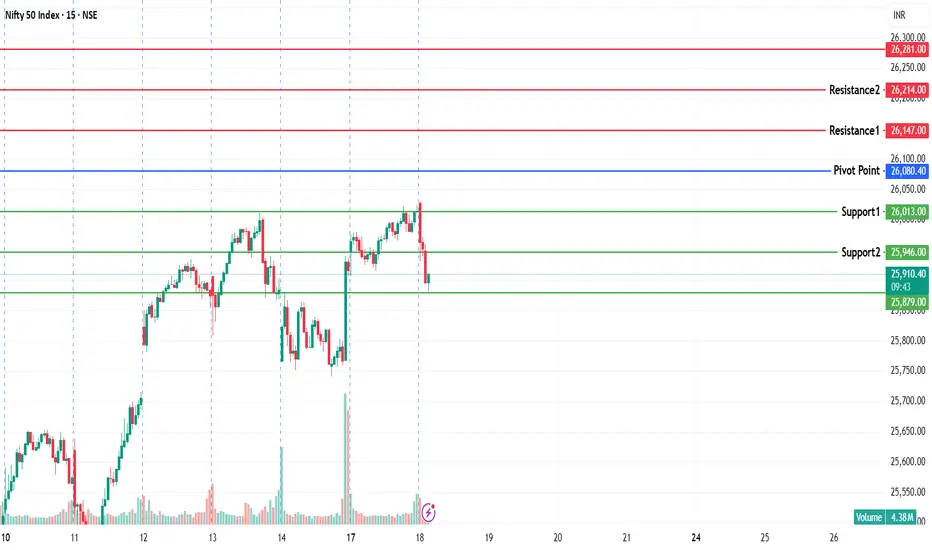
NIFTY KEY LEVELS FOR 19.11.2025NIFTY KEY LEVELS FOR 19.11.2025
Timeframe: 3 Minutes
If the candle stays above the pivot point, it is considered a bullish bias; if it remains below, it indicates a bearish bias. Price may reverse near Resistance 1 or Support 1. If it moves further, the next potential reversal zone is near Resistance 2 or Support 2. If these levels are also broken, we can expect the trend.
When a support or resistance level is broken, it often reverses its role; a broken resistance becomes the new support, and a broken support becomes the new resistance.
If the range(R2-S2) is narrow, the market may become volatile or trend strongly. If the range is wide, the market is more likely to remain sideways
please like and share my idea if you find it helpful
📢 Disclaimer
I am not a SEBI-registered financial adviser.
The information, views, and ideas shared here are purely for educational and informational purposes only. They are not intended as investment advice or a recommendation to buy, sell, or hold any financial instruments.
Please consult with your SEBI-registered financial advisor before making any trading or investment decisions.
Trading and investing in the stock market involves risk, and you should do your own research and analysis. You are solely responsible for any decisions made based on this research.

#NIFTY Intraday Support and Resistance Levels - 19/11/2025Nifty is expected to open flat near the 26000 level, keeping price action inside the same tight range as yesterday. The index is currently trading near an important resistance cluster, so early candles may remain choppy and sideways until a clear directional move develops.
If Nifty sustains above 26,050, upside strength can continue toward 26,150, 26,200, and 26,250+. A breakout above 26,050 will act as the primary confirmation for long positions, indicating fresh buyer momentum.
On the downside, if the index slips below 25,950–25,900, a short setup may get activated toward 25,850, 25,800, and 25,750-. This zone has acted as support earlier, so a breakdown may lead to a quick intraday slide.
Overall, with a flat opening and no gap advantage for either side, Nifty remains in a reaction zone. Traders should wait for a decisive move above 26,050 or below 25,950 to catch a clean trend. Use strict SL as volatility may rise around resistance levels.
NIFTY KEY LEVELS FOR 18.11.2025NIFTY KEY LEVELS FOR 18.11.2025
Timeframe: 3 Minutes
Sorry for the delayed post. Delayed due to some technical glitch
If the candle stays above the pivot point, it is considered a bullish bias; if it remains below, it indicates a bearish bias. Price may reverse near Resistance 1 or Support 1. If it moves further, the next potential reversal zone is near Resistance 2 or Support 2. If these levels are also broken, we can expect the trend.
When a support or resistance level is broken, it often reverses its role; a broken resistance becomes the new support, and a broken support becomes the new resistance.
If the range(R2-S2) is narrow, the market may become volatile or trend strongly. If the range is wide, the market is more likely to remain sideways
please like and share my idea if you find it helpful
📢 Disclaimer
I am not a SEBI-registered financial adviser.
The information, views, and ideas shared here are purely for educational and informational purposes only. They are not intended as investment advice or a recommendation to buy, sell, or hold any financial instruments.
Please consult with your SEBI-registered financial advisor before making any trading or investment decisions.
Trading and investing in the stock market involves risk, and you should do your own research and analysis. You are solely responsible for any decisions made based on this research.
#NIFTY Intraday Support and Resistance Levels - 18/11/2025Nifty is opening with a strong gap-up above 26,050, which places the index directly above the key resistance zone it has been struggling to cross for the last few sessions. This type of opening generally indicates bullish continuation, provided the index sustains above 26,050 in the first 10–15 minutes.
If Nifty holds above 26,050, the upside momentum can extend toward 26,150, 26,200, and 26,250+, making long trades valid and high-probability. This level is now the immediate intraday support. Any quick pullback into this zone may also act as a retest entry for buyers.
If the index continues its strength and crosses 26,250, expect another leg of bullish movement toward 26,350, 26,400, and 26,450+. This upper breakout zone is cleaner and can trigger faster trending moves if volume supports it.
On the downside, weakness appears only if Nifty slips below 25,950–25,900, where short trades activate toward 25,850, 25,800, and 25,750-. Until then, sellers will likely stay on the sidelines.
Because of the gap-up, initial volatility may be sharp. Let price stabilise above 26,050 before taking fresh long trades. Overall bias remains strongly positive unless Nifty falls back below the support zone.

NIFTY : Trading levels and Plan for 18-Nov-2025📊 NIFTY TRADING PLAN — 18 NOV 2025
(Timeframe Reference: 15-Min Chart)
Chart Summary:
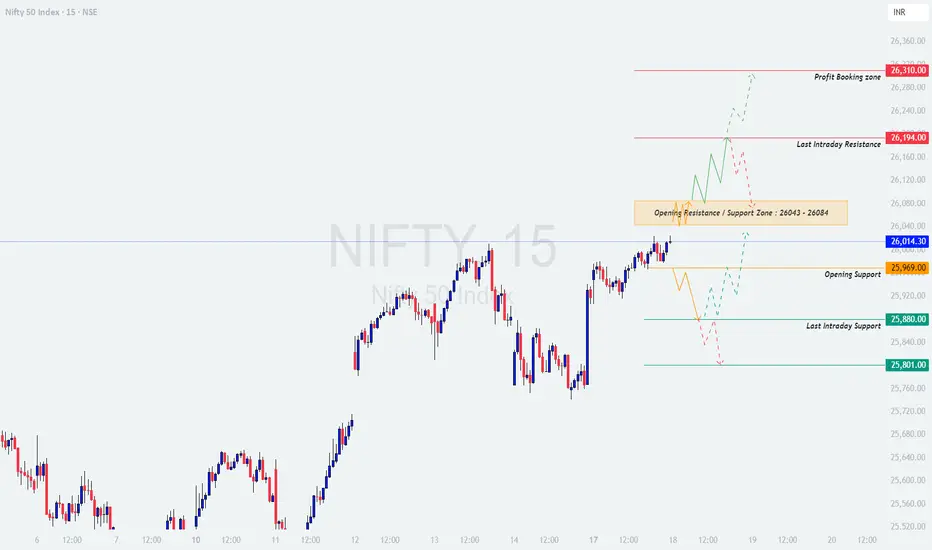
Nifty closed near 26,014 , maintaining a strong recovery momentum with higher highs formation. The index is currently hovering just below the Opening Resistance / Support Zone (26,043 – 26,084) , suggesting that 18th November could be a pivotal session for short-term trend continuation or reversal.
Immediate resistance is visible at 26,194 (Last Intraday Resistance) and a Profit Booking Zone near 26,310 . On the downside, the nearest supports are located at 25,969 (Opening Support) and 25,880 – 25,801 (Last Intraday Support Zone) .
The structure favors a bullish bias as long as price sustains above 25,969 , but traders should remain cautious around higher resistances where profit-taking may emerge.
Key Zones to Watch:
🟩 Supports: 25,969 / 25,880 / 25,801
🟥 Resistances: 26,084 / 26,194 / 26,310
⚖️ Bias: Bullish above 26,084 | Bearish below 25,969
🟢 Scenario 1: GAP-UP Opening (100+ Points)
If Nifty opens around 26,120 – 26,180 , it will start near the Last Intraday Resistance (26,194) . Such openings near resistance often cause early hesitation or consolidation before direction becomes clear.
If price sustains above 26,194 for 15–20 minutes with strong volume, expect a quick move toward the Profit Booking Zone (26,310) .
A breakout above 26,194 followed by a successful retest offers a low-risk buying opportunity for 26,270–26,310 targets.
If rejection candles (like upper wicks or bearish engulfing) appear near 26,194 – 26,310 , expect a short-term pullback toward 26,084 – 26,000 .
Avoid chasing the initial gap-up rally; instead, wait for price to confirm strength or provide a retest entry.
💡 Educational Insight:
Gap-up openings near resistance zones test trader psychology. Retail traders often buy impulsively at highs — professionals wait for confirmation of sustained strength. Always let price action validate breakout continuation before committing capital.
🟧 Scenario 2: FLAT Opening (Around 26,000 – 26,040 Zone)
A flat opening near 26,014 keeps Nifty right within the Opening Resistance / Support Zone (26,043 – 26,084) . This zone acts as a decision point — a breakout could continue bullish momentum, while rejection could trigger short-term correction.
If the index sustains above 26,084 , expect bullish continuation toward 26,194 – 26,310 .
If the index faces rejection and falls below 25,969 , a short-term retracement toward 25,880 – 25,801 is likely.
Avoid taking trades inside 26,000 – 26,080 initially — this zone may witness indecision.
Wait for a strong directional candle close outside the range for trade confirmation.
🧠 Educational Tip:
Flat openings are common near key inflection zones. Avoid being the first to act — let the first 15 minutes set the tone. Volume-backed breakouts from such zones often lead to sustained moves.
🔴 Scenario 3: GAP-DOWN Opening (100+ Points)
If Nifty opens around 25,900 – 25,850 , it will open below the Opening Support (25,969) and closer to the Last Intraday Support Zone (25,880 – 25,801) . This area will be critical to watch for either a quick reversal or extended weakness.
If reversal candles (hammer or bullish engulfing) appear near 25,880 – 25,801 , expect a recovery toward 26,000 – 26,043 .
If the price fails to sustain above 25,880 , bearish momentum may drag Nifty toward 25,700 – 25,600 .
Avoid panic shorting after gap-downs — let the market test supports first.
Watch for volume divergence: if selling volume declines near support, it signals exhaustion and possible intraday reversal.
📘 Educational Note:
Gap-down openings are emotional traps for retail participants. Professionals focus on reaction, not the gap itself. A strong bounce from support zones often provides safer and more rewarding opportunities than chasing fear-driven momentum.
💼 RISK MANAGEMENT TIPS FOR OPTIONS TRADERS:
Avoid trading during the first 15 minutes of market open — volatility is highest and direction unclear.
Never risk more than 1–2% of your capital per trade .
Use ATM or slightly ITM options for directional trades — they move more effectively with price.
Trail stop-loss once the position gains 30–40 points in your favor — protect profits.
Book partial profits at intermediate zones (like 26,084 / 26,194) and hold the rest with SL.
Avoid averaging losing trades — discipline is key.
When in doubt or volatility spikes unexpectedly, step aside; missing a trade is better than forcing one.
⚠️ Golden Rule:
Focus on capital protection over profit chasing . Consistency builds wealth — not aggression.
📈 SUMMARY:
🟩 Key Supports: 25,969 / 25,880 / 25,801
🟥 Key Resistances: 26,084 / 26,194 / 26,310
⚖️ Bias: Bullish above 26,084 | Bearish below 25,969
🎯 Intraday Levels to Watch:
- Breakout above 26,084 → Target 26,194 → 26,310
- Breakdown below 25,969 → Target 25,880 → 25,801
📚 CONCLUSION:
Nifty stands at a critical juncture, oscillating just below major resistance. A breakout above 26,084 can open the path toward 26,310 , while a breakdown below 25,969 may trigger intraday profit booking toward 25,880 – 25,801 .
For 18th November, the key lies in the opening reaction — whether the market builds on momentum or witnesses short-term exhaustion. Stay disciplined, trade only post-confirmation, and align your direction with trend and volume.
📊 Trading success lies not in predicting the move, but in reacting wisely to what unfolds.
⚠️ DISCLAIMER:
I am not a SEBI-registered analyst . The views shared here are purely for educational and informational purposes . Please conduct your own analysis or consult a certified financial advisor before making any trading or investment decisions.
NIFTY : HIT or MISS? Next Move Explained🧠 Nifty Elliott Wave Analysis | Accurate Highs & Bottoms Predicted | Next Move Explained
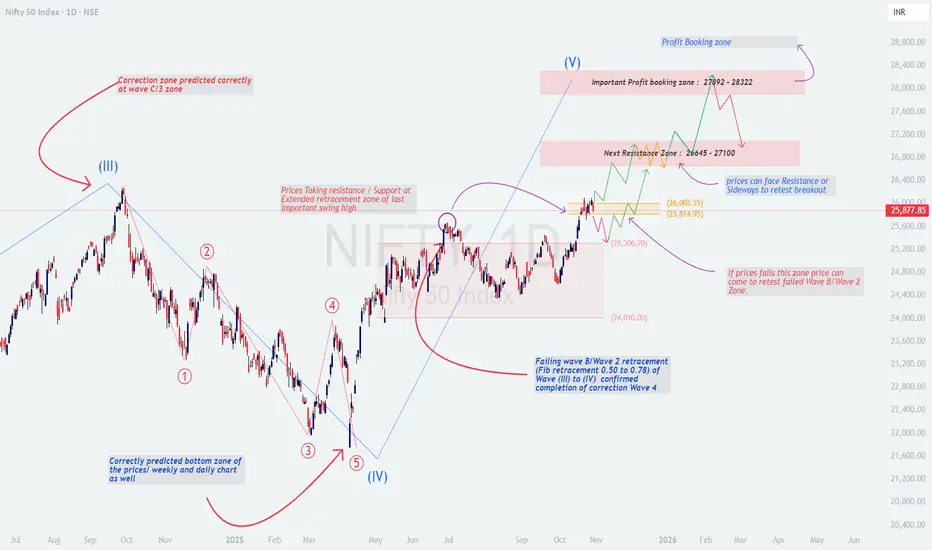
I had accurately predicted both the top (Wave III) and the bottom (Wave IV) of the Nifty move — as seen in the attached chart 📈
The corrective zone at Wave C / 3 and the final retracement completion around Wave 4 were both identified in advance, confirming the accuracy of our earlier projection.
🔍 Current Technical Outlook
Nifty has completed its Wave (IV) correction and is now attempting to form an impulsive Wave (V) move.
Price is currently trading around 25,880, taking resistance near the extended retracement zone of the previous swing high.
If this level is crossed and sustained, the next upside momentum can unfold in multiple stages as shown below.
📈 Upside Projections
Next Resistance Zone: 26,645 – 27,100
🔸 Price may slow down or move sideways to retest the breakout here.
Major Profit Booking Zone: 27,892 – 28,322
🔸 This is a key Fibonacci extension and Wave (V) target area where partial booking is advised.
⚙️ Support & Risk Levels
Immediate Support: 25,814 – 26,000
Major Support: 25,306
Critical Support / Reconfirmation Zone: 24,010 (Failed Wave B / Wave 2 zone)
📉 If prices fail to hold 25,800–25,300, we may see a retest toward 24,000–24,200, which would only delay but not invalidate the long-term bullish structure.
🧭 Expected Price Behaviour
As long as Nifty stays above 25,300, the Wave (V) uptrend remains intact.
Prices can show sideways consolidation or retest near the breakout before pushing higher.
Any strong breakout above 26,650–27,100 can open the gate for 28,000+ targets.
⚠️ Keep Watch & Stay Cautious
Watch for rejection candles or low-volume breakouts near 26,600–27,000 zone.
Stay alert for profit booking or reversal signals near 27,800+.
Ideal approach: Buy on dips, book partial profits near resistance, trail stop-loss.
📅 Posted on: 30 Oct 2025
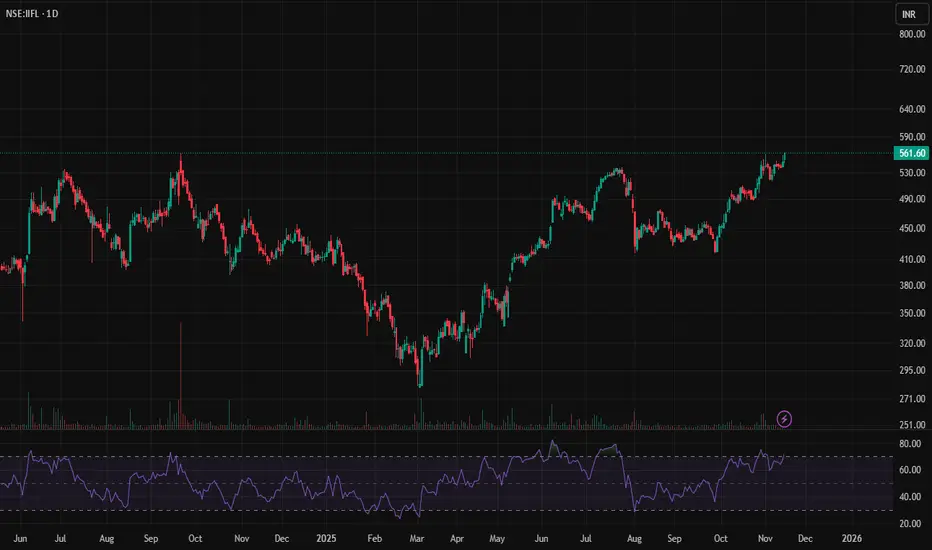
IIFL Live Chart Inverse Head & Shoulders Patternechnical analysis often uses chart patterns to identify potential reversals in market trends. One of the most reliable reversal formations is the Head & Shoulders pattern. When inverted, it signals a possible shift from a downtrend to an uptrend. Let’s explore this concept step by step, using the live chart example of IIFL Finance Limited.
🔻 What is a Head & Shoulders Pattern?
The Head & Shoulders is a reversal chart pattern with three distinct troughs (in the inverse version):
Left Shoulder: A decline followed by a short-term rally.
Head: A deeper decline forming the lowest point of the pattern.
Right Shoulder: A shallower decline, followed by another rally.
These troughs are connected by a neckline, which acts as resistance.
In a regular Head & Shoulders, the pattern signals a bearish reversal.
In an inverse Head & Shoulders, the pattern signals a bullish reversal.
📉 Anatomy of the Inverse Head & Shoulders
Formation: Occurs after a downtrend, showing weakening selling pressure.
Neckline Breakout: When price breaks above the neckline, the pattern is considered complete.
Targets:
First Target: Height of the right shoulder projected upward from the breakout point.
Second Target: Height of the head (deepest low) projected upward from the breakout point.
For IIFL Finance Limited:
Current price: ₹561.60
Breakout above neckline: Indicates bullish continuation.
First target: ₹758.00 (height of right shoulder).
Second target: Calculated from the depth of the head, once price sustains above the first target.
📊 RSI (Relative Strength Index) Confirmation
The RSI is a momentum indicator ranging from 0 to 100.
Above 70: Strong bullish momentum.
Between 50–70: Healthy uptrend.
Below 50: Bearish momentum.
In this case:
RSI above 70 confirms strong buying momentum.
This supports the validity of the inverse Head & Shoulders breakout.
It reduces the risk of a false breakout, showing that buyers are firmly in control.
Pattern Invalid if the stock reverse below the Right Shoulder low price point.
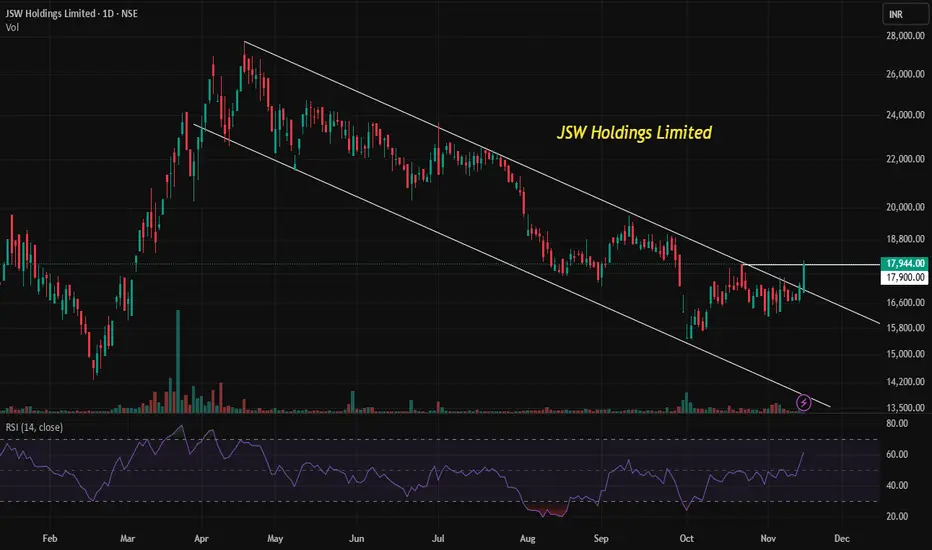
Understanding Downtrend Channels,Breakouts and RSI ConfirmationTechnical analysis often relies on price patterns and momentum indicators to identify potential reversals or continuations in market trends. One of the most widely studied formations is the downtrend channel, which helps traders visualize bearish momentum and anticipate possible turning points. Let’s break this down step by step using the live chart example of JSW Holdings Limited.
🔻 What is a Downtrend Channel?
A downtrend channel is formed when price consistently makes:
Lower Highs (LH): Each rally peaks lower than the previous one.
Lower Lows (LL): Each decline bottoms lower than the previous one.
These points are connected by two parallel lines:
Resistance Line (Upper Boundary): Drawn by connecting the series of lower highs.
Support Line (Lower Boundary): Drawn by connecting the series of lower lows.
This structure visually represents a bearish trend where sellers dominate, pushing prices lower over time.
📉 Characteristics of a Downtrend Channel
Price oscillates between the upper resistance and lower support lines.
Each attempt to rise is capped by the resistance line.
Each decline extends to or below the support line.
Volume often contracts during the channel, reflecting indecision or consolidation within the bearish move.
🚀 Breakout Above the Channel
When price breaks above the resistance line, it signals a potential trend reversal.
Key points to note:
Higher Highs (HH): If the breakout is followed by a rally that surpasses the last lower high, the market begins forming higher highs.
Higher Lows (HL): If subsequent pullbacks stop above previous lows, the market establishes higher lows.
Together, HH + HL = new uptrend channel formation.
This transition marks the shift from bearish control to bullish momentum.
📊 Role of RSI (Relative Strength Index)
The RSI is a momentum oscillator ranging from 0 to 100.
Below 50: Indicates bearish momentum.
Above 50: Suggests bullish momentum.
Breakout Confirmation: When RSI rises above 50 during a breakout, it strengthens the case for a trend reversal.
In the case of JSW Holdings Limited:
RSI above 50 confirms bullish momentum.
Breakout accompanied by volume adds conviction, showing strong buying interest rather than a false breakout.
📝 Putting It All Together
Downtrend Channel: April–October 2025 saw JSW Holdings forming lower highs and lower lows.
Breakout: Price has now moved above the resistance line, attempting to surpass its last lower high.
Trend Reversal: If successful, the stock will begin forming higher highs and higher lows, signaling the start of a new uptrend channel.
RSI Confirmation: With RSI above 50 and breakout supported by volume, bullish momentum is validated.
🎯 Educational Takeaway
A downtrend channel helps traders identify bearish phases.
A breakout above resistance is a critical signal of potential reversal.
The higher high, higher low sequence confirms the birth of a new uptrend.
RSI above 50 and volume support act as reliable confirmation tools, reducing the risk of false signals.
Cup & Handle & Momentum: Nifty’s Charge Toward New Highs !🚀 "Cup, Handle & Momentum: Nifty’s Charge Toward New Highs!"
📈 Understanding the Cup & Handle Pattern
The Cup & Handle is one of the most recognized bullish continuation patterns in technical analysis. It visually resembles a teacup:
Cup Formation: Prices decline from a peak, stabilize, and then gradually recover to retest the prior high. This rounded bottom reflects accumulation and investor confidence returning.
Handle Formation: After the cup completes, prices consolidate sideways or slightly downward, forming a smaller dip. This is the market’s “pause,” shaking out weak hands before the next leg higher.
Breakout: When price breaks above the handle’s resistance, it signals renewed buying interest and often leads to strong upward momentum.
In the case of Nifty 50, the cup began forming after the September 2024 all-time high of 26,277. The recent breakout from the handle on the weekly chart suggests that the consolidation phase is complete, and buyers are back in control.
🔍 RSI: The Momentum Gauge
The Relative Strength Index (RSI) is a momentum oscillator that measures the speed and magnitude of price movements.
Range: RSI moves between 0 and 100.
Key Levels:
Above 50 → bullish momentum.
Sustaining above 60 → strong trend confirmation.
Above 70 → overbought, but in strong bull runs, RSI can remain elevated for extended periods.
Currently, Nifty’s RSI is holding above 50 and sustaining near 60, which indicates that momentum is not just positive but strengthening. This aligns perfectly with the breakout from the cup & handle pattern, reinforcing the probability of surpassing the previous high.
⚡ Why This Matters for Learners
Chart Patterns like the Cup & Handle teach us how collective psychology plays out in markets: fear, consolidation, and renewed optimism.
RSI adds a layer of confirmation, showing whether momentum supports the breakout or if it’s likely to fail.
Together, they provide a structured, disciplined approach to studying markets—without cluttering charts with excessive indicators.
🔔 The Big Picture
With the cup & handle breakout and RSI strength, Nifty 50 looks poised to challenge and potentially surpass its September 2024 all-time high of 26,277. If sustained, this could mark the beginning of a fresh leg in India’s equity market rally.

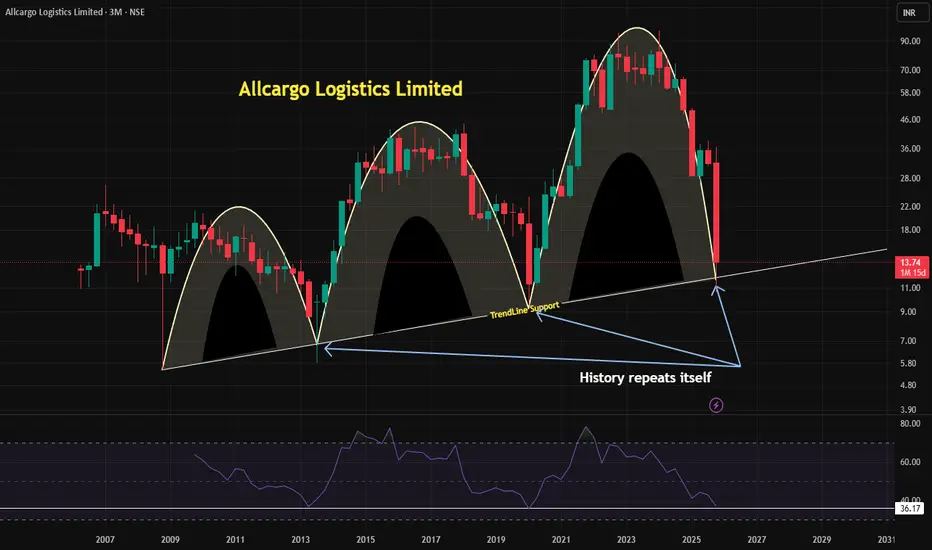
History Repeats Itself in Technical Analysis - Learning📘 History Repeats Itself in Technical Analysis
🔹 Introduction
One of the most fascinating aspects of technical analysis is the idea that price patterns tend to repeat over time. Traders often say, “History repeats itself” because markets are driven by human behavior — fear, greed, and collective psychology — which doesn’t change much across decades.
🔹 Why History Repeats in Charts
Market Cycles: Stocks often move in cycles — uptrends, corrections, consolidations, and reversals.
Investor Psychology: When similar conditions arise, investors react in similar ways, creating recurring chart patterns.
Technical Setups: Patterns like double bottoms, head-and-shoulders, or trendline breakouts often reappear across different stocks and timeframes.
For learners, this means that studying past price action can help anticipate future moves.
🔹 The Current Case Study
The chart you see here is a real example of history repeating itself, The stock has performed a similar cycle in the past. Now, it appears to be technically setting up in the same way again.
Indicators and price action suggest that the market may be preparing for a repeat of its earlier move.
This is a classic demonstration of how technical analysis can help us recognize repeating cycles and prepare for potential opportunities.
🔹 Key Lesson for Learners
Technical analysis is not about predicting the future with certainty. It’s about recognizing patterns that tend to repeat because market psychology is consistent.
By studying these cycles, traders can make more informed decisions. Keep Learning
Understanding Long-Term Downtrends and Breakouts: IDEAFORGE📘 Understanding Long-Term Downtrends and Breakouts: A Case Study on IdeaForge Technology - Live Chart
In technical analysis, price charts often tell a story of investor sentiment and market psychology. One of the most powerful narratives is the long-term downtrend — a period where prices consistently move lower, reflecting sustained selling pressure. Recognizing when this trend might reverse is crucial for traders and investors. Let’s explore this concept using the Live Chart example of IdeaForge Technology, which has been in a downtrend since its first trade in 2023.
🔹 The Long-Term Downtrend
A downtrend is defined by lower highs and lower lows on the chart.
Since 2023, IdeaForge has consistently traded below its downtrend line on the weekly chart.
This line acts as a dynamic resistance, meaning every time the price approaches it, sellers regain control and push it lower.
For learners, the key takeaway is: the longer a downtrend persists, the more significant a breakout becomes when it finally occurs.
🔹 Attempted Breakouts
In June 2025, the price attempted to move above the downtrend line but failed.
Instead of making a fresh lower low after the failure, the stock only corrected mildly.
This subtle change in behavior is important: it suggests that selling pressure may be weakening, and buyers are beginning to challenge the trend.
🔹 The Role of RSI (Relative Strength Index)
The RSI indicator is a simple yet powerful tool to measure momentum:
During the downtrend, RSI often dipped below 30, signaling oversold conditions and confirming weakness.
After the June 2025 breakout attempt, RSI did not collapse to new lows. Instead, it sustained around 50 and has now moved positively above that level.
For learners:
RSI below 30 → strong selling, oversold zone.
RSI around 50 → neutral ground, often a battleground between buyers and sellers.
RSI moving above 50 → momentum shifting in favor of buyers.
This shift in RSI behavior is a leading clue that the trend may be reversing.
🔹 Why This Matters
A breakout above a long-term downtrend line after years of weakness is not just another chart event. It signals a potential change in market psychology. When combined with improving RSI momentum, the probability of a sustained reversal increases.
Additionally, positive fundamental news (such as an current order win) can act as a catalyst, supporting the technical setup.
🔹 Key Lessons for Learners
Respect the Downtrend: Never underestimate the power of a long-term trend. Fighting against it prematurely often leads to losses.
Watch for Behavior Changes: Failed breakdowns or weaker corrections can hint at a shift in sentiment.
Use RSI Wisely: RSI is a simple momentum tool. Focus on its movement around 30, 50, and 70 rather than cluttering your chart with too many indicators.
Breakouts After Long Periods Are Powerful: The longer the consolidation or downtrend, the more meaningful the breakout.
🔹 Conclusion
IdeaForge Technology’s chart offers a textbook example of how to study a long-term downtrend, recognize breakout attempts, and interpret RSI signals. For learners, the lesson is clear: patience and observation are key. A breakout above a multi-year downtrend line, supported by improving RSI, can mark the beginning of a new trend — and understanding this process is essential for successful trading.
Live Chart Example

NIFTY KEY LEVELS FOR 17.11.2025NIFTY KEY LEVELS FOR 17.11.2025
Timeframe: 3 Minutes
Sorry for the delayed post.
If the candle stays above the pivot point, it is considered a bullish bias; if it remains below, it indicates a bearish bias. Price may reverse near Resistance 1 or Support 1. If it moves further, the next potential reversal zone is near Resistance 2 or Support 2. If these levels are also broken, we can expect the trend.
When a support or resistance level is broken, it often reverses its role; a broken resistance becomes the new support, and a broken support becomes the new resistance.
If the range(R2-S2) is narrow, the market may become volatile or trend strongly. If the range is wide, the market is more likely to remain sideways
please like and share my idea if you find it helpful
📢 Disclaimer
I am not a SEBI-registered financial adviser.
The information, views, and ideas shared here are purely for educational and informational purposes only. They are not intended as investment advice or a recommendation to buy, sell, or hold any financial instruments.
Please consult with your SEBI-registered financial advisor before making any trading or investment decisions.
Trading and investing in the stock market involves risk, and you should do your own research and analysis. You are solely responsible for any decisions made based on this research.
