#NIFTY Intraday Support and Resistance Levels - 10/11/2025Nifty is expected to open flat to slightly gap up near the 25,500–25,550 zone, showing early signs of stability after the recent correction. The index is currently trading within a consolidation range, where both buyers and sellers are actively defending key levels.
If Nifty sustains above 25,550–25,600, it may trigger a short-covering rally toward 25,650, 25,700, and 25,750+. A breakout above 25,750 could further strengthen the momentum and shift sentiment toward the bullish side.
On the downside, immediate support lies near 25,450, and a breakdown below this level may lead to a retest of 25,350, 25,300, and 25,250 zones. Sustained weakness below 25,250 would open the door for deeper corrections.
Overall, with a flat to slightly gap up opening, Nifty may witness a range-bound to mildly positive session in the first half. Traders should watch for a breakout above 25,600 for long opportunities or a breakdown below 25,450 for short setups, while maintaining tight stop losses in this consolidation phase.
Niftyprediction
NIFTY - Trading levels and Plan for 10-Nov-2025📊 NIFTY TRADING PLAN — 10 NOV 2025
(Timeframe Reference: 15-Min Chart)
Chart Summary:
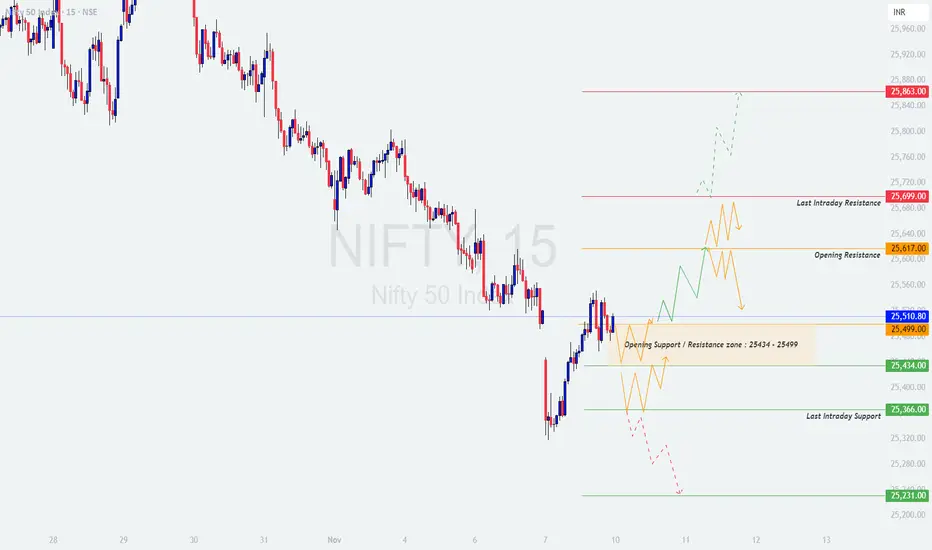
Nifty is currently trading around the 25,510 zone, situated right near the Opening Support / Resistance Zone (25,434 – 25,499) . The market structure shows a short-term base building, with the index now oscillating between 25,434 on the downside and 25,617 on the upside. A breakout beyond either level could define the trend for the session.
Key levels to watch include:
🟢 Resistance Zones: 25,617 (Opening Resistance), 25,699 (Last Intraday Resistance), 25,863 (Next Upside Level)
🔴 Support Zones: 25,434 (Immediate), 25,366 (Last Intraday Support), 25,231 (Final Support)
With volatility expected due to global cues and options expiry positioning, traders should emphasize patience, discipline, and confirmation before entry.
🟢 Scenario 1: GAP-UP Opening (100+ Points)
If Nifty opens near or above 25,610 – 25,640 , it will directly test the Opening Resistance zone. Bulls need to sustain above this level to maintain control.
If price sustains above 25,617 for 15–30 minutes with strong candle closings and rising volume, a move toward 25,699 and possibly 25,863 can unfold.
However, if price fails to sustain above 25,617 and forms rejection candles or bearish patterns (like shooting star or engulfing), traders can expect a pullback toward 25,510 – 25,499 .
A failed breakout above 25,617 can offer a short-term shorting opportunity back into the consolidation range.
Avoid aggressive long entries immediately after the gap-up — wait for retests and volume confirmations.
💡 Educational Note:
A gap-up does not guarantee continuation. Many traders get trapped in "breakout euphoria" without waiting for confirmation. The key is sustained price action with strong volume. Smart traders often buy on dips after confirmation, not at the peak of the first candle.
🟧 Scenario 2: FLAT Opening (Within 25,434 – 25,499 Zone)
A flat opening inside the Opening Support / Resistance Zone will likely cause initial indecision. The market may first trap both sides before picking direction.
Avoid trading the first few 15-min candles if price stays within 25,434 – 25,499 .
If price breaks above 25,499 decisively with strength, the momentum could carry it toward 25,617 and 25,699 .
If price breaks below 25,434 , it may drag the index lower toward 25,366 , and in case of strong selling, 25,231 .
Ideal strategy: Wait for breakouts with closing confirmation. Avoid countertrend trades in this setup.
🧠 Educational Tip:
Flat openings test patience — they’re designed to frustrate impulsive traders. Remember: The first move after a flat open is often false. Wait for clear direction confirmed by price structure and volume alignment before taking a stance.
🔴 Scenario 3: GAP-DOWN Opening (100+ Points)
If Nifty opens below 25,410 or near 25,366 , sentiment may turn weak initially, bringing the Last Intraday Support (25,366 – 25,231) into focus.
If a reversal candle forms near 25,366 – 25,231 (hammer or bullish engulfing), traders can look for short-covering opportunities toward 25,434 – 25,499 .
However, if price sustains below 25,366 , then weakness can extend further, possibly toward 25,200 – 25,150 zones.
Avoid shorting immediately after a big gap-down. Wait for a pullback toward resistance levels for better entry and risk-reward balance.
Volume confirmation near support zones is critical — weak volume during selloffs often precedes reversals.
📘 Educational Insight:
Gap-downs tend to trigger fear-based selling early in the session. The best approach is to observe — not react — in the first few minutes. If buyers start stepping in near strong support levels, that’s often where reversals begin. Let price tell you its story before taking sides.
💼 RISK MANAGEMENT TIPS FOR OPTIONS TRADERS:
Avoid buying options during the first 15 minutes of volatile openings — inflated IV spikes can cause fast premium decay.
Always define your stop-loss before entry and risk a maximum of 1–2% of total capital per trade.
Use ITM options for cleaner directional plays; avoid far OTM contracts unless volatility breakout is confirmed.
Trail stop-losses once your trade moves 30–40 points in your favor — protect profits and minimize emotional exits.
Never trade without a plan. The best traders protect their capital first, profits come next.
📈 SUMMARY:
🟧 Opening Support / Resistance Zone: 25,434 – 25,499
🟥 Resistance Zones: 25,617 / 25,699 / 25,863
🟩 Support Zones: 25,434 / 25,366 / 25,231
⚖️ Bias: Neutral-to-Bullish above 25,499 | Weakness below 25,434
📚 CONCLUSION:
Nifty is currently at a pivotal range, consolidating before its next major breakout. The 25,434 – 25,499 zone is the short-term decision point. A break above 25,499 can reignite bullish sentiment, while a fall below 25,434 may extend weakness toward 25,366 or even 25,231 .
Be patient during the opening volatility and focus on clarity over speed. The first 15–30 minutes often decide the day’s fate — don’t rush into uncertain setups.
📊 Consistency in following your plan is more powerful than chasing every move.
⚠️ DISCLAIMER:
I am not a SEBI-registered analyst . The views and levels shared are for educational purposes only . Please do your own research or consult a registered financial advisor before making any trading or investment decisions.
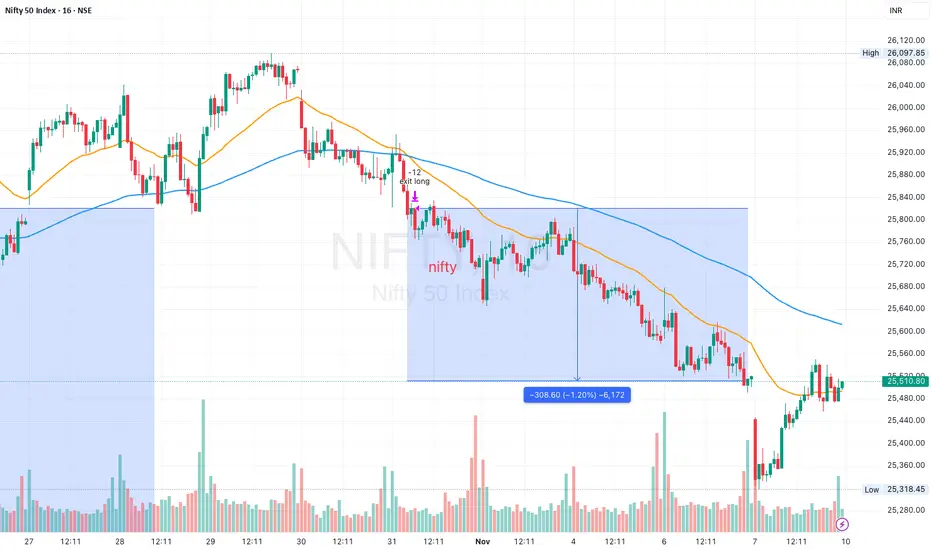
07 Nov 2025–308pts profits and counting on the Nifty short tradeNifty Stance Bearish 🐻
We went short on Nifty last Friday, and this complete week, we have had a decent one-way fall. So far, we have fallen 308pts, and it looks like more shorts could enter the system even if we remain flattish over the next two days. There was a holiday in between, but it did not affect the markets, and the journey has been one-sided so far this week.
One interesting technical data point is the first candle of today, when we fell to 25318, and from there we saw an intraday recovery of 234+ pts. We might have ended the day in green, but for the lack of momentum in the last hour of trade.
My nearest support levels are at 25219 and 25003, and I was really surprised to see markets take a U-turn at 25318. The closest resistance is at 25681, followed by 25906.
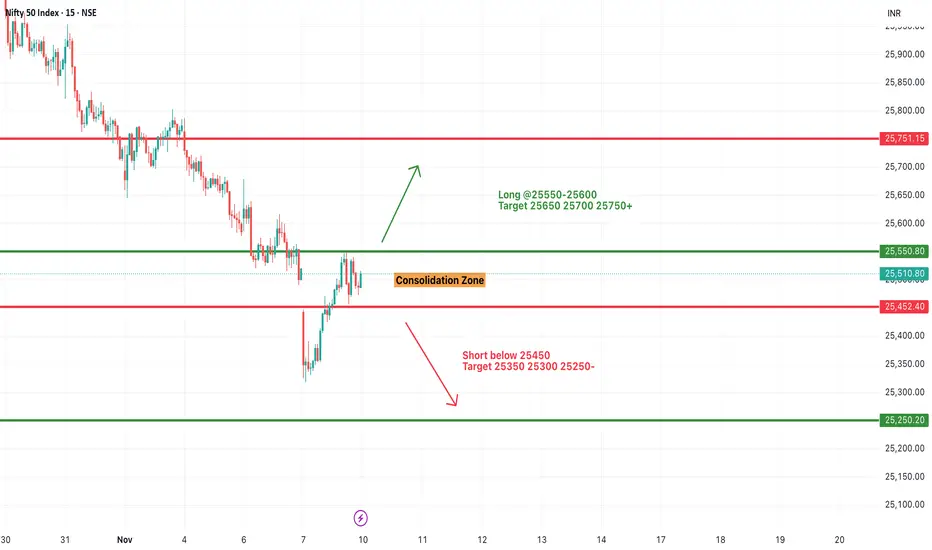
Banks Ready for Next Rally — Nifty Needs to Confirm Itself NSE:NIFTY bounced exactly from our support at 25335, which I mentioned in the last commentary.
At first glance, it looks like a solid recovery, but internally, the momentum still feels weak as the index failed to close above the previous day’s close.
So we need a follow-up move tomorrow to confirm whether this bounce can actually sustain.
For now, I’ll stay sideways until the market confirms its direction.
I’ll be watching the 25550 resistance closely. Only if the market gives a strong close above this level will I consider going long on the index, because above 25550 we could see sharp short covering straight toward 25800.
Support remains at 25335. A drop below this could go very wrong — a fall toward 24700–24600 would then be possible.
NSE:BANKNIFTY , on the other hand, looks much better. Both its intraday and daily structures are bullish, clearly showing that banks may lead the next rally.
It has strong support at 57350 and resistance at 58250. If this support holds through the week, we might see 60300 levels very soon.
Many sector-specific stocks are showing good momentum setups that could perform well next week. Still, treat those bounces as profit-booking opportunities, not long-term holds. We’ll get better setups ahead.
You can trade confidently, but make sure to lock in your profits.
Sector-wise, NSE:CNXFINANCE , NSE:CNXMETAL , and NSE:CNXAUTO Parts stocks look strong for swing trades.
That’s all for the day. Take care and have a profitable week ahead.
📊Levels at a glance:
Nifty Support: 25335 (break = 24700–24600)
Nifty Resistance: 25550 (break = short covering to 25800)
BankNifty Support: 57350
BankNifty Resistance: 58250 (above = rally to 60300)
Bias: Sideways till confirmation
Sectors to watch: Financials, Metals, Auto Parts
Strategy: Trade swings, book profits on bounces
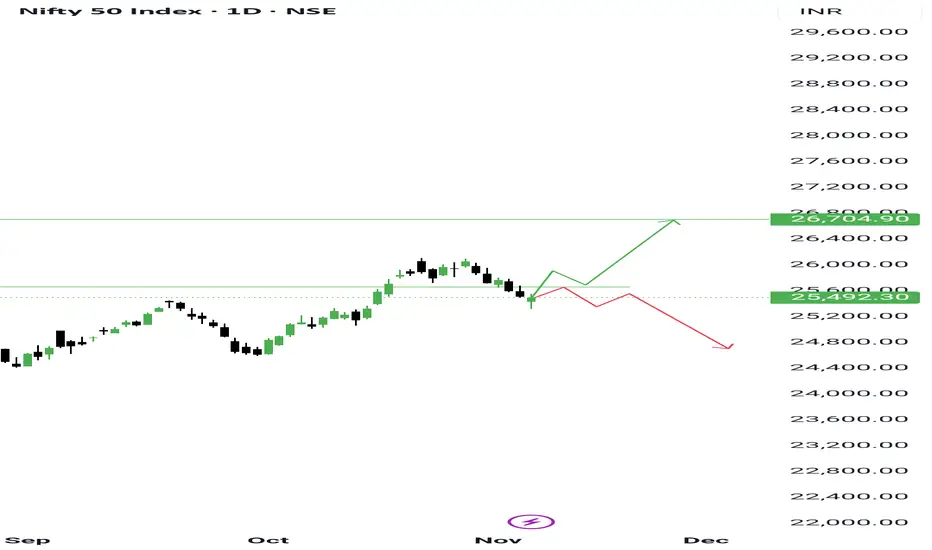
NIFTY 50There's a high possibility, NIFTY could test below white line or 24770 within 17th Nov 2025 .
Disclaimer:
It's a personal view not a financial advice and I assume no responsibility and liability whatever outcome arises.

IDBI Bank and the Bullish Cup & Handle Pattern📈 Technical Analysis Spotlight: IDBI Bank and the Bullish Cup & Handle Pattern
In the world of technical analysis, chart patterns often serve as powerful indicators of potential price movements. One such pattern, the Cup and Handle, has recently emerged on the daily chart of IDBI Bank Limited, offering traders and investors a compelling bullish setup.
🏦 Current Market Snapshot
As of the latest data, IDBI Bank is trading at ₹100.42. This price action is notable not just for its level, but for the structure it has formed—a classic Cup and Handle pattern, which is widely regarded as a bullish continuation signal.
☕ Understanding the Cup and Handle Pattern
The Cup and Handle pattern resembles the shape of a tea cup:
The "cup" forms after a rounded bottom, indicating a period of consolidation and accumulation.
The "handle" follows as a short-term pullback, typically on lighter volume, before a potential breakout.
This pattern reflects a shift in market sentiment—from bearish to bullish—as buyers gradually regain control.
📊 Technical Confirmation
Several factors strengthen the bullish outlook for IDBI Bank:
The stock is trading above its 50-day and 100-day Simple Moving Averages (SMA), suggesting medium-term strength and trend alignment.
The neckline resistance—the key breakout level—is identified at ₹106. A decisive move above this level would confirm the completion of the Cup and Handle pattern.
🚀 What Happens After the Breakout?
If IDBI Bank breaks above ₹106 with strong volume, it could trigger a bullish rally, as the pattern implies renewed buying interest and momentum. Traders often look for price targets by measuring the depth of the cup and projecting it upward from the breakout point.
🧠 Final Thoughts
The Cup and Handle pattern on IDBI Bank’s chart, combined with its position above key moving averages, presents a textbook bullish setup. While no pattern guarantees future performance, this formation is a favorite among technical analysts for its reliability and clarity.
As always, traders should consider risk management and broader market conditions before acting on any signal.

NIFTY : Trading levels and Plan for 07-Nov-2025📊 NIFTY TRADING PLAN — 07 NOV 2025
(Timeframe Reference: 15-Min Chart)
Chart Summary:
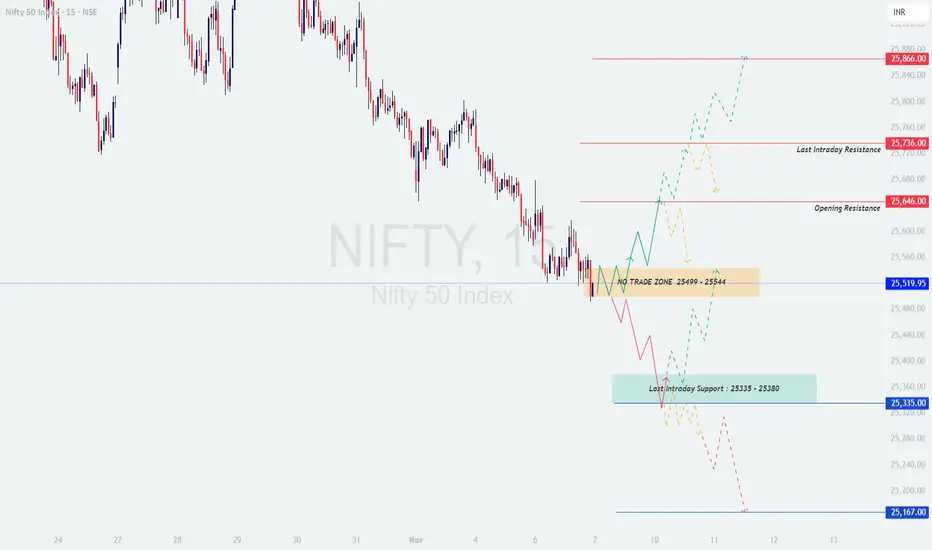
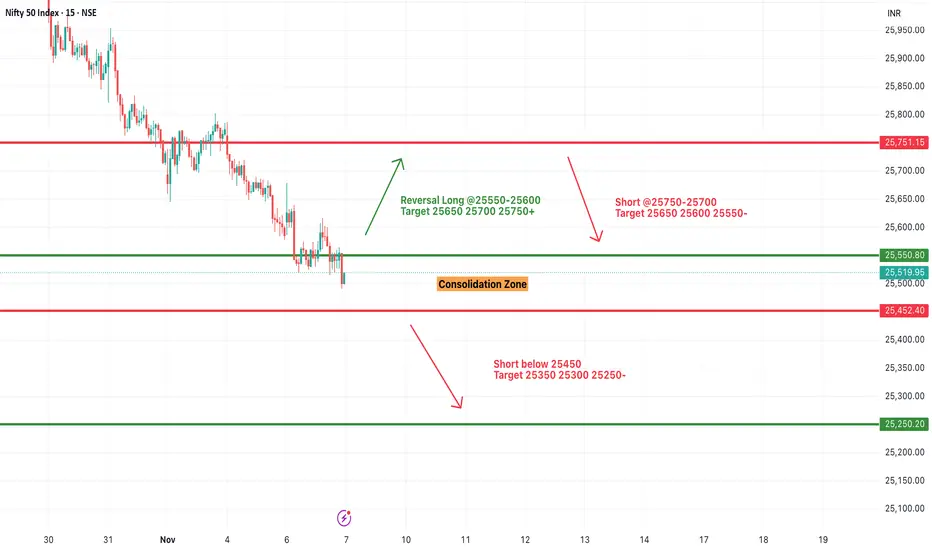
Nifty is currently trading near the 25,520 zone, which lies just below the identified Opening Resistance (25,646) and slightly above the No-Trade Zone (25,449 – 25,544) . The index remains range-bound, but volatility is expected to pick up as it approaches key breakout zones. A decisive move beyond these levels could trigger strong directional momentum — either continuation or reversal.
The broader trend bias remains neutral-to-bullish unless Nifty slips below 25,380 , which marks the last intraday support area.
🟢 Scenario 1: GAP-UP Opening (100+ Points)
If Nifty opens around or above 25,620 – 25,650 , it will open directly near the Opening Resistance zone. A strong gap-up needs immediate follow-through to sustain bullish momentum.
If price sustains above 25,646 with strong bullish candles and volume confirmation, traders can look for long entries targeting 25,736 and 25,866 .
However, failure to hold above 25,646 may indicate exhaustion. Rejection candles near resistance could invite short-term profit booking and a retracement toward 25,544 – 25,490 .
Ideal strategy: Wait for the first 15–30 minutes to confirm momentum. Enter on pullbacks rather than chasing the initial move.
💡 Educational Note: Gap-ups often lure traders into impulsive entries. The key is confirmation — a sustained break above the resistance with rising volume confirms institutional participation. Always avoid long positions if the first candle forms a wick-type rejection near resistance.
🟧 Scenario 2: FLAT Opening (Within 25,449 – 25,544)
This range represents the No-Trade Zone . Flat openings within this area typically cause early volatility and indecision. Traders should avoid taking trades immediately as price may oscillate rapidly before choosing direction.
Avoid entering trades within the 25,449 – 25,544 band.
If price breaks above 25,544 decisively with strong green candles, upside targets remain 25,646 → 25,736 .
If price breaks below 25,449 , it could drift lower toward 25,380 – 25,335 (the last intraday support zone). Sustained selling may extend weakness toward 25,167 .
🧠 Educational Tip: During flat openings, avoid predicting direction. Let the breakout confirm. Early trades inside such zones are mostly hit by stop-loss whipsaws. The best trades emerge after clarity, not anticipation.
🔴 Scenario 3: GAP-DOWN Opening (100+ Points)
If Nifty opens below 25,420 , sentiment will likely turn weak, and price may test the Last Intraday Support (25,335 – 25,380) .
If a reversal candle (hammer or bullish engulfing) forms within the 25,335 – 25,380 support area, it can offer a short-covering opportunity toward 25,490 – 25,544 .
However, if Nifty breaks and sustains below 25,335 , further downside may open toward 25,167 .
Avoid shorting directly on deep gap-downs — wait for a pullback near 25,490 – 25,544 to get a better entry with favorable risk-reward.
📘 Educational Insight: Gap-downs often lead to panic selling in the opening moments. Patience and confirmation are crucial. If volume starts drying near support zones, it usually indicates seller fatigue and potential reversal setups.
💼 RISK MANAGEMENT TIPS FOR OPTIONS TRADERS:
Avoid buying options in the first 15 minutes of volatile openings — IV (Implied Volatility) spikes can cause inflated premiums.
Always define your stop-loss before entering a trade; risk no more than 1–2% of your total capital per setup.
Use ITM options for directional conviction and avoid OTM strikes in a range-bound market.
Trail your stop-loss once your position gains 30–40 points in favor.
Remember: Capital protection is your first priority; missing a trade is better than a forced loss.
📈 SUMMARY:
🟧 No-Trade Zone: 25,449 – 25,544
🟥 Resistance Zones: 25,646 / 25,736 / 25,866
🟩 Support Zones: 25,380 – 25,335 / 25,167
⚖️ Bias: Neutral-to-Bullish above 25,544 | Weakness below 25,449
📚 CONCLUSION:
Nifty stands at a critical juncture between consolidation and breakout. The 25,544 level acts as a trigger for directional clarity — a sustained move above can revive bullish sentiment, while a fall below 25,449 may bring further weakness.
Be patient during opening volatility, focus on level confirmations, and let price action guide you rather than emotions.
📊 Trading is not about catching every move — it’s about catching the right move at the right time.
⚠️ DISCLAIMER:
I am not a SEBI-registered analyst . The analysis shared above is purely for educational purposes and market understanding. Please consult a certified financial advisor before taking any trading or investment decisions.
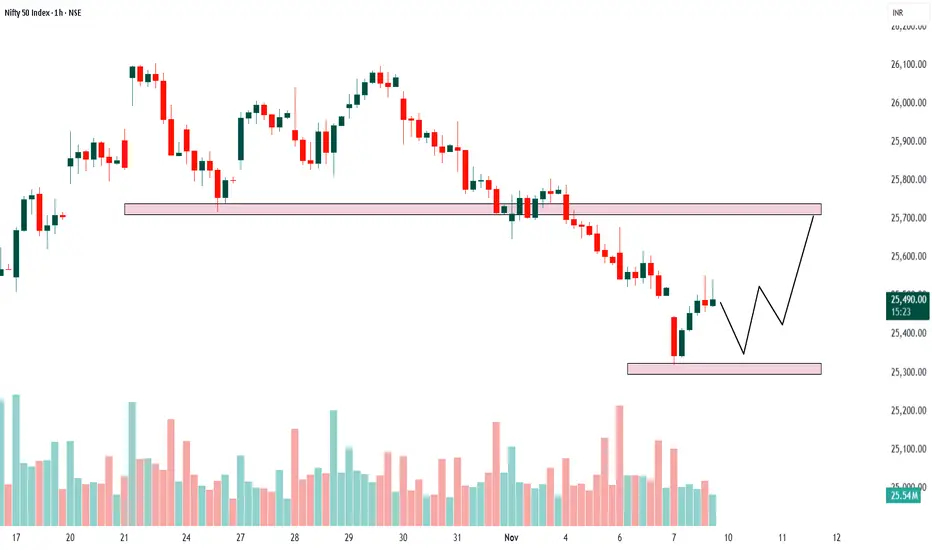
Nifty 01 hour : buy on dipsNifty 50 (1-hour chart)
The price is currently taking support near 25,300 and facing resistance around 25,700. The chart shows that buyers are trying to defend the lower zone, which has acted as support before.
After a small bounce, price may again retest near 25,400 before moving higher towards 25,700. This movement will form a short-term range between 25,300 and 25,700.
If price breaks above 25,700 with strong volume, the next upside move can start. But if it breaks below 25,300, more downside pressure may come.
Overall, the market is in a short-term consolidation phase where traders can watch for breakout opportunities from either side.
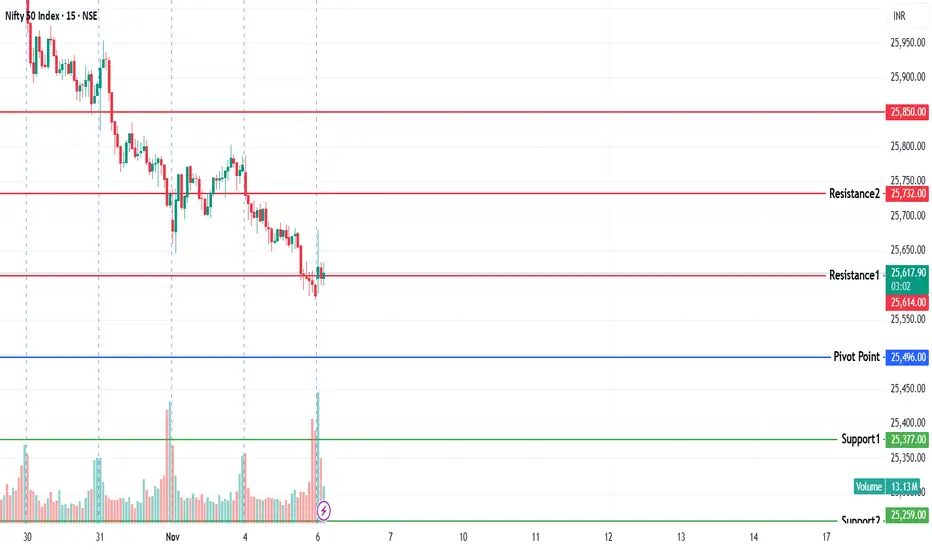
NIFTY KEY LEVELS FOR 07.11.2025NIFTY KEY LEVELS FOR 07.11.2025
Timeframe: 3 Minutes
If the candle stays above the pivot point, it is considered a bullish bias; if it remains below, it indicates a bearish bias. Price may reverse near Resistance 1 or Support 1. If it moves further, the next potential reversal zone is near Resistance 2 or Support 2. If these levels are also broken, we can expect the trend.
When a support or resistance level is broken, it often reverses its role; a broken resistance becomes the new support, and a broken support becomes the new resistance.
If the range(R2-S2) is narrow, the market may become volatile or trend strongly. If the range is wide, the market is more likely to remain sideways
please like and share my idea if you find it helpful
📢 Disclaimer
I am not a SEBI-registered financial adviser.
The information, views, and ideas shared here are purely for educational and informational purposes only. They are not intended as investment advice or a recommendation to buy, sell, or hold any financial instruments.
Please consult with your SEBI-registered financial advisor before making any trading or investment decisions.
Trading and investing in the stock market involves risk, and you should do your own research and analysis. You are solely responsible for any decisions made based on this research.

#NIFTY Intraday Support and Resistance Levels - 07/11/2025Nifty is likely to open with a gap down near the 25,450 zone, reflecting continued weakness and bearish sentiment in the market. The index remains under selling pressure, trading below key resistance levels, which suggests that bears are still in control in the short term.
If Nifty sustains below 25,450, it may extend the decline toward 25,350, 25,300, and 25,250, where a temporary pullback could occur. A breakdown below 25,250 will further intensify weakness, opening the way for deeper targets around 25,150–25,100.
On the upside, immediate resistance lies near 25,550–25,600. A sustained move above this level could trigger a short-covering rally toward 25,650 and 25,750, but the broader trend will remain bearish unless the index reclaims 25,750 decisively.
Overall, with a gap down opening near 25,450, the sentiment is expected to remain negative to range-bound. Traders should watch for a break below 25,450 for continuation trades on the downside and consider a reversal only if Nifty manages to hold above 25,550 with strong momentum. Maintaining strict stop losses is advised due to potential volatility in the early session.
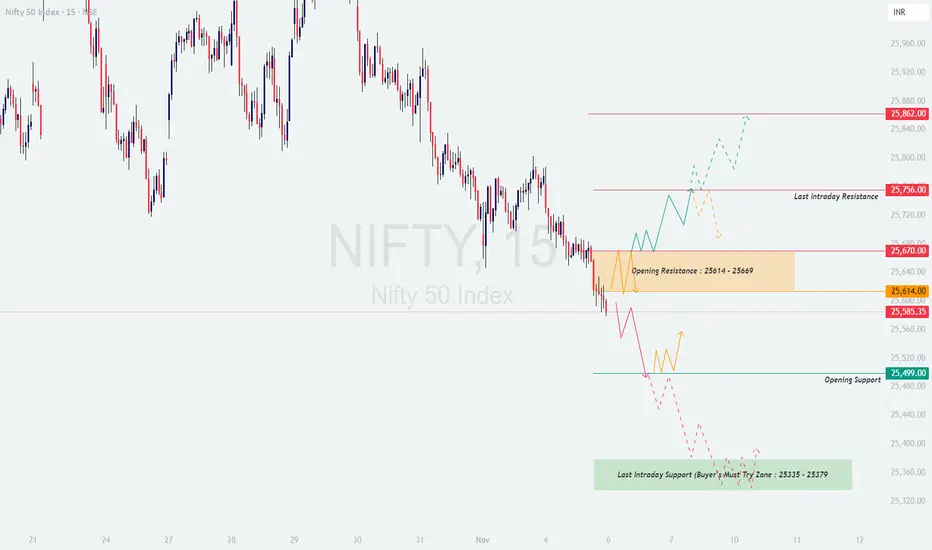
NIFTY : Trading levels and plan for 05-Nov-2025🔹 NIFTY Trading Plan for 05-Nov-2025
(Based on psychological correction theory & intraday structural behavior)
Chart Reference Levels:
🟧 Opening Resistance Zone: 25,614 – 25,669
🟥 Last Intraday Resistance: 25,756
🟩 Opening Support: 25,499
🟢 Last Intraday Support (Buyers’ Must-Try Zone): 25,335 – 25,379
❤️ Upside Extension: 25,862
🟢 Scenario 1: Gap-Up Opening (100+ points above previous close)
If Nifty opens around or above 25,670, it will directly test the Opening Resistance Zone (25,614 – 25,669). Here, traders should observe how the market reacts — a rejection with long upper wicks or high volatility candles could indicate distribution.
For bullish continuation, Nifty must sustain above 25,669 with a decisive 15-min candle close. A breakout can invite fresh momentum, pushing the index toward 25,756 and possibly extending up to 25,862.
Failure to hold above 25,669 may trigger a quick pullback to 25,614 or even back to the Opening Support at 25,499, where intraday buyers might reattempt to defend.
📘 Educational Note: Gap-up openings are often emotional reactions to overnight cues. Let the market confirm strength before chasing momentum. Look for stability above key resistance levels before taking directional calls.
🟠 Scenario 2: Flat Opening (±50 points around 25,585)
A flat open near the current zone (25,560–25,600) keeps Nifty in a balancing phase between bulls and bears. This range can act as a decision-making area for the day.
Sustained price action above 25,614 will likely attract buying interest, taking prices toward 25,669 – 25,756 levels.
On the downside, if Nifty slips below 25,499, selling pressure can intensify, dragging the index toward 25,379, which is the “Buyers’ Must-Try Zone.”
📘 Educational Note: Flat openings provide the cleanest opportunities for structured intraday setups. Patience during the first 30 minutes helps identify whether smart money is accumulating (bullish bias) or distributing (bearish bias).
🔴 Scenario 3: Gap-Down Opening (100+ points below previous close)
A gap-down below 25,500 directly places the index near the Opening Support or Last Intraday Support zone (25,335 – 25,379).
Watch this area carefully — if buyers fail to defend, weakness can extend further. However, a strong reversal candle or volume divergence could trigger short-covering opportunities.
Recovery back above 25,499 would indicate that buyers are attempting to regain control. In that case, a bounce toward 25,614 may unfold, where traders can re-evaluate the next move.
📘 Educational Note: Gap-downs often start with fear-driven selling. Smart traders wait for confirmation candles before entering, as the first impulse frequently fades when institutional players absorb liquidity at lower levels.
💡 Risk Management Tips for Options Traders
Define your maximum risk per trade (1–2% of capital) before entry.
Use hourly candle close-based stop losses to avoid false triggers from volatility spikes.
Avoid buying far OTM options post 11:00 AM; time decay accelerates rapidly.
If volatility (IV) is elevated, consider vertical spreads instead of naked calls or puts.
Always plan both entry and exit before executing — emotions should not decide your stop loss.
📊 Summary & Conclusion:
Above 25,669 → Bullish momentum possible toward 25,756 – 25,862.
Between 25,499 – 25,614 → Neutral consolidation; intraday reactions will decide direction.
Below 25,499 → Weakness likely toward 25,379 and 25,335 zones.
In summary, 05-Nov-2025 looks like a crucial reaction day — buyers must defend supports, while sellers may try to push the market lower. The best approach is to stay patient for the first half-hour, identify structure, and trade based on confirmation, not assumptions.
⚠️ Disclaimer:
I am not a SEBI-registered analyst . The analysis above is purely for educational and informational purposes. Traders are advised to do their own research or consult a certified financial advisor before making any trading decisions.
Mahindra & Mahindra's Inverse Head & Shoulders BreakoutMahindra & Mahindra's Inverse Head & Shoulders Breakout Signals Bullish Momentum with RSI Above 70
Mahindra & Mahindra Ltd. (M&M), currently trading around ₹3,648, is exhibiting a classic inverse head and shoulders pattern on its hourly chart—a bullish reversal setup that often precedes upward price movement. Coupled with a Relative Strength Index (RSI) reading above 70, the stock is showing signs of strong momentum, though traders must tread with technical precision.
With the inverse head and shoulders pattern completing and RSI above 70, Mahindra & Mahindra is technically poised for a bullish move. Traders should monitor price action closely, use disciplined stop-losses, and avoid over-leveraging. This setup favors momentum traders and short-term swing positions, especially if volume confirms the breakout.

NIFTY KEY LEVELS FOR 06.11.2025NIFTY KEY LEVELS FOR 06.11.2025
Timeframe: 3 Minutes
If the candle stays above the pivot point, it is considered a bullish bias; if it remains below, it indicates a bearish bias. Price may reverse near Resistance 1 or Support 1. If it moves further, the next potential reversal zone is near Resistance 2 or Support 2. If these levels are also broken, we can expect the trend.
When a support or resistance level is broken, it often reverses its role; a broken resistance becomes the new support, and a broken support becomes the new resistance.
If the range(R2-S2) is narrow, the market may become volatile or trend strongly. If the range is wide, the market is more likely to remain sideways
please like and share my idea if you find it helpful
📢 Disclaimer
I am not a SEBI-registered financial adviser.
The information, views, and ideas shared here are purely for educational and informational purposes only. They are not intended as investment advice or a recommendation to buy, sell, or hold any financial instruments.
Please consult with your SEBI-registered financial advisor before making any trading or investment decisions.
Trading and investing in the stock market involves risk, and you should do your own research and analysis. You are solely responsible for any decisions made based on this research.
#NIFTY Intraday Support and Resistance Levels - 06/11/2025Nifty is expected to open with a gap up near the 25,750 zone, showing early signs of recovery after a recent decline. The opening above the immediate resistance area indicates potential buying interest, but sustained momentum will be key to confirming a reversal.
If Nifty holds above 25,750–25,780, it may extend its move toward 25,850, 25,900, and 25,950+. A breakout above 25,950 could trigger further upside toward 26,000–26,050, strengthening the short-term bullish bias.
On the downside, initial support lies near 25,700–25,650. A failure to sustain above this zone could lead to renewed selling pressure toward 25,600, 25,550, and 25,500, which remains a crucial support level for the day.
Overall, with a gap up opening near 25,750, sentiment is expected to remain mildly positive as long as the index sustains above 25,700. Traders should monitor price action near the 25,900 zone for potential resistance and use a trailing stop loss to protect profits in case of volatility.

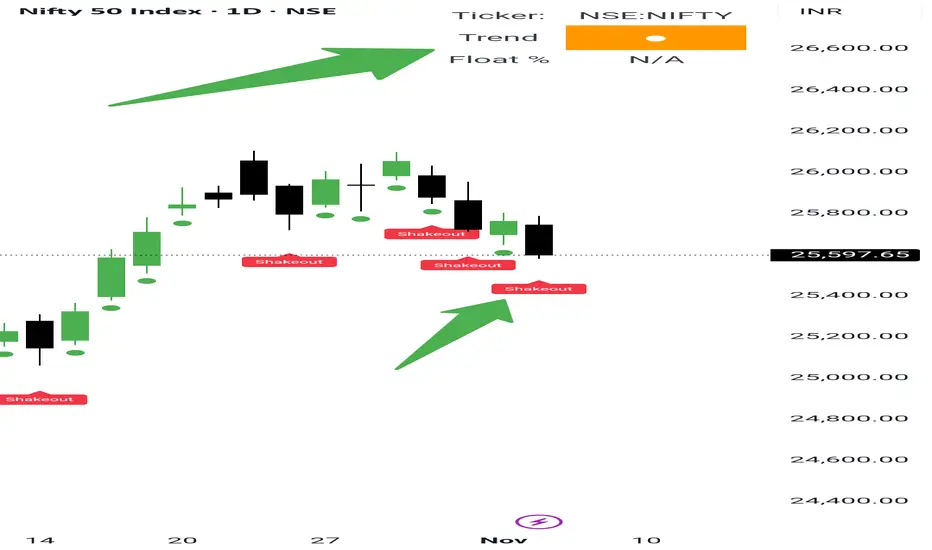
Bulls accumulating with Shakeouts in index! Stay sharp. NSE:NIFTY has now closed below our support level of 25666, exactly as we discussed over the last few days.
You guys were already warned back on October 24 that Nifty’s health was turning “Orange”, so if still your portfolio is showing losses, it’s time to take learning seriously. First you learn, then you earn.
Also remember, when the overall market environment turns weak, your intraday and momentum stocks won’t work the same way they usually do. It’s okay. It’s normal.
We might need to wait through this week. From next week, conditions should start improving as the monthly breadth continues to get stronger.
Yesterday, #Nifty gave a big red candle, but it was just a shakeout within the ongoing uptrend. The overall market health is still orange and hasn’t turned red yet.
Now, Nifty’s Pivot has slipped slightly lower to 25654. This will act as intraday resistance for tomorrow. Once this level breaks, we could see sharp short covering.
Remember — this is just a shakeout within a normal pullback, and bulls are still accumulating quietly.
The next key support is at 25550. If that breaks too, 25350 would be the next target. However, that’s less likely since the broader trend remains bullish. But still, market is market — so stay alert.
Short-term traders should keep an eye on #Defence, #Finance, and #Auto_Ancillaries sectors.
Long-term investors should study #Infra, #Metals, #NewAgeTech, and #ShipBuilding sectors — including their proxy plays.
This is a good time to accumulate quality stocks with a TechnoFunda approach. Focus on companies showing strong sales growth, rising earnings, improving EPS, and high accumulation on technical charts.
📊Levels at a glance:
Pivot: 25654 (Intraday resistance)
Support: 25550 / 25350
Market Health: Orange (cautious accumulation phase)
Bias: Bullish long term, short-term shakeout ongoing
Sectors for short term: Defence, Finance, Auto Ancillaries
Sectors for long term: Infra, Metals, New Age Tech, Ship Building
Strategy: Accumulate quality stocks with strong TechnoFunda setup
That’s all for the day. Take care and have a profitable tomorrow.
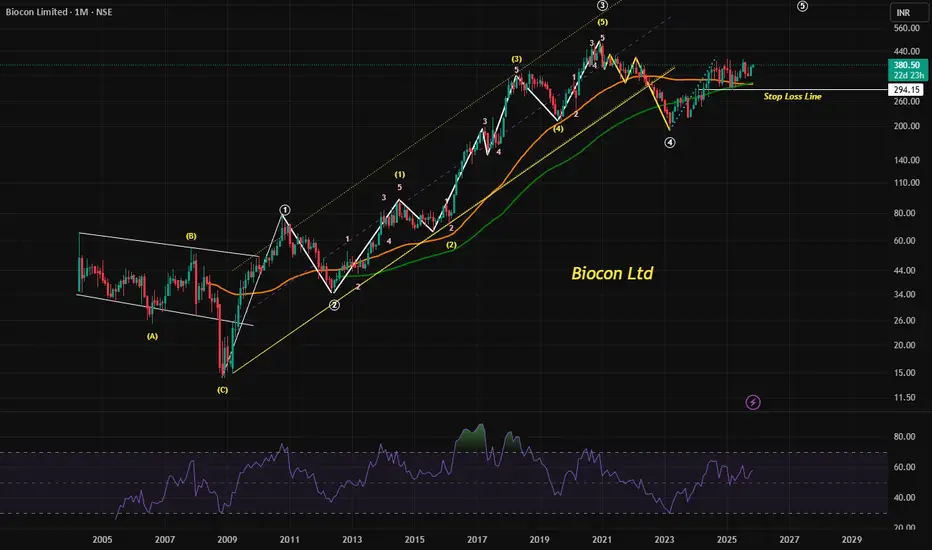
Understanding Biocon’s Bullish Setup Through Elliott Wave & RSIBiocon Limited is showing signs of a long-term bullish trend, supported by Elliott Wave theory and RSI strength above 50. Its current price action above key moving averages reinforces the momentum.
📈 Understanding Biocon’s Bullish Setup Through Elliott Wave and RSI
Biocon Limited, a prominent player in the biotechnology sector, is currently trading around ₹380.50. Technical analysis suggests that the stock is in the midst of a long-term bullish cycle, potentially targeting levels above ₹720. This projection is grounded in the principles of Elliott Wave Theory and supported by the Relative Strength Index (RSI) and moving average trends.
🔹 Elliott Wave Theory: Mapping Market Psychology
Elliott Wave Theory is a powerful tool used to analyze market cycles and investor psychology. It posits that prices move in repetitive wave patterns—five waves in the direction of the main trend followed by three corrective waves.
Wave 1 to 5: These represent the primary trend. In Biocon’s case, the current movement appears to be in the midst of this five-wave structure.
Wave 3 is typically the strongest and longest, often driven by fundamental catalysts and broad market participation.
Wave 5, which Biocon is believed to be entering or progressing through, often reflects the final push of bullish sentiment before a correction.
Given the current price and technical setup, the projection toward ₹720+ aligns with the completion of this five-wave pattern.
🔹 RSI: Momentum Confirmation
The Relative Strength Index (RSI) is a momentum oscillator that measures the speed and change of price movements. A reading above 50 typically indicates bullish momentum.
Since early 2024, Biocon’s RSI has consistently remained above the 50 mark, suggesting sustained buying interest and upward momentum.
This RSI behavior supports the Elliott Wave interpretation, reinforcing the idea that the stock is in a strong uptrend.
🔹 Moving Averages: Trend Validation
Moving averages help smooth out price data and confirm trends. Biocon’s price currently trades above both its:
50-day moving average (DMA): Indicates short- to mid-term bullishness.
100-day moving average (DMA): Suggests longer-term strength and investor confidence.
Trading above these key levels often acts as a support zone, reducing downside risk and attracting trend-following investors.
📊 Conclusion: A Technically Sound Rally
Biocon’s current technical landscape paints a compelling picture for long-term investors and swing traders:
The Elliott Wave structure suggests a continued rally toward ₹720+.
The RSI above 50 confirms bullish momentum.
Trading above 50 DMA and 100 DMA validates the trend.
While technical analysis offers valuable insights, investors should also consider fundamental developments and broader market conditions before making decisions.
City Union Bank: A Textbook Breakout After Years of ConsolidatioCity Union Bank has recently delivered a compelling technical setup that offers a classic case study in breakout trading. After years of sideways movement, the stock has finally breached a long-standing resistance level, signaling potential for a sustained uptrend.
🕰️ Multi-Year Consolidation and Breakout
Historical Resistance Breached: The stock closed above its January 2020 high yesterday, marking a significant breakout on a closing basis.
Consolidation Phase: From March 2020 to June 2025, the stock remained range-bound, forming a prolonged base. Such extended consolidations often precede powerful moves when broken.
Breakout Confirmation: The recent price action above the consolidation range confirms a major breakout, suggesting a shift in market sentiment and potential for trend continuation.
💪 Strength in Price Action
Sustained Above Key Moving Averages: The stock is trading well above its 50-day and 100-day moving averages. This alignment of short- and medium-term trend indicators reflects underlying strength and bullish momentum.
Momentum Building: The Relative Strength Index (RSI) has moved above 50 and is now attempting to cross 70, a zone often associated with strong bullish momentum. This supports the breakout narrative and indicates increasing buying pressure.
📚 Educational Takeaways
This setup offers several lessons for traders and investors:
Breakouts from Long Consolidations: When a stock breaks out after years of consolidation, it often leads to sustained moves due to pent-up demand and re-rating by market participants.
Closing Basis Matters: A breakout confirmed on a closing basis adds credibility, reducing the risk of false breakouts.
Moving Averages as Support: Trading above key moving averages reinforces trend strength and can act as dynamic support levels.
RSI as a Momentum Gauge: RSI crossing above 70 during a breakout can validate the strength of the move, especially when aligned with price and volume action.
🔍 Final Thoughts
City Union Bank’s recent breakout is a textbook example of how patience during consolidation can pay off. With price action confirming strength and momentum indicators aligning, this setup could serve as a valuable reference for traders studying breakout strategies.

Punjab National Bank: A Technical Setup Worth WatchingPunjab National Bank is trading at ₹122.80 and nearing a test of its long-term downtrend line on the monthly chart. With RSI climbing back above 60, the stock is showing signs of renewed bullish momentum.
Punjab National Bank (PNB), one of India’s leading public sector banks, is currently presenting an intriguing technical setup that could serve as a valuable case study for traders and investors. As of early November 2025, the stock is trading around ₹122.80 and is approaching a critical juncture on its monthly line chart—a potential test of its long-term downtrend line.
🔹 The Downtrend Line: A Barrier to Watch
In technical analysis, a downtrend line connects a series of lower highs and acts as a dynamic resistance level. When a stock approaches this line, it often faces selling pressure. However, if the stock manages to break above and sustain beyond this line, it signals a potential reversal in trend—from bearish to bullish.
PNB’s current price action suggests it is close to challenging this long-term resistance, which has historically capped upward movement. A successful breakout would not only mark a technical victory but could also shift investor sentiment in favor of the stock.
🔹 RSI Momentum: Strength Rebuilding
The Relative Strength Index (RSI) is a momentum indicator that helps gauge the strength of price movements. PNB’s RSI has already traded above 70 once, indicating strong bullish momentum in the recent past. Although it pulled back, it has now rebounded above 60, suggesting that buying interest is returning.
This RSI behavior is significant. A move above 50 typically signals bullish territory, and a climb toward 70 reflects increasing strength. In the context of a potential trendline breakout, this momentum could provide the necessary fuel for a sustained upward move.
🧠 Educational Insights
Trendline Tests on Higher Timeframes: Monthly charts offer a broader view of market sentiment. A breakout on this timeframe carries more weight than short-term fluctuations.
Momentum Confirmation: RSI above 60, especially after a prior move above 70, indicates that the stock is regaining strength. This supports the case for a breakout rather than a rejection.
Price-Action Focus: Watching how the stock behaves around the downtrend line—whether it consolidates, spikes, or pulls back—can offer clues about the next move.
📌 Learners Takeaway
Punjab National Bank’s current setup is a classic example of a stock approaching a technical inflection point. With the price near ₹122.80 and RSI showing renewed strength, traders should monitor the monthly chart closely. A confirmed breakout above the long-term downtrend line could signal a major trend reversal, offering potential upside for those positioned early.
Live chart Example to keep Track

Delhivery’s Technical Setup: A Case Study in Breakout MomentumDelhivery stock is trading at ₹485 and approaching a key resistance level of ₹488 on the weekly chart. A successful breakout above this level could signal a strong bullish continuation, especially with RSI trending toward 70.
Delhivery Ltd., a prominent logistics player in India, is currently showcasing a textbook example of a bullish technical setup. As of early November 2025, the stock is trading around ₹485, just shy of a crucial resistance level at ₹488 on the weekly chart. This moment presents a valuable learning opportunity for traders and investors seeking to understand breakout dynamics and trend reversals.
🔹 Breaking the Downtrend: June 2025
The first major technical milestone occurred in June 2025, when Delhivery successfully broke above its long-standing downtrend line. This line had previously acted as a ceiling, suppressing upward price movement. The breakout was not just a fleeting spike—it was followed by sustained trading above the trendline, confirming the shift in market sentiment from bearish to bullish.
🔹 Resistance at ₹488: The Next Barrier
Now, the stock is testing the ₹488 resistance level, a price point that has historically capped upward momentum. Resistance levels are critical in technical analysis because they represent zones where selling pressure tends to emerge. However, when a stock approaches such a level with strong momentum and supportive indicators, the probability of a breakout increases.
A weekly close above ₹488 would not only mark a successful resistance breakout but also reinforce the bullish reversal initiated in June. This could pave the way for a new upward leg in the stock’s trajectory.
🔹 RSI: Strength in Momentum
The Relative Strength Index (RSI) adds further weight to the bullish case. Currently, RSI is above 50, indicating positive momentum. More importantly, it is poised to cross above 70, a zone typically associated with strong bullish trends.
Unlike other indicators, RSI is a pure momentum gauge. When it moves from neutral (50) toward the overbought zone (70+), it reflects increasing buying interest. In the context of a resistance breakout, this RSI behavior suggests that the breakout could be supported by genuine strength, not just speculative spikes.
🧠 Educational Takeaways
Trendline Breakouts: A breakout above a long-term downtrend line signals a potential reversal in sentiment. Confirmation comes from sustained trading above the line.
Resistance Levels: These act as psychological and technical barriers. A breakout above resistance, especially on higher timeframes like weekly charts, is a strong bullish signal.
RSI Confirmation: RSI moving above 50 and approaching 70 adds credibility to the breakout. It shows that momentum is building, not fading.
📌 Conclusion
Delhivery’s current price action offers a compelling case study in breakout trading. With the stock trading at ₹485, just below the ₹488 resistance, and RSI showing bullish momentum, traders should watch closely. A confirmed breakout could validate the bullish reversal and open the door to higher price targets.
Live chart Study

NIFTY KEY LEVELS FOR 04.11.2025NIFTY KEY LEVELS FOR 04.11.2025
Timeframe: 3 Minutes
If the candle stays above the pivot point, it is considered a bullish bias; if it remains below, it indicates a bearish bias. Price may reverse near Resistance 1 or Support 1. If it moves further, the next potential reversal zone is near Resistance 2 or Support 2. If these levels are also broken, we can expect the trend.
When a support or resistance level is broken, it often reverses its role; a broken resistance becomes the new support, and a broken support becomes the new resistance.
If the range(R2-S2) is narrow, the market may become volatile or trend strongly. If the range is wide, the market is more likely to remain sideways
please like and share my idea if you find it helpful
📢 Disclaimer
I am not a SEBI-registered financial adviser.
The information, views, and ideas shared here are purely for educational and informational purposes only. They are not intended as investment advice or a recommendation to buy, sell, or hold any financial instruments.
Please consult with your SEBI-registered financial advisor before making any trading or investment decisions.
Trading and investing in the stock market involves risk, and you should do your own research and analysis. You are solely responsible for any decisions made based on this research.

#NIFTY Intraday Support and Resistance Levels - 04/11/2025Nifty is expected to open flat near the 25,750–25,780 zone, indicating a neutral start as the market looks for fresh cues after a consolidation phase. The index is currently holding near key support, suggesting that both buyers and sellers are waiting for a breakout from this range to take control.
If Nifty sustains above 25,800, it may trigger a short-covering rally toward 25,850, 25,900, and 25,950+ levels. A move beyond 25,950 could further strengthen momentum toward 26,000–26,050.
On the downside, immediate support lies near 25,700–25,650. A breakdown below 25,700 could lead to weakness toward 25,600, 25,550, and 25,500, where the next major support zone lies.
Overall, with a flat opening, Nifty is likely to remain range-bound between 25,700–25,900 in the early session. Traders should wait for a clear breakout or breakdown before initiating fresh positions and use strict stop losses in this narrow consolidation phase.
NIFTY : Trading levels and Plan for 04-Nov-2025🔹 NIFTY Trading Plan for 04-Nov-2025
(Based on psychological correction behavior and intraday structure)
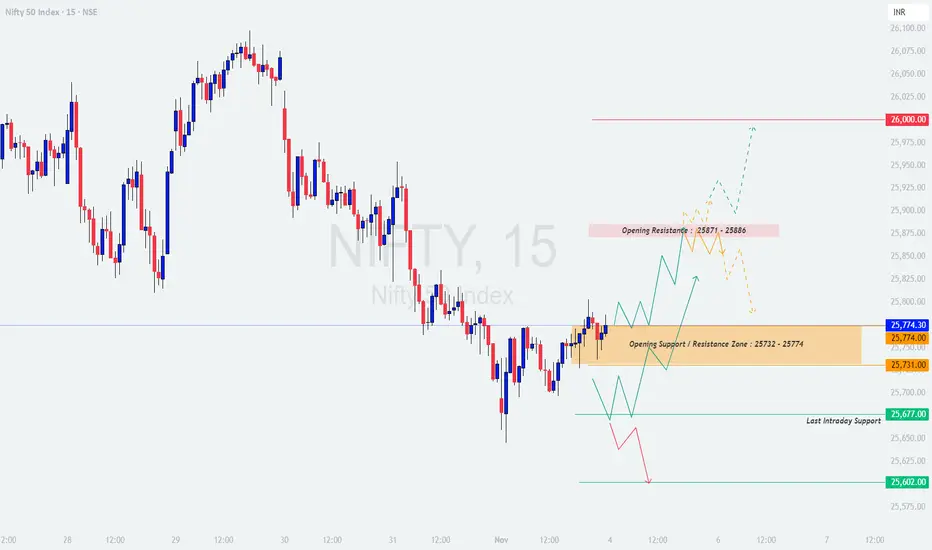
Chart Reference Levels:
🟧 Opening Support / Resistance Zone: 25,732 – 25,774
🟥 Opening Resistance: 25,871 – 25,886
🟩 Last Intraday Support: 25,677
🩵 Extended Support Zone: 25,602
❤️ Upside Psychological Target: 26,000
🟢 Scenario 1: Gap-Up Opening (100+ points above previous close)
If Nifty opens above 25,860, it enters near the Opening Resistance zone (25,871 – 25,886). Monitor how price behaves here — early candles showing rejection or long upper wicks could signal exhaustion and a potential pullback.
Only if Nifty sustains above 25,886 with strong momentum and closes a 15-minute candle above it, bulls could take control for a move towards the psychological mark of 26,000.
In case of a false breakout, prices could retrace back to the 25,774 zone, which may act as re-entry support for dip buyers.
📘 Educational Note: Gap-up days tend to trap retail traders who buy impulsively at the open. Always let the market prove its strength with a confirmed candle close before entering directional trades.
🟠 Scenario 2: Flat Opening (±50 points from previous close around 25,730)
Flat openings near 25,732 – 25,774 indicate equilibrium between bulls and bears. The first half-hour will decide whether this zone acts as support or resistance.
If Nifty sustains above 25,774, it can climb towards 25,871, where sellers might emerge again. Watch for a decisive breakout or rejection at that level.
A breakdown below 25,732 would expose the index to 25,677 (Last Intraday Support). Sustained weakness below that level could extend toward 25,602.
📘 Educational Note: Flat openings allow clear structure formation — ideal for observing whether large players are accumulating or distributing. Avoid rushing; let trend direction confirm itself.
🔴 Scenario 3: Gap-Down Opening (100+ points below previous close)
A gap-down below 25,650 brings price action directly near Last Intraday Support (25,677) or the Extended Support Zone (25,602). Watch closely for reversal candles or volume divergence in this region.
If Nifty fails to reclaim 25,677, it could extend weakness further, making 25,602 the next critical level where buyers may attempt to defend.
A recovery back above 25,732 after testing these supports may indicate a short-covering opportunity for intraday traders.
📘 Educational Note: Gap-downs are emotional openings. Avoid panic selling; instead, analyze whether the drop is driven by emotion or genuine momentum. Patience during the first 15–30 minutes often saves capital and improves entries.
💡 Tips for Risk Management in Options Trading
Never risk more than 1–2% of total trading capital per position.
Use hourly candle close-based stop-losses to minimize whipsaws in volatile moves.
Avoid chasing far OTM options post 11:00 AM — theta decay accelerates quickly.
If implied volatility (IV) is high, prefer spreads (Bull Call / Bear Put) over naked options.
Always pre-define your exit plan — entry is optional, exit is mandatory.
📊 Summary & Conclusion:
Above 25,886 → Bulls likely to extend toward 26,000.
Between 25,732 – 25,774 → Neutral consolidation zone; trade cautiously.
Below 25,677 → Bearish bias may continue toward 25,602.
In essence, 04-Nov-2025 could be a decision-making day for Nifty — either to confirm strength above the resistance band or to retest lower supports. Let the first 30 minutes establish the tone, then trade with discipline and risk control.
⚠️ Disclaimer:
I am not a SEBI-registered analyst . This analysis is shared purely for educational and informational purposes. Traders should conduct their own technical and psychological assessment or consult with a certified financial advisor before executing any trade.
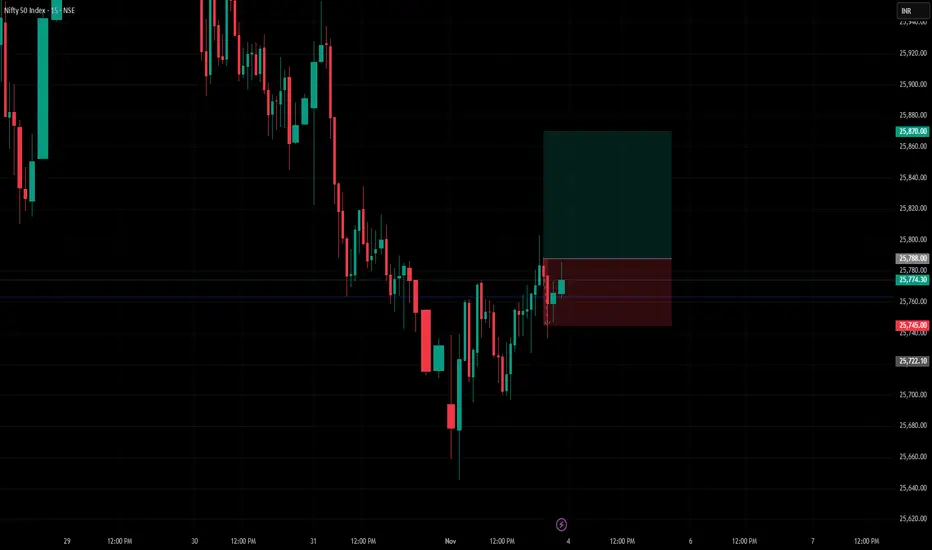
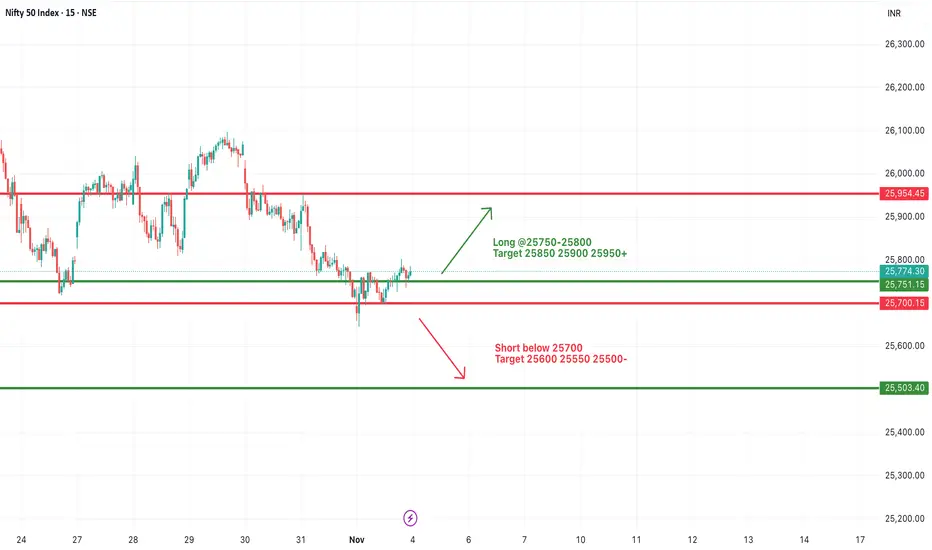
Nifty Intraday Long, Stop Loss and Target Levels markedExpecting bulls to be aggressive if nifty crosses strong above 25788 and the target will be 25870.
In case if nifty falls below 25745, then the bears will take the control.
Accordingly marked the chart with long, target and stop loss points