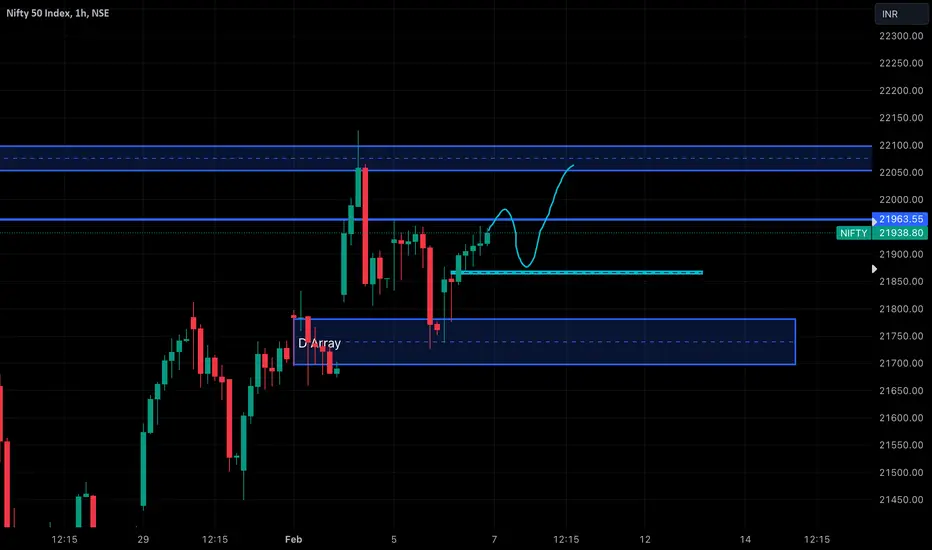
Nifty Intraday Trade Setup | 7th FebToday Nifty opened with a gap up around 21830 and after consolidating it gave a breakout above 21850 which was also out buy level and Nifty gave a rally towards 21950. Yesterday we also posted an idea about a Fall around 10:00 am and we saw 70 - 75 points sharp decline from 21850 levels.
For tomorrow, if Nifty sustains above 22000, we expect to see 22040 and upper marked levels. On the other side, if Nifty breaks 21850 on the downside, we may see 21800 and below marked levels on the chart.
Expectations: Volatile Day
Intraday Levels:
Buy Above - 22000
Sell Below - 21850
To motivate us, Please like the idea If you agree with the analysis.
Happy Trading!
InvestPro India
Niftyview

#Nifty directions and levels for FEB 7."Good morning, friends! Here are the directions for February 7th: The global market sentiment is moderately bullish, supported by the Dow Jones, while our local market sentiment shows a moderately bullish trend. It might open with a gap-up start, as indicated by Giftnifty showing a +110.
Nifty has a pullback structure as expected from the last session. So, there are no changes in the direction. If the market breaks the immediate resistance (22041), it may continue the rally further.
Alternatively, if it rejects at either 22041 or 22081, then we can expect a correction ranging from 38% to 61%. This also indicates a bullish sentiment, suggesting an initial range-bound market before the continuation of the rally.

NIFTY Market Analysis - 7 Feb 2024Good Morning all,
Today, I marked my support and resistance levels in NIFTY in 15 min timeframe. Hope this is helpful for you, Please like and follow.

NIFTY Intraday Trade Setup For 07 Feb 2024NIFTY Intraday Trade Setup For 07 Feb 2024
Bullish-Above 21970
Invalid- Below 21920
T- 22150 22350
Bearish-Below 21720
Invalid-Above 21770
T- 21525 21315
NIFTY has closed on a bullish note with 0.72% gain today. Nothing triggered as per trade setup today. It has revered yesterday's sentiment and chances are high that there can be bear trap above 21970 tomorrow. We will exit the short trade initiated below 21800. Best trade will be above 21970 on a flat opening for a fresh ATH. 21700 is now the last hourly swing low below which bearish price structure will be initiated.
Coming to Wednesday's trade setup, if index opens flat and a 15 Min candle closes above 21970 then we will long for the target of 22150 and 22350.
For selling we need a 15 Min candle close below 21720. T- 21525 and 21315.
In case of a big gap up/down, wait till 10 o'clock and mark the high and low of the trading range (5MIN). Trade on this range breakout.
==========
I am Not SEBI Registered
This is my personal analysis for my personal trading. Kindly consult your financial advisor before taking any actions based on this.

Price pushing higher despite monthly bearish look in NiftyThere is still a monthly fair value gap sitting at 21137.20, which I believe will be filled this month only. Now the current prices look bullish on the daily as well as hourly charts, meaning the prices might push higher towards the all-time high and then it might begin a down trend to reach the monthly fair value gap.
For tomorrow, if market opens Flat, I will be looking for shorts on a retracement to the hourly fair value gap and longs from that hourly fair value gap to the all-time high.
If market gaps up or gaps down, I will adjust my view according to how prices move in the first 15 minutes.
This is to imply that, I do not see a clear direction for tomorrow’s move right now.
Nifty levels - Feb 07, 2024Nifty support and resistance levels are valuable tools for making informed trading decisions, specifically when combined with the analysis of 5-minute timeframe candlesticks and VWAP. By closely monitoring these levels and observing the price movements within this timeframe, traders can enhance the accuracy of their entry and exit points. It is important to bear in mind that support and resistance levels are not fixed, and they can change over time as market conditions evolve.
The dashed lines on the chart indicate the reaction levels, serving as additional points of significance to consider. Furthermore, take note of the response at the levels of the High, Low, and Close values from the day prior.
We hope you find this information beneficial in your trading endeavors.
* If you found the idea appealing, kindly tap the Boost icon located at the bottom right. We encourage you to share your thoughts and comments regarding it.
Wishing you success in your trading activities!

#Nifty directions and levels for February 6th. #Nifty
Good morning, friends! Here are the directions for February 6th: The global market sentiment is moderately bullish, supported by the Dow Jones, while our local market sentiment shows a moderately bearish trend. It might open with a neutral to a slightly gap-up start, as indicated by Giftnifty showing a +20.
Nifty has had a reddish sentiment in the past two trading sessions. Even though it is reddish structurally, we can expect a rally continuation when it breaks the fib level 38%. This is because the previous wave count shows a proper 5-3 structure. If the market sustains the gap-up and breaks the fib level 38%, then we can expect further pullback continuation with minor consolidation.
Alternatively, if the gap-up doesn't sustain or opens with a gap-down, then we can expect correction continuation. It might not be in ABC structure; it might go in a 5-wave structure.

NIFTY Market Analysis - 6 FEB 2024Today, I marked my support and resistance levels in NIFTY Chart. Yesterday also, marked moved within my support and resistance levels. Check out my yesterday's level you will get to know.
I'm expecting a fall today. Let's see
If it's useful, please like and follow

NIFTY Intraday Trade Setup For 06 Feb 2024NIFTY Intraday Trade Setup For 06 Feb 2024
Bullish-Above 21970
Invalid-Below 21920
T- 22150
Bearish- Below 21720
Invalid-Above 21770
T- 21525 21315
NIFTY has closed on a bearish note with 0.38% cut today. In the we discussed in detail that index formed a bearish reversal candle at an important resistance level in daily TF. Below 21800 our short trade is triggered and our invalidation level is 22130. If our sl is triggered then above 22150 there will be a bullish move. We will trail sl after we get comfort move. Tomorrow once again on a flat opening below 21720 there will be a good sell off. Above 21970 there is a chance of a bullish move.
Coming to Tuesday's trade setup, if index opens flat and a 15 Min candle closes above 21970 then we will long for the target of 22150.
For selling we need a 15 Min candle close below 21720. T- 21525 and 21315.
In case of a big gap up/down, wait till 10 o'clock and mark the high and low of the trading range (5MIN). Trade on this range breakout.
==========
I am Not SEBI Registered
This is my personal analysis for my personal trading. Kindly consult your financial advisor before taking any actions based on this.

05 Feb ’24 — A Sharp Fall from the Support LevelNifty Analysis - Stance Neutral ➡️
Recap from yesterday: ”The buildup from 24th Jan to today is a Double bottom (W) pattern and a small bullish trendline. All of which leads to confusion on what gets the highest priority. We would like to continue with the neutral stance for Monday with a slight advantage to the bullish side.”
4mts chart
The 21913 support and resistance line was in play today and for most of the time, Nifty50 was trading above it. The start of the day was quite tricky though - we opened gap-up right at this SR level and then fell to the previous close. In the next 8 minutes, we are back above the SR line. Although the price action was flat, we felt the chances to break out were higher than a breakdown. But the reverse happened - from 14.03 to 14.43 Nifty lost a whopping 216pts ~ 0.99% and never recovered from that fall till close. This makes us wonder - what the reasons could be. Rumors broke out that RELIANCE may be interested in buying out the wallet business from PAYTM. Since PAYTM was in a lower circuit throughout the day, the results were felt on the RELIANCE stock. It started falling. But this is not contagious - why would the other stocks react to this?
63mts chart
The next support comes at 21491, which is quite a long distance. The chart pattern is not at all bearish, in fact, it is more bullish than bearish. But we all know for an upward move, the resistance has to be knocked out whereas the support has to be breached for a downward move. For tomorrow, we wish to maintain our neutral stance and wait for some directional clues to appear.

NIFTY ASC triangle bullish breakout Ascending Triangle Bullish Breakout
Be a conservative trader in the lower time frame of 15 mins, wait for the level breakout, and close and our entry should be above the previous candle high.
use this spot chart and do positional option buying or future buying.
Entry Above: 17980
Stop Loss: 17700
Target: 18380

NIFTY prediction for tomorrow 6th FEB 24As we discussed yesterday, NIFTY made a bearish movement after 2 pm with a nice volume.
If we look at the chart data:
Price has broken the pattern to the downside, now trading at 200 EMA. RSI has already gone below 40. Price is trading below EMA(13,50). Today, the selling volume was quite high.
If we look at the OI data:
PCR = 0.72, which shows a neutral structure because the price is at 200 EMA. 21700 is having nice PE writing, which is going to provide a nice support zone. On the upside, 21900 has significantly high CE writing, which will provide strong resistance.
I am expecting the market to fall in upcoming sessions:
Reasons:
The market has already given a breakout to the downside. (Bearish)
price < EMAs shows a bearish market structure. Currently trading at 200 EMA if breaks to downside path is clear till 21500. (Bearish)
RSI < 40, which shows bulls are weak right now. (Bearish)
price < VWAP shows a bearish sentiment in the market. (Bearish)
OI data shows PCR = 0.72, which shows the market has a neutral structure. A little push to the downside can ignite a strong bearish move. (Bearish)
Verdict:
Bearish
Plan of action:
Sell 21800 CE (hedge it with 15rs CE)

Nifty levels - Feb 06, 2024Nifty support and resistance levels are valuable tools for making informed trading decisions, specifically when combined with the analysis of 5-minute timeframe candlesticks and VWAP. By closely monitoring these levels and observing the price movements within this timeframe, traders can enhance the accuracy of their entry and exit points. It is important to bear in mind that support and resistance levels are not fixed, and they can change over time as market conditions evolve.
The dashed lines on the chart indicate the reaction levels, serving as additional points of significance to consider. Furthermore, take note of the response at the levels of the High, Low, and Close values from the day prior.
We hope you find this information beneficial in your trading endeavors.
* If you found the idea appealing, kindly tap the Boost icon located at the bottom right. We encourage you to share your thoughts and comments regarding it.
Wishing you success in your trading activities!

NIFTY Pre-Market Analysis - 5 Feb 2024Today, I marked my support and resistance levels in NIFTY. I'll be trading based on these levels.
I'm planning to publish post-market chart as well. Kindly check that as well. If you think it's useful, please like and follow

nifty view for tomorrow..Trade plan for tomorrow:
If there's a gap down tomorrow or it breaks Friday's low of 21800, then the next targets would be 21650 and 21450. If it opens with a gap up or opens flat, then it might move within Friday's range only.

NIFTY Intraday Trade Setup For 05 Feb 2024NIFTY Intraday Trade Setup For 05 Feb 2024
Bullish-Above 22150
Invalid-Below 22100
T- 22350
Bearish-Below 21800
Invalid-Above 21850
T- 21550 21340
NIFTY has closed on a bullish note with 2.35% gain last week. On Friday also it closed with 0.72% gain but created a bearish sentiment as there was a huge sell off from ATH. 22150 is a strong resistance in daily TF, it formed a shooting star on Friday. Below its low 21800 a good fall can be expected in the coming days. After this shooting star is triggered 22130 will be invalidation level. And above 22150 next leg of rally will come.
Coming to Monday's trade setup, if index opens flat and a 15 Min candle closes above 22150 then we will long for the target of 22350.
For selling we need a 15 Min candle close below 21800. T- 21550 and 21340.
In case of a big gap up/down, wait till 10 o'clock and mark the high and low of the trading range (5MIN). Trade on this range breakout.
==========
I am Not SEBI Registered
This is my personal analysis for my personal trading. Kindly consult your financial advisor before taking any actions based on this.

WHERE WILL NIFTY GO ? UPDATED LEVELSNIFTY
cmp 20937
I have suggested Positional Longs near 18840.....
and recently near 19850
Enjoyed Bull Run From 18840---->20960++
More than 2100 points Done
Now as market is at ALL TIME HIGH we need to update our Levels
So,
RESISTANCE WOULD BE 20970 / 21080 / 21180
SUPPORT WOULD BE 20750 / 20600 / 20500
Regards..
Harm⭕nics4Life
06/12/2023
Disclaimer & Risk Warning
I am not sebi registered analyst.
My studies shared here are for educational purposes .. Do Consult Your Financial advisor Before Taking any Trade.....Good Luck!

CNXIT | ITBEESDisclaimer: This analysis is solely for educational purposes and does not make me a SEBI registered analyst.
If you found this analysis helpful, I encourage you to like and share it. Your observations and comments are also welcomed below. Your support, likes, follows, and comments motivate me to consistently share valuable insights with you.
🔍 More Analysis & Trade Setups 🔍
For more technical analysis and trade setups, make sure to follow me on TradingView: www.tradingview.com

NIFTY prediction for tomorrow 05 FEB 24As we discussed in our analysis & on YouTube , it reached the target and then fell.
You can also find the analysis on youtube channel link in Bio.
Now if we look at the chart:
the market is in a rectangular uptrend pattern and is now at the lower support line. Looking at the selling pressure volume in the last session, it was a strong fall from ATH. Now, if it breaks down, it will be going at 200 EMA.
Looking at the OI data:
PCR = 0.85, which indicates bullish. also next week PCR = 1.0 shows bullishness. the market is leaning towards bulls unless it breaks to the downside of the channel. Upside 22000 is a really strong resistance level. On the downside, the next good support level is at 21500.
FII & DII indicate a neutral signal.
Now I am expecting market to be either sideways(inside channel) OR bearish (if breaks to downside.)
Reasons:
Price ~ EMA(13,50) shows mild bullish.
RSI ~ 40-60 shows a sideways Market.
market is forming HH & HL. Unless the market forms a lower low, the bearish trend is not confirmed. (Neutral -> because of sharp fall from ATH)
OI data PCR = 0.85 shows mild bullishness. 21800 seems decent support, but on the upper side, 22,000 is strong resistance.
verdict:
Sideways in channel AND bearish if breaks to the downside.
Plan of action:
Go bearish if it breaks to the downside; Target 200 EMA.

Ready For Breakout After 14 years...Jindal Steel & Power Ltd is one of the India's leading steel producers with significant presence in sectors like mining and power generation. The group has global presence through subsidiaries, mainly in Australia, Botswana, Indonesia, Mauritius, Mozambique, Madagascar, Namibia, South Africa, Tanzania and Zambia.

MSUMI ready for next target..MSWIL is a JV with Sumitomo Wiring Systems, Ltd., a global leader in the manufacture of wiring harnesses, harness components, and other electric wires.

NBCC target achieved...buy ON DipNBCC ..buy on dip
operates in three major segments - Project Management Consultancy, Engineering Procurement & Construction, and Real Estate.

Nifty levels - Feb 05, 2024Nifty support and resistance levels are valuable tools for making informed trading decisions, specifically when combined with the analysis of 5-minute timeframe candlesticks and VWAP. By closely monitoring these levels and observing the price movements within this timeframe, traders can enhance the accuracy of their entry and exit points. It is important to bear in mind that support and resistance levels are not fixed, and they can change over time as market conditions evolve.
The dashed lines on the chart indicate the reaction levels, serving as additional points of significance to consider. Furthermore, take note of the response at the levels of the High, Low, and Close values from the day prior.
We hope you find this information beneficial in your trading endeavors.
* If you found the idea appealing, kindly tap the Boost icon located at the bottom right. We encourage you to share your thoughts and comments regarding it.
Wishing you success in your trading activities!
