ADANI POWER: Cup & Handle Breakout Setup | Upside TargetsADANI POWER is currently forming a well-structured Cup & Handle pattern on the higher timeframe, indicating a potential bullish continuation.
The stock has respected the rounded base formation and is now consolidating in the handle zone near a key resistance around 179. A sustained breakout with strong volume above this level can confirm the pattern and open the gates for a fresh upside move.
Technical Highlights:
📈 Pattern: Cup & Handle (Bullish Continuation)
🔑 Breakout Level: 179–180 (Strong resistance zone)
🎯 Target 1: 230
🎯 Target 2: 272
🛑 Invalidation: Sustained close below handle low
Trade Insight:
Aggressive traders can look for entries on a confirmed breakout.
Conservative traders may wait for a retest of the breakout zone.
Volume expansion will be a key confirmation factor.
⚠️ Disclaimer: This analysis is for educational purposes only. Please manage risk and trade according to your own strategy.
Nse

Take Liquidity or Become Liquidity In this video I am talking about a Solid concept / strategy know as Liquidity .
General trends of the markets in terms of index are discussed in this videos and no bias or directions are given

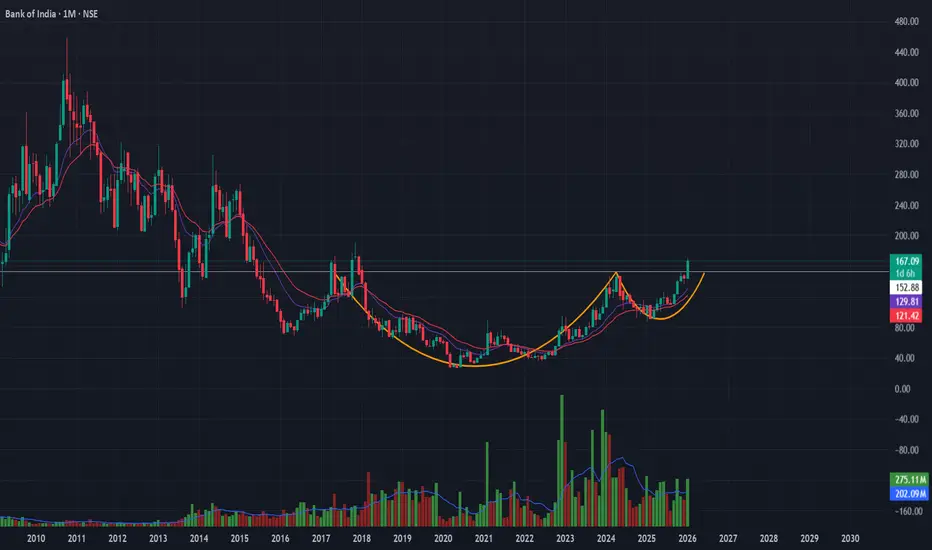
Bank of India | Cup & Handle Breakout SetupStructure:
Long-term Cup & Handle pattern nearing completion on monthly timeframe, indicating accumulation after a prolonged base.
Confirmation Signals:
-Volume expanding on rallies
-RSI above 50 and rising
-OBV trending higher → accumulation visible
-Price holding above short-term EMAs
Trade Plan:
-Buy: Sustained breakout above ₹151
-Targets: ₹199 → ₹268
-Stop-loss: ₹134 (ATR-based, structure-valid)
-Risk–Reward: ~1:5
Equitas Small Finance Bank – Swing Trade ViewPrice has broken out of a long-term falling channel, signaling a trend shift from bearish to bullish.
Post-breakout structure shows higher highs and higher lows, confirming strength.
Price has broken out of a long-term falling channel, signaling a trend shift from bearish to bullish.
Buy Zone :
₹66–₹67 on pullback to former resistance turned support
Or on daily close above ₹70 for continuation
Stop-Loss:
Below ₹65 (structure-based)
Targets:
T1: ₹73–₹75
T2: ₹78–₹80

Trade Setup: TITAN (Cash)📈 Trade Setup: TITAN (Cash)
Buy: ₹4005 (Current Market Price)
Stop Loss: ₹3980 (Daily closing basis)
Targets:
🎯 T1: ₹4090
🎯 T2: ₹4190
🔍 Technical Rationale
Price holding above short-term support zone
Higher-low structure intact on daily timeframe
Risk is well-defined (tight SL on closing basis)
Favorable risk–reward toward T1 & T2
⚠️ Risk Management
Exit only if daily candle closes below ₹3980
Partial profit can be booked near ₹4090
Trail stop loss once price sustains above ₹4090
🧠 Trade Type
Short-term swing trade
Time horizon: 3–10 trading sessions

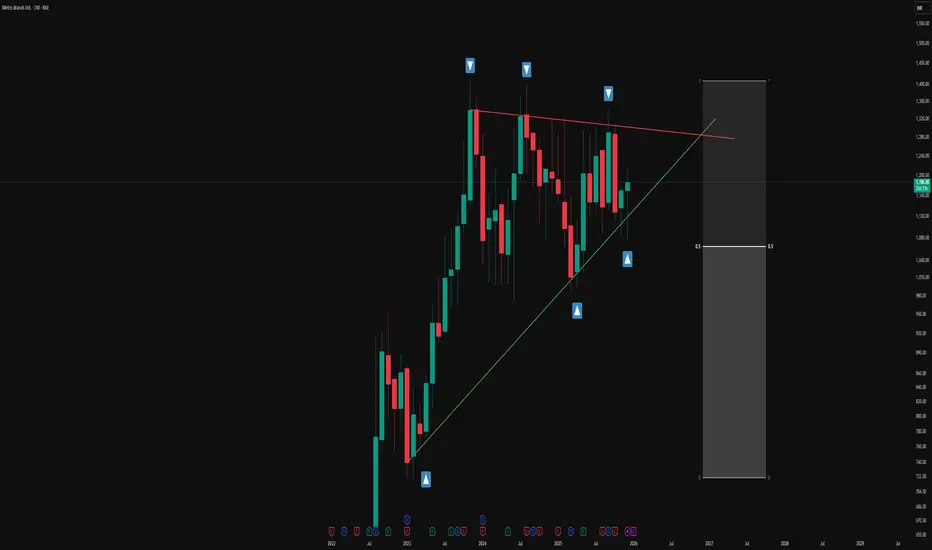
Simple Triangle Pattern on a Monthly Time FrameOverview -
This monthly chart illustrates a symmetrical triangle pattern defined by a series of higher lows and relatively stable swing highs, framed by a green ascending trendline and a red counter-trendline. The structure is presented in an observational manner to highlight how price has evolved within these converging boundaries over an extended period.
Triangle structure -
1.The green line represents the primary trendline, drawn from successive higher swing lows where price has repeatedly found support and turned back up. Each time price touches or approaches this green line, the contact is marked with a blue upward arrow box to emphasize how buyers have consistently responded around this rising level. Together, these points of contact visually document the stepping pattern of higher lows that contributes to the lower boundary of the triangle.
2.The red line acts as the counter-trendline, connecting multiple prominent swing highs where upward movement has stalled and reversed. Blue downward arrow boxes are placed at these touchpoints to highlight how price has respected this sloping resistance zone over time. The repeated interaction with the red line shows how sellers have been active around this upper boundary, creating a series of contained pushes to the upside.
Understanding -
The overall construction emphasizes how multiple touches on both the trendline (T) and counter-trendline (CT) are used to validate the presence of this symmetrical triangle. Rather than focusing on any single candle, the chart showcases the cumulative behaviour of price over many months, making it a useful visual example for studying how support and resistance can evolve into a geometric pattern on a higher time frame.
Disclaimer: This description is purely educational and observational, intended to explain chart structure and pattern formation. It does not constitute investment advice, trade recommendations, or any suggestion to buy, sell, or hold any financial instrument.
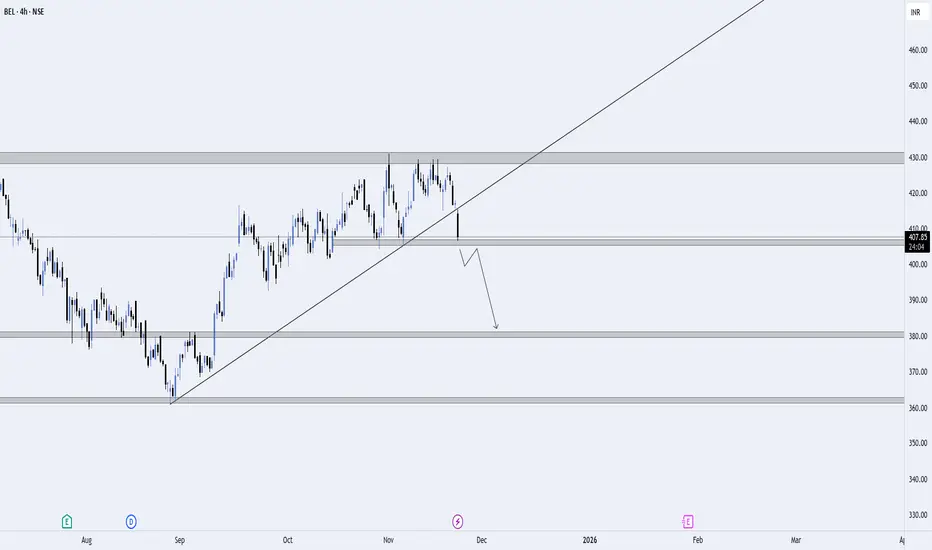
BEL – Trendline Breakdown & Supply Zone Rejection | Bearish SetuBEL has rejected strongly from the higher-timeframe supply zone around ₹425–₹430, followed by a clean trendline breakdown. This breakdown signals weakening bullish momentum and opens the door for a deeper correction.
📌 Key Highlights
Strong rejection from the major supply zone.
Clear trendline break, indicating a shift in structure.
Price currently hovering near ₹408–₹410 support.
Expecting a pullback before continuation.
🎯 Entry Plan (Breakdown + Retest)
🔽 Preferred Entry Model
1. Breakdown:
Price breaks below the minor structure at ₹406–₹408 with a strong bearish candle.
2. Retest:
Wait for price to pull back toward ₹408–₹410 (previous support → now resistance) OR a retest of the broken trendline.
3. Entry Trigger:
Enter short only after a bearish rejection (wick rejections / bearish engulfing / breakdown of retest low).
📍 Ideal Entry Zone:
₹400 – ₹403
🎯 Targets
TP1: ₹395
TP2: ₹382
Final Target (HTF Demand): ₹360 – ₹365
❌ Invalidation
Setup invalid if BEL reclaims ₹425 and sustains above the supply zone.
📈 Bias
Bearish as long as the price stays below the breakdown zone and the trendline.
TCS – Supply Zone + Channel Resistance | Short Idea (4H)Price has reached a major supply zone aligned with the upper channel resistance, creating a high-probability rejection zone.
The confluence of:
Horizontal resistance
Supply zone
Rising channel top
makes this area a strong rejection point.
🔵 Reason for Short Setup
Price is reacting at a previous rejection zone
Clear bearish wick activity near resistance
Channel structure shows exhaustion at the top
Risk:Reward remains favorable
🎯 Trade Plan
Entry: Around current rejection zone
Stop-Loss: Above supply zone + channel breakout
Target 1: Mid-channel
Target 2: Lower channel support
🔍 Market Structure
4H trend is still forming higher lows, but momentum weakens at resistance
If price closes above the blue zone, setup becomes invalid
Watching for confirmation candle (bearish engulfing / rejection wick)
⚠️ Invalidation
A strong 4H close above the blue resistance breaks the idea.
💬 Note
This is a pure price-action confluence setup. Will update once price reaches mid-channel target or shows breakdown signals.

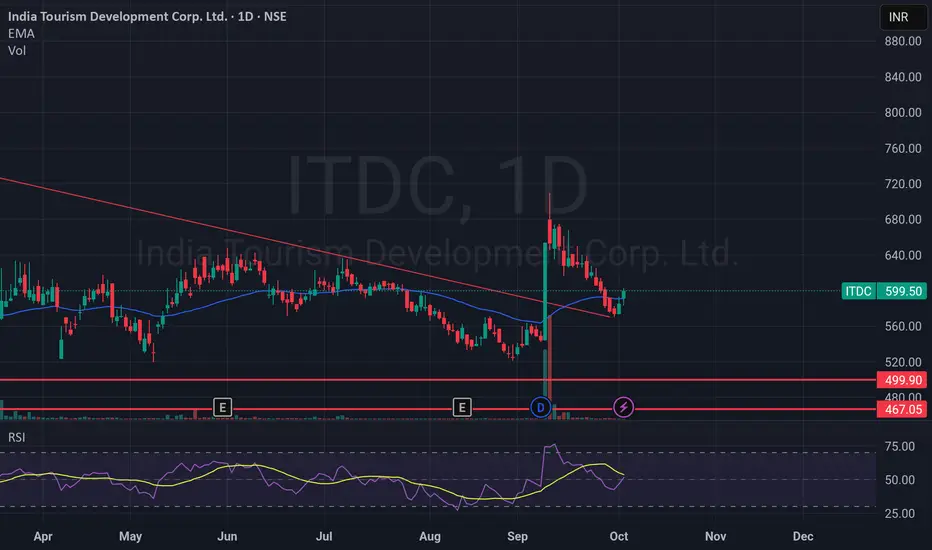
ITDC: Bullish Breakout Attempt After Strong UptrendChart & Instrument:** India Tourism Development Corp. Ltd. (ITDC) - NSE, 1D Timeframe
Analysis :
ITDC is exhibiting strength as it tests a key resistance level, poised for a potential continuation of its primary uptrend. Here's a breakdown of the technical picture:
Established Uptrend : The stock has been in a sustained uptrend since April 2025, rallying from a low of ₹467 to current levels near ₹600.
Bullish Momentum: price has closed at ₹599.50, comfortably above the key Exponential Moving Average (EMA) of ₹591.13, confirming near-term bullish momentum.
Neutral RSI: The RSI reading of ~53 is in neutral territory, indicating there is plenty of room for the stock to run before becoming overbought.
Key Resistance: The immediate and critical hurdle is the recent high of ₹603. A decisive break and close above this level are crucial for the next leg up.
Trade Idea & Prediction:
We anticipate a bullish breakout above the ₹603 resistance
Trigger: A confident break and daily close above ₹603.
Profit Target 1: ₹640 (Initial target based on previous swing highs).
Profit Target 2: ₹. 680 (Extended target, aligning with the upper boundary of the trend channel).
Stop Loss: ₹580 (A break below this key support level would invalidate the bullish setup and signal a short-term pullback).
Disclaimer :This is not financial advice. Always conduct your own research (DYOR) and manage your risk appropriately.
#ITDC #NSE #StockMarket #Trading #TechnicalAnalysis #Breakout #Investing
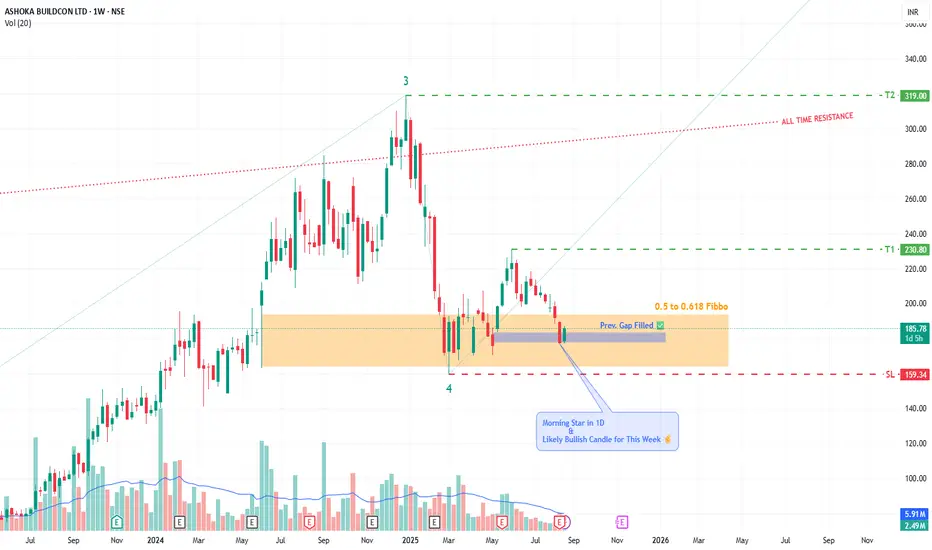
VIEW ON ASHOKA BUILDCON BY KRS CHARTSDate - 21st August 2025 / 10:35 AM
Why ASHOKA ?
1. All-time Bullish Stock technically making HHs & HLs.
2. Further, Price is already in Fibbo Golden Reversal Zone for quite a few times and showing bullish traits again.
3. I was eagerly waiting for to retrace down little bit for 1D previous gap-up needed to be filled it & it's Done!
4. 1D it is showing Morning Star Candle sticks Cluster s with more green Candles and this week likely to be closing with bullish candle stick.
5. Wave Theory wise we are in 4th Wave last upside 5th is loading.
All in All, this is good level to look ASHOKA as a good opportunity 👍✅
Targets and SL are Marked in Chart.
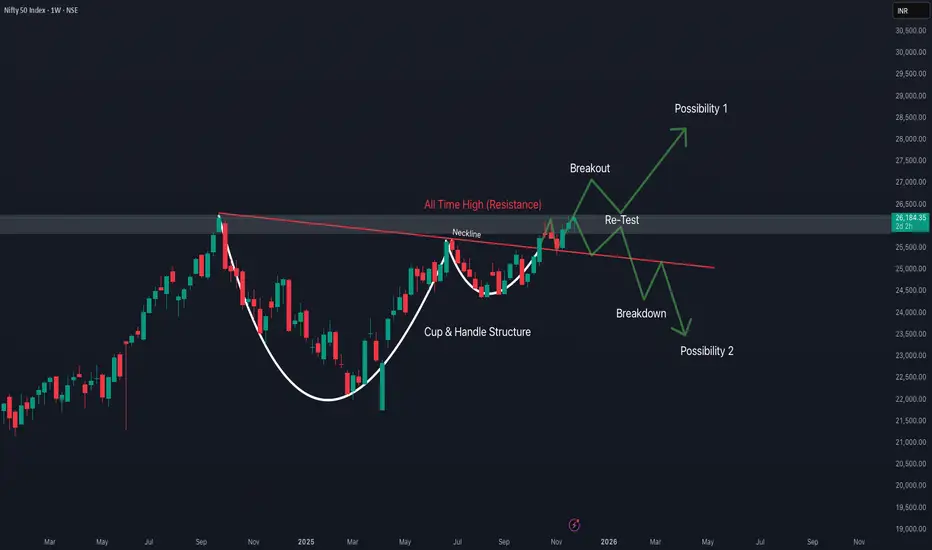
Weekly Price Action in Nifty 50The chart shows a classic Cup & Handle pattern
The cup is wide and smooth – a strong long-term accumulation pattern.
The handle is small, healthy, and formed near resistance → a sign of strength.
These patterns on the weekly chart typically lead to multi-month rallies.
The chart structure is strongly bullish unless Nifty falls below 25,500.
BANKNIFTY Looks Bearish Please check how banknifty is setting up bearish move for a month or after a month to come, it does not look bullish from here atleast and view gets invalid if banknifty closes above 60,000.
can look for short positions if your setup shows too !

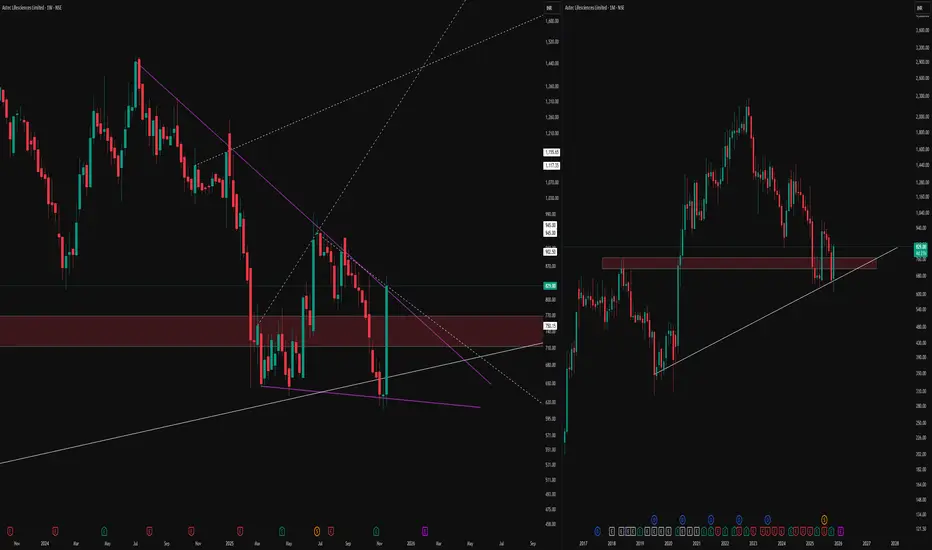
How to Observe Weekly and Monthly Chart StructureThe weekly (left) and monthly (right) timeframes, bringing attention to a confluence zone of technical interest.
On the weekly chart, price has developed a compressing pattern, defined by distinct purple lines, with dotted lines marking hidden channel boundaries and long-term levels for context. The highlighted supply-demand zone reflects previous market activity, where buyers and sellers actively shaped reversals and consolidations.
On the monthly timeframe, the same zone aligns with an established rising trendline support, indicating an area where price has historically responded with high volume and volatility. Multiple timeframe alignment and proximity to major horizontal structures
No forecasts or breakout signals are implied; the focus is on mapping price responses and monitoring structure, not predicting direction. Consistent observation of these overlapping technical factors may help traders build sound trading hypotheses in line with their individual strategies.
Mazdock : A Sleeping Giant Mazgaon Dock broke out of a very strong resistance after forming a base to form new life time high
Post that if you notice
1) volumes dropped
2) Price has fallen
3) There is an obvious invalidation of the breakout which took it to life time high
4) Classic Smart Money Liquidity Sweep
It has posted a healthy set of results in the last quarter and with defense spending ramping up this stock is going to perform extremely well.
It can 2X from here in a reasonably good amount of time.
Watch for a high volume Marubozu on the chart, any time now!

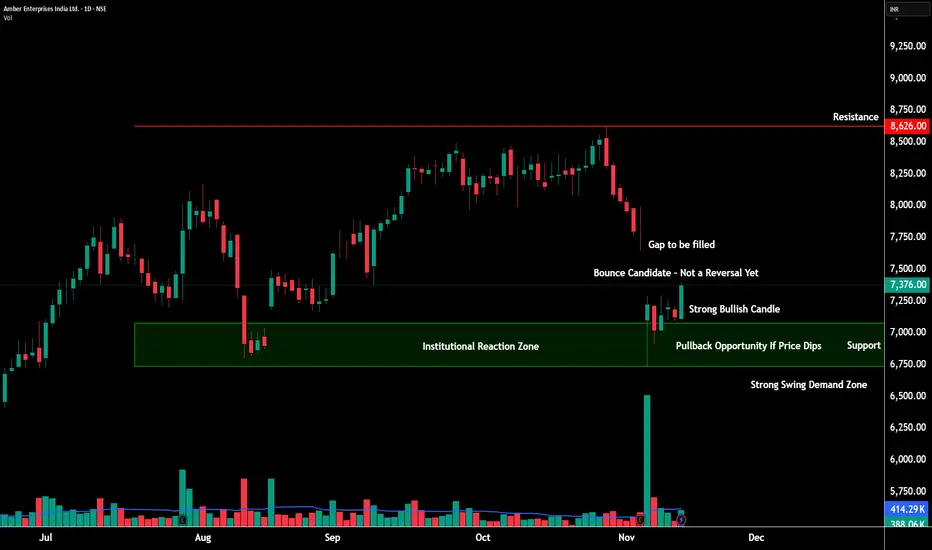
AMBER at a Critical Turning Point – Trend Shift or Just a Bounce💹 Amber Enterprises Ltd (NSE: AMBER)
Sector: Consumer Durables | CMP: 7376 | View: Early Reversal Attempt Inside Downtrend Structure
Chart Pattern: NA
Candlestick Pattern: Bullish Engulfing
📊 Price Action – What’s Really Happening?
Amber finally showed signs of life after a sharp slide from 8600 levels.
Buyers stepped in near 7180–7200, creating a clean intraday reversal base.
But — the larger trend is still down, so this bounce must prove itself above 7480–7536.
🧭 Support & Resistance
Resistances: 7484 | 7536 | 7592 | 7785
Supports: 7183 | 7090 | 6990 | 6882
Demand zones are strong → resistance zones are layered and heavy.
This is why confirmation matters.
📈 STWP Trading Analysis:
Bullish Breakout: 7400 | Stop Loss: 7180
A clean bounce developed from the swing demand zone after strong absorption of selling pressure. Despite this intraday strength, the daily chart remains in a downtrend with lower highs and lower lows. A possible close above 7480–7535 could shift bias to short-term bullish continuation. Below 7180, weakness can reappear quickly.
🧩 Final STWP Outlook
Momentum: Mild |Trend: Bearish | Risk: Moderate | Volume: Improving
⚠️ Disclosure & Disclaimer – Please Read Carefully
This content is strictly for educational and informational purposes.
It is not a buy/sell recommendation and should not be treated as investment advice.
I am not a SEBI-registered investment adviser.
Markets carry risk, and price can move unpredictably.
Always evaluate your risk, position size, and suitability before trading.
Consult a SEBI-registered adviser before making any financial decision.
Position Status: No active STWP position in AMBER at the time of analysis.
Data Source: TradingView & Market Data Snapshot.
💬 Found this breakdown useful?
🔼 Boost this post to help more traders learn structured analysis
✍️ Comment your views or setups — let’s grow together
🔁 Share it with traders who want clean, disciplined analysis
👉 Follow @STWP for more structured trade setups, zone-based insights, and disciplined trading approach.
🚀 Stay Calm. Stay Clean. Trade With Patience.
Trade Smart | Learn Zones | Be Self-Reliant 📊
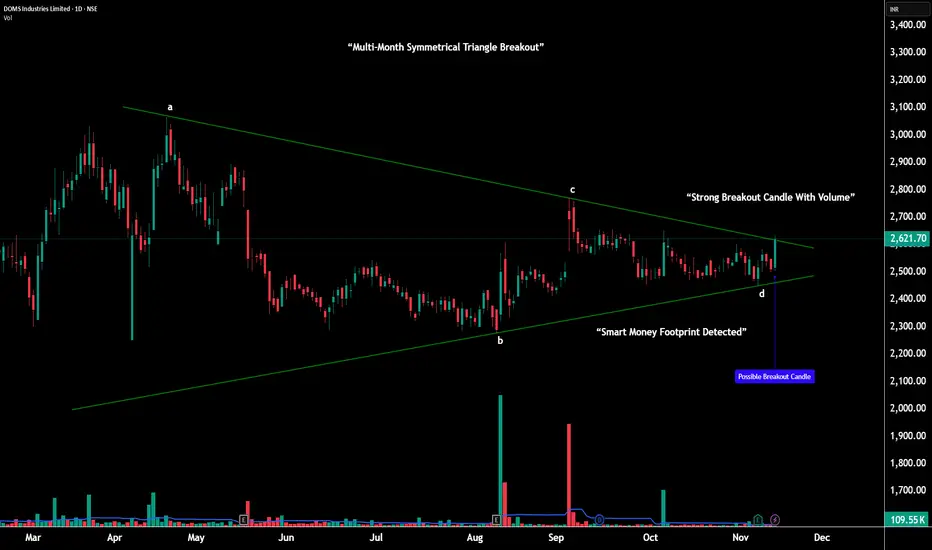
DOMS – Multi-Month Triangle Breakout |________________________________________
💹 DOMS Industries Ltd (NSE: DOMS)
Sector: Consumer & Stationery Products | CMP: 2621.70 |
View: Multi-Month Symmetrical Triangle Breakout With Expanding Momentum
________________________________________
📊 Price Action:
DOMS has spent the last five months forming a large symmetrical triangle — a volatility contraction structure marked by steady lower highs and higher lows from points A–B–C–D.
Throughout this period, buyers consistently defended the broader 2470–2500 demand belt, while sellers lost strength on every push lower.
This slow tightening shows how the market was preparing for a decisive move.
In the latest session, DOMS finally broke above the upper trendline, backed by a strong bullish range candle and a clear rise in volume, confirming the start of a fresh expansion phase.
________________________________________
📉 Chart Pattern Analysis – Large A–B–C–D Symmetrical Triangle:
This multi-month structure represents a major volatility compression following a previous uptrend — a classic continuation setup.
Point A: First major lower high
Point B: Deep anchor low
Point C: Lower high confirming supply weakening
Point D: Higher low showing demand strengthening
This clean A–B–C–D formation validates the symmetrical triangle perfectly.
As price approached the apex, volatility dried up, volume decreased, and the range narrowed — all ideal ingredients for a strong breakout.
The breakout candle now signals the end of compression and beginning of trend expansion.
________________________________________
📈 STWP Trading Analysis:
Bullish Breakout Zone: 2621.70 – 2633.20 | Stop Loss: 2498.60
The breakout candle shows high momentum and elevated volume, signaling institutional activity. Price has reclaimed all key moving averages with trend strength visible across 1H–1D–1W timeframes. As long as DOMS holds above the 2570–2590 structure zone, the bullish continuation bias remains active. Upside resistance levels can be used as potential levels of partial profit-taking, momentum checkpoints, and trend continuation targets.
________________________________________
🕯️ Candlestick Structure – Strong Bullish Breakout Candle:
The latest session printed a wide-range bullish candle, breaking through the upper triangle boundary decisively.
This type of candle — strong body, controlled wicks, clean range expansion — reflects conviction buying, not speculative spikes.
When this appears at the apex of a large compression pattern, it often marks the start of a new trending phase.
________________________________________
📏 Fibonacci Analysis:
Measured from swing low 2275.40 to swing high 2585.70:
38.2% @ 2393 → Secondary support
50% @ 2430 → Balanced support zone
61.8% @ 2467 → Strong golden zone (defended repeatedly)
The rebound from the 61.8% area aligns with the D-point of the triangle — reinforcing the structural validity and strengthening the breakout.
________________________________________
🧭 STWP Support & Resistance:
Resistances: 2667 | 2713 | 2794
Supports: 2540 | 2459 | 2413
The 2470–2500 region remains a major demand base, where the stock formed its higher lows at point D.
Immediate supply lies near 2667–2713, the first test zone after the breakout.
________________________________________
📊 STWP Volume & Technical Setup:
Volume climbed to 109.55K, significantly higher than recent averages — showing accumulation on the breakout.
RSI at 59 and Stochastic at 67 suggest healthy momentum with room for continuation.
MACD structure remains bullish, and multi-timeframe trend strength is intact.
Trend Direction: UPTREND | Volume Confirmation: Strong Buying Activity
________________________________________
🧩 STWP Summary View:
Momentum: Strong
Trend: Bullish
Risk: Moderate
Volume: High
DOMS has broken out of a large multi-month symmetrical triangle, a pattern known for initiating strong directional moves once volatility expands.
The structure remains bullish above 2570–2590, with continuation potential toward 2667 → 2713 → 2794 in the coming sessions.
________________________________________
⚠️ Disclosure & Disclaimer – Please Read Carefully
This analysis is for educational purposes only and should not be treated as investment advice.
I am not a SEBI-registered financial advisor.
Trading carries risk — use stop-loss, risk limits, and disciplined position sizing.
Please consult a SEBI-registered adviser before making trading decisions.
________________________________________
Position Status: No active position in (DOMS) at the time of this analysis.
Data Source: TradingView & NSE India
________________________________________
💬 Found this useful?
🔼 Boost this post to help more traders learn structured analysis
💭 Share your thoughts — does this breakout hold the strength for trend expansion?
🔁 Share with traders who study breakout structures
👉 Follow for more clean, price-action-driven institutional breakdowns
🚀 Stay Calm. Stay Clean. Trade With Patience.
Trade Smart | Learn Zones | Be Self-Reliant 📊
________________________________________
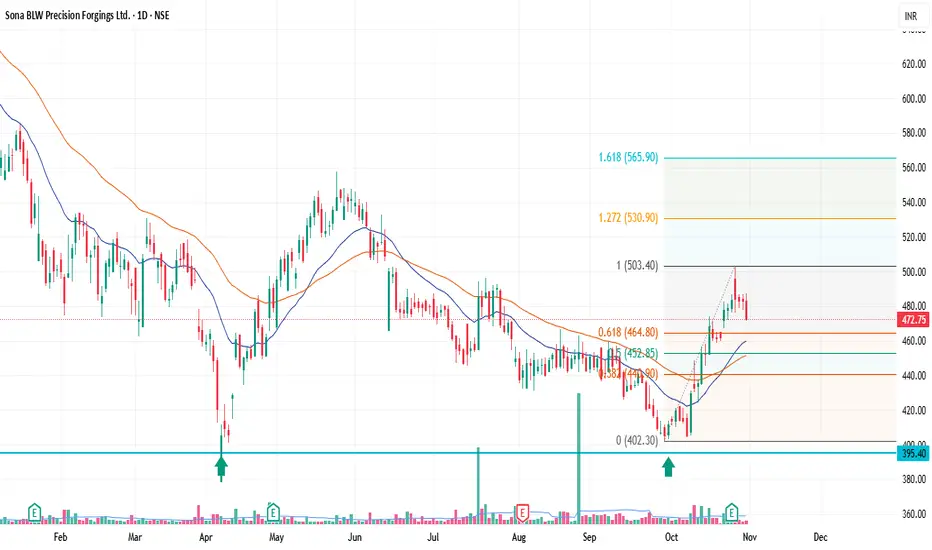
Sona BLW Precision Forgings Ltd. (SONACOMS) — pullback setup(SONACOMS) — Bullish Pullback Setup
📅 Timeframe: 1D | 💰 CMP: ₹472.75 | 📈 Volume: Above average
Technical View
Sona BLW has completed a strong impulse wave from ₹402 → ₹503, followed by a healthy pullback.
Price is now retracing near the 0.618 Fib level (₹464.8), aligning with the 21EMA — a zone that often acts as support during trend continuation.
Volume on the breakout was strong, showing accumulation interest.
Trade Plan
Entry Zone: ₹465–₹470
Stop Loss: ₹450 (below 0.5 Fib and 20EMA)
Targets:
🎯 T1: ₹503
🎯 T2: ₹530 (Fib 1.272)
🎯 T3: ₹566 (Fib 1.618)
Summary
✅ Uptrend resumption likely if ₹450 holds
✅ Rising 21EMA & 50EMA support the structure
✅ Strong breakout volume confirms institutional buying
Bias: Bullish
Risk–Reward: ~1:2.5+
Invalidation: Close below ₹450
Disclaimer : Risk management is crucial in this volatile market, so keep position sizing appropriate. This analysis is intended for educational purposes and not financial advice.
Tamilnad Mercantile Bank – 1D Chart | Strong Resistance Zone🟢 Tamilnad Mercantile Bank (TMB) – 1D Chart | Strong Resistance Zone Ahead
📊 Chart Setup:
TMB is testing its major 1-year resistance zone around ₹510, a key level that has capped price movements for months. A strong daily close above ₹510 could trigger momentum towards higher targets.
🔹 Resistance: ₹510 (Major 1-year resistance)
🔹 Targets on Breakout: ₹535 / ₹600
🔹 Supports: ₹466 / ₹440
🔹 View: Price consolidating near breakout zone. Sustained close above ₹510 can signal trend continuation.
🏦 Fundamental Update – Q2 FY26 Results Highlights:
Tamilnad Mercantile Bank delivered steady performance with profit growth and improved asset quality.
• Net Profit: ₹318 Cr ↑ (▲4.95% YoY)
• Total Business: ↑11.40%
• Deposits: ₹55,421 Cr ↑12.32%
• Advances: ↑10.5%
• Net Interest Income: ₹597 Cr ↑0.17%
• Gross NPA: ↓ to 1.01%
• Net NPA: ↓ to 0.26%
• Capital Adequacy Ratio (CAR): Strong at 30.96%
➡️ Stable performance, improving asset quality, and strong capital base add confidence to the technical setup.
📈 For educational purpose only. Not a buy/sell recommendation.

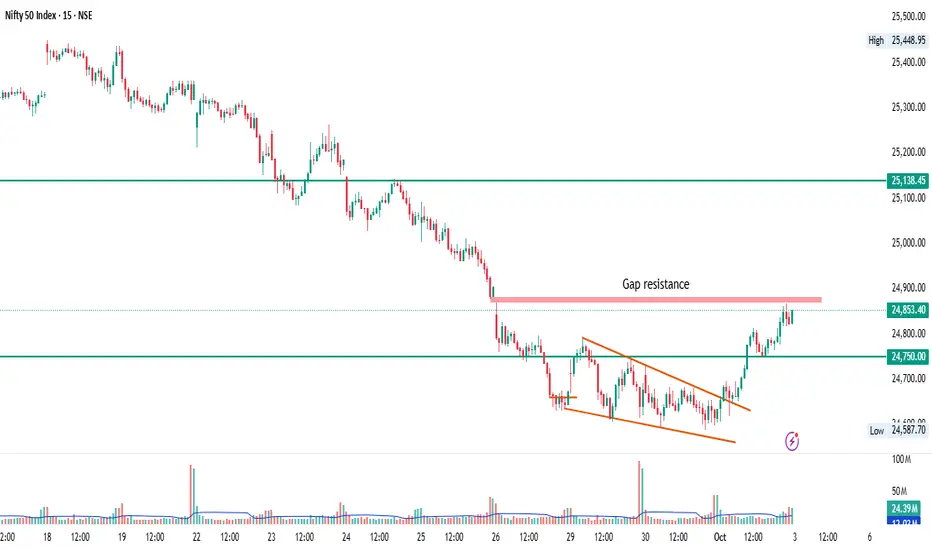
NIFTY 50 – Intraday level 15min TFNIFTY 50 – Gap Resistance Test After Falling Wedge Breakout
Timeframe: 15 min
📌 Key Observations:
Falling wedge pattern formed over the last few sessions, followed by a clean breakout with rising volume.
Price has now rallied toward the gap resistance zone near 24,880–24,900, where supply previously stepped in.
24,750 is acting as immediate support — the level from where the breakout initiated.
Next resistance to watch is 25,138, which aligns with a previous structure zone.
📈 Trading Plan:
✅ Bullish if:
Price sustains above the 24,880–24,900 gap resistance
Then potential upside towards 25,050 / 25,138
⚠️ Caution if:
Price gets rejected at the gap resistance
Watch for pullback retest around 24,750
🔍 Sentiment:
Short-term recovery is in play after a prolonged downtrend, but the current zone is a make-or-break resistance.
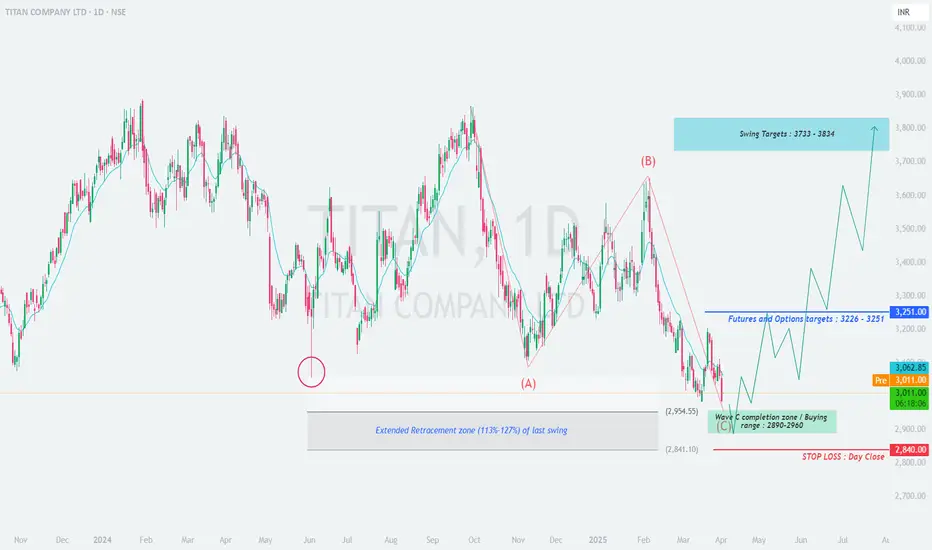
TITAN - High Probability Reversal SetupTITAN COMPANY LTD (NSE:TITAN) - High Probability Reversal Setup
Weekly Timeframe Analysis | Potential Swing Trade Opportunity
▲ BULLISH CASE
Elliott Wave Structure:
• Appears to be completing Wave C of correction (ABC pattern)
• Wave C = 1.272 extension of Wave A at ₹2,890-2,960 zone
• Typical reversal area for such corrections
Technical Confluences:
• Fibonacci Support:
1.127-1.272 retracement of prior uptrend
Aligns with 2023 swing high area
• Volume Profile:
High volume node at ₹2,920
Declining volume on recent downmove
Pattern Recognition:
• Potential falling wedge (bullish)
• RSI(14) weekly showing bullish divergence
• MACD histogram flattening near lows
▼ RISK FACTORS
• Breakdown below ₹2,840 invalidates setup
• Broader market weakness could delay recovery
• FIIs reducing positions in consumer sector
📊 Trade Plan
Entry Zone: ₹2,890-2,960 (scale-in approach recommended)
Stop Loss: Daily close below ₹2,840 (absolute)
Targets:
T1: ₹3,226 (61.8% retrace)
T2: ₹3,733 (previous high)
T3: ₹3,834 (127% extension)
Timeframe: 8-12 week hold for full targets
📌 Key Levels
Support
Resistance
₹2,960 (immediate)
₹3,100 (200 DMA)
₹2,890 (strong)
₹3,226 (F&O OI peak)
₹2,840 (absolute)
₹3,733 (ATH)
💡 Additional Notes:
• Watch for bullish reversal candle patterns in the zone
• FII derivative data shows put writing at ₹2,900 strike
• Consumer sector showing relative strength vs Nifty
Would you take this trade? Discuss in comments!
#TITAN,#NSE,#swingtrading,#elliottwave,#technicalanalysis
NIFTY The Nifty has moved up nicely after opening strong above the trend line. The first resistance is at 25,650, and the second is near the all-time high. Let's see what happens tomorrow, as it's Friday. Hopefully, Donald Trump isn't upset or planning any actions that could turn the market bearish.

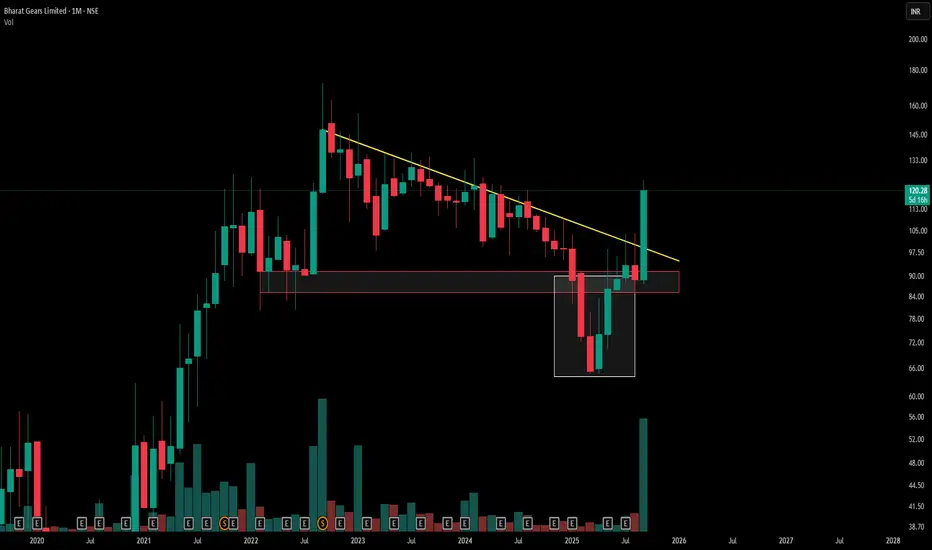
Monthly Descending Triangle & False BreakdownA descending triangle on the monthly chart shows lower highs converging toward a flat support, reflecting mounting seller pressure and key institutional interest at the horizontal base
The red counter trendline highlights corrective rallies within the broader down-sloping resistance.
The red demand zone marks where significant buying absorbed prior declines, offering a structural support area.
The white box illustrates a false breakdown below support—a liquidity-grab that shook out weak hands before a swift recovery—demonstrating how professional traders engineer stop-hunts to secure favorable entry levels.
This interplay of pattern, trendlines, demand zone, and false breakdown underscores how market structure and institutional tactics shape price action—key for informed, risk-defined decisions.
Disclaimer: For educational purposes only. Not investment advice. Risk management and independent research are vital.