Sanofi Sideways breakout Buy above 6240
Sanofi has recently taken support from a monthly demand zone and broken a weekly demand zone on the daily timeframe with huge volume.
The stock was in a downtrend from August 2021 until October 2022, which was phase 4 markdown.
Since October 2022, it has been trading sideways, which can be considered accumulation phase 1.
Today, the sideways breakout has happened, which can be phase 2, meaning mark up.
Plan to buy above today's high of 6240 with a buy entry planned for tomorrow if the high is broken. The stop loss should be around 6070, and the target should be below the weekly supply zone at around 6532, making the risk to reward ratio approximately 1:1.5.
After reaching the target, trail your stop loss and targets upside for more profits.
I am not a SEBI registered individual; my analysis is only for educational purposes.
If you find my analysis helpful, I'd appreciate it if you could like it and follow me on TradingView for more analysis like this.
Nseindia

Series of Bullish Patterns in CRAFTSMANCRAFTSMAN stock chart has formed a series of bullish patterns. Let's break it down:
📈 Inverse Head and Shoulders Pattern 📈
➤ The inverse head and shoulders pattern formed from January 2023 to May 2023 at all-time high levels.
➤ Inverse Head and Shoulders is generally considered a bullish signal.
📈 Breakout and Retest 📈
➤ On May 31st, 2023, a breakout occurred for the inverse head and shoulders pattern with good volume, indicating a potential upward move.
➤ The next day, on June 1st, a retest of the breakout level occurred at the neckline of the inverse head and shoulders pattern, further strengthening the bullish case.
📈 Ascending Triangle Pattern 📈
➤ Following the retest, an ascending triangle pattern formed on the lower 15-minute time frame.
➤ An ascending triangle is a bullish continuation pattern, indicating potential upward momentum.
📈 Based on these patterns, the overall technical outlook appears positive. The inverse head and shoulders pattern followed by a breakout, retest, and subsequent formation of an ascending triangle suggests potential upward momentum in the stock's price. Consider planning a buy entry upon the breakout of the ascending pattern if you missed the entry at the retest of the neckline.
Disclaimer: This analysis is for educational purposes only and does not constitute financial advice. I am not a SEBI registered analyst. Always conduct your own research and consult a qualified professional before making any investment decisions.
💬 Feel free to share your observations and insights in the comments section. Your comments and feedback are greatly appreciated. Don't forget to like this analysis if you found it helpful!
🤝 Thank you for your continuous support, likes, follows, and comments. Your engagement keeps me motivated to consistently provide valuable content.
Follow me on TradingView for more articles and trade setups: in.tradingview.com
🚀🔥 Trading is a journey. Stay motivated and keep learning! 🔥🚀
Technical Terms Explained :
Inverse Head and Shoulders Pattern : A bullish reversal pattern characterized by three successive troughs, with the middle trough (the head) being lower than the other two (the shoulders). It indicates a potential trend reversal from bearish to bullish.
Breakout : When the price of an asset moves above a significant level of resistance, signaling a potential upward move.
Retest : After a breakout, when the price retraces back to the breakout level, acting as a test to validate the breakout's strength.
Ascending Triangle Pattern : A bullish continuation pattern characterized by a series of higher lows and a horizontal resistance line. It suggests potential upward momentum.

PRESTIGE ESTATES - 58% RETURNS!!!BUY - PRESTIGE ESTATES
CMP - Rs. 514
Target - 1: Rs. 720
Target - 2: Rs. 815
.
.
Technicals - Bullish Flag nearing BO
.
This is just a view by an expert analyst, please invest at your own risk.
.
Follow me for more!

PRIVISCLPRIVISCL:- The stock is about to give a breakout by trapping the sellers, if the stock sustains above the level of 1150, then we can see an upside movement.
Hello traders,
As always, simple and neat charts so everyone can understand and not make it too complicated.
rest details mentioned in the chart.
will be posting more such ideas like this. Until that, like share and follow :)
check my other ideas to get to know about all the successful trades based on price action.
Thanks,
Ajay.
keep learning and keep earning.

IBREALESTIBREALEST:- Stock has given breakout by forming cup and handle, if stock hits between 69 - 70.50 level then you can plan something, till then keep an eye on the stock
Hello traders,
As always, simple and neat charts so everyone can understand and not make it too complicated.
rest details mentioned in the chart.
will be posting more such ideas like this. Until that, like share and follow :)
check my other ideas to get to know about all the successful trades based on price action.
Thanks,
Ajay.
keep learning and keep earning.

Centum Electronics LimitedCENTUM:- Stock has given breakout by forming head and shoulders, we should wait for retesting till then keep an eye.
Hello traders,
As always, simple and neat charts so everyone can understand and not make it too complicated.
rest details mentioned in the chart.
will be posting more such ideas like this. Until that, like share and follow :)
check my other ideas to get to know about all the successful trades based on price action.
Thanks,
Ajay.
keep learning and keep earning.

ENDURANCEENDURANCE:- Ascending triangle pattern is formed, breakout is found, movement to the upside can be seen, till then keep your eye on the stock.
Hello traders,
As always, simple and neat charts so everyone can understand and not make it too complicated.
rest details mentioned in the chart.
will be posting more such ideas like this. Until that, like share and follow :)
check my other ideas to get to know about all the successful trades based on price action.
Thanks,
Ajay.
keep learning and keep earning.

BIRLACORPNBIRLACORPN:- Symmetrical triangle pattern is formed, you can plan something on the side which gets breakout, till then keep an eye on the stock.
Hello traders,
As always, simple and neat charts so everyone can understand and not make it too complicated.
rest details mentioned in the chart.
will be posting more such ideas like this. Until that, like share and follow :)
check my other ideas to get to know about all the successful trades based on price action.
Thanks,
Ajay.
keep learning and keep earning.

WABAGWABAG:- Rounding bottom pattern is formed, wait for breakout, till then keep your eye on the stock
Hello traders,
As always, simple and neat charts so everyone can understand and not make it too complicated.
rest details mentioned in the chart.
will be posting more such ideas like this. Until that, like share and follow :)
check my other ideas to get to know about all the successful trades based on price action.
Thanks,
Ajay.
keep learning and keep earning.

MAHSCOOTERMAHSCOOTER:- The stock has given a breakout on every time frame, keep an eye on the stock
Hello traders,
As always, simple and neat charts so everyone can understand and not make it too complicated.
rest details mentioned in the chart.
will be posting more such ideas like this. Until that, like share and follow :)
check my other ideas to get to know about all the successful trades based on price action.
Thanks,
Ajay.
keep learning and keep earning.

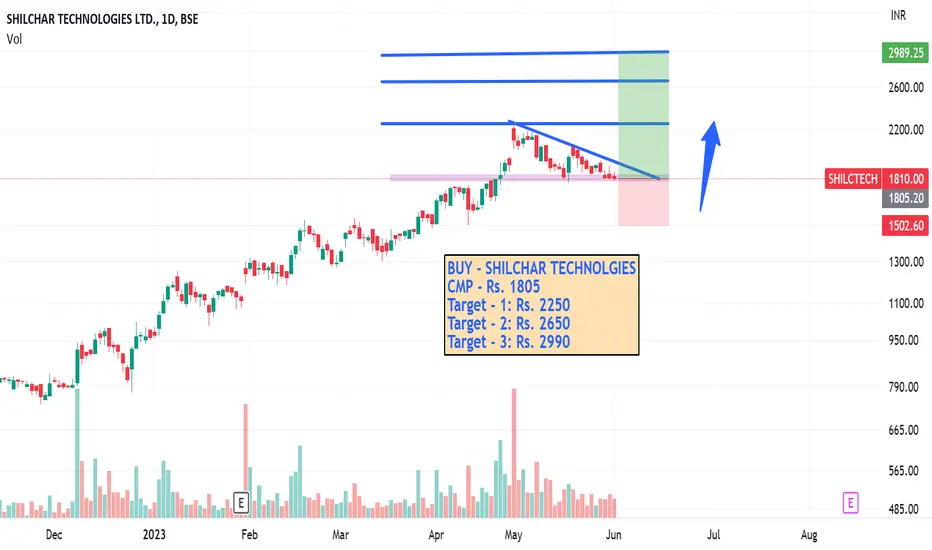
SHILCHAR TECHNOLOGIES - 65% RETURNS!!!BUY - SHILCHAR TECHNOLGIES
CMP - Rs. 1805
Target - 1: Rs. 2250
Target - 2: Rs. 2650
Target - 3: Rs. 2990
.
.
Technicals - Bullish Triangle Pattern
.
This is just a view by an expert analyst, please invest at your own risk.
.
Follow me for more!
SAVITA OIL TECH - 63% RETURNS!!!BUY - SAVITA OIL TECHNOLOGIES
CMP - Rs. 277
Target - 1: Rs. 372
Target - 2: Rs. 455
.
.
Technicals - Bullis Flag BO
.
This is just a view by an expert analyst, please invest at your own risk.
.
Follow me for more!

VIP INDUSTRIES - 40% RETURNS!!!BUY - VIP INDUSTRIES
CMP - Rs. 602
Target - 1: Rs. 735
Target - 2: Rs. 850
.
.
Technicals - Bullish Symmetrical Triangle Pattern
.
This is just a view by an expert analyst, please invest at your own risk.
.
Follow me for more!

Greenply Faces Resistance, Breakout, and RetestNote: This analysis is for educational purposes only and should not be considered as financial advice. I am not a SEBI registered analyst.
Greenply, a stock that has been facing resistance since December 2022, recently broke out of a rectangle pattern on 5th May with significant volume. After the breakout, the price has moved up and is now approaching a retest of the breakout level. The previous resistance level is expected to act as support.
Here's a plan for potential trade entry:
Buy Entry: Around 154.75
Stop Loss (SL): Below the daily demand zone, approximately 151.5
Target: Below the daily supply zone, around 162
Risk-to-Reward Ratio: 1:2
It's important to note that trading carries inherent risks, and it's crucial to manage risk through proper position sizing and risk management techniques.
Summary:
Greenply has faced resistance since December 2022 but recently experienced a breakout from a rectangle pattern. The price is now testing the breakout level, which is expected to act as support. Traders may consider a buy entry around 154.75, with a stop loss below the daily demand zone at 151.5. The target is set below the daily supply zone around 162, resulting in a risk-to-reward ratio of 1:2.
Remember, always do your own research and consider multiple factors before making any trading decisions.
If you found this analysis helpful, please like it and follow me on TradingView for more articles and trade setups.
Thank you for your support, likes, follows, and comments. Your love and encouragement keep me motivated to write consistently.
Catch me on TradingView for more insights and profitable trade setups! 📈📊👉 in.tradingview.com
🙌🚀 Keep learning, keep trading, and may the markets be in your favour! 🚀🙌
Technical Terms:
Resistance : A price zone where selling pressure tends to overcome buying pressure, causing the price to stall or reverse .
Breakout : A price movement above a key resistance level, indicating a potential continuation or reversal of the trend .
Retest : When the price returns to a previously broken level to test its newfound support or resistance .
Support : A price zone where buying pressure tends to overcome selling pressure, preventing the price from falling further .
Stop Loss (SL) : A predetermined price level at which a trader exits a position to limit potential losses .
Risk-to-Reward Ratio : A measure of potential profit relative to potential loss in a trade, calculated by dividing the target price distance by the stop loss distance

IIFL FINANCE - 72% RETURNS!!!BUY - IIFL FINANCE LTD
CMP - Rs. 445
Target - 1: Rs. 560
Target - 2: Rs. 650
Target - 3: Rs. 770
.
.
Technicals - Ascending Channel BO
.
This is just a view by an expert analyst, please invest at your own risk.
.
Follow me for more!

EDELWEISS FIN SERVICES - 120% RETURNS!!BUY - EDELWEISS FINANCIAL SERVICES
CMP -Rs. 67
Target - 1: Rs. 96
Target - 2: Rs. 124
Target - 3: Rs. 150
.
.
Technicals - Bullish Triangle
.
This is just a view by an expert analyst, please invest at your own risk.
.
Follow me for more!

KOTAKBANKKOTAKBANK:- Stock has given breakout almost after 1 year, if it sustains above 1979.70 level then we can plan something
Hello traders,
As always, simple and neat charts so everyone can understand and not make it too complicated.
rest details mentioned in the chart.
will be posting more such ideas like this. Until that, like share and follow :)
check my other ideas to get to know about all the successful trades based on price action.
Thanks,
Ajay.
keep learning and keep earning.

LOKESH MACHINES - 78% RETURNS!!!BUY - LOKESH MACHINES
CMP - Rs. 145
Target - 1: Rs. 210
Target - 2: Rs. 260
.
.
Technicals - Double Bottom BO
.
This is just a view by an expert analyst, please invest at your own risk.
.
Follow me for more!

FDC LTD - 42% RETURNS!!!BUY - FDC LTD
CMP - Rs. 299
Target - 1: Rs. 360
Target - 2: Rs. 400
Target - 3: Rs. 430
.
.
Technicals - Trendline nearing BO
.
This is just a view by an expert analyst, please invest at your own risk.
.
Follow me for more!

PRAJ INDUSTRIES - 70% RETURNS!!!BUY - PRAJ INDUSTRIES
CMP - Rs. 386
Target - 1: Rs. 470
Target - 2: Rs. 660
.
.
Technicals - Trendline nearing BO(Good QoQ)
.
This is just a view by an expert analyst, please invest at your own risk.
.
Follow me for more!

IRCON INTERNATIONAL - 60% RETURNS!!!BUY - IRCON INTERNATIONAL
CMP - Rs. 81
Target - 1: Rs. 100
Target - 2: Rs. 115
Target - 3: Rs. 130
.
.
Technicals - Bullish Pennant BO
.
This is just a view by an expert analyst, please invest at your own risk.
.
Follow me for more!

VST IND - 68% RETURNS!!!BUY - VST INDUSTRIES
CMP - Rs. 3333
Target - 1: Rs. 4800
Target - 2: Rs. 5600
.
.
Technicals - Bullish Symmetrical Triangle BO
.
This is just a view by an expert analyst, please invest at your own risk.
.
Follow me for more!

BANKNIFTY Make or Break SituationThe market is at a crucial price level and global markets are giving positive sentiments in the short term. However, markets have been choppy recently and must be traded with caution.
