BUY TODAY SELL TOMORROW for 5%DON’T HAVE TIME TO MANAGE YOUR TRADES?
- Take BTST trades at 3:25 pm every day
- Try to exit by taking 4-7% profit of each trade
- SL can also be maintained as closing below the low of the breakout candle
Now, why do I prefer BTST over swing trades? The primary reason is that I have observed that 90% of the stocks give most of the movement in just 1-2 days and the rest of the time they either consolidate or fall
Resistance Breakout in OIL
BUY TODAY SELL TOMORROW for 5%
Oil

NATURALGAS BOOM Naturalgas gas make a high of 444on 21 Jan 26. It's good move. Entry was given near 297 . Keep Trial SL don't make new entry . It's news based Rally.
Tgt 350+

RELIANCE: Major Weekly Breakout & Long SetupTechnical Analysis
Structure Breakout: The stock has successfully broken out above a key multi-month resistance level at 1592.30 (marked by the green horizontal line). This level previously acted as a significant supply zone, forming the rim of a potential bullish consolidation pattern (resembling a Cup & Handle or Rounding Bottom).
Momentum: The recent weekly candles show strong bullish momentum, pushing through the resistance with conviction. The price is now sustaining above this breakout point, which validates the bullish thesis.
Trend Continuation: After a period of correction and consolidation, the primary uptrend seems to be resuming. The Higher High (HH) formation on the weekly chart confirms the strength of buyers.
Risk/Reward: The setup offers an excellent Risk-to-Reward ratio (approximately 1:3), making it a high-probability trade for positional traders.
Trade Setup (Long)
Entry Zone: 1592 - 1600 (On the retest or continuation above the breakout level)
Stop Loss: 1509.15 (Placed below the breakout candle and recent swing structure to invalidate the thesis)
Target: 1855.60 (Projected measured move based on the depth of the previous consolidation)
Potential R:R: ~ 1:3.1
⚠️ Disclaimer: This analysis is for educational purposes only and does not constitute financial advice. I am not a SEBI registered analyst. Trading involves risk; please consult your financial advisor and conduct your own analysis before executing any trades.

Nifty ATH vs. Trump’s War: Monday Levels to watchNifty just hit a historic All-Time High of 26,340 on Friday. But over the weekend, Donald Trump sent shockwaves through the world—attacking Venezuela and capturing Maduro. This Monday, we aren't just trading charts; we are trading geopolitics. Is this the end of the rally or a massive 'Buy the Dip' opportunity? Let’s look at the pre-market levels.

Crude Oil Long ??What could be the next move for Crude Oil after yesterday's attack of USA on Venezuela taking control of their Crude reserves. What does it mean for India, US Dollar and INR ?

USOil the zone 58.200 is retesting again and again The zone 58.200 is retesting again and again.if market again tap this zone we can take trade according to the market condition Buy or Sell .

$CRUDE will be very RUDE in upcoming months!on a weekly timeframe Crude consolidating in paraller channel making lower highs lower lows
in other angle its making a BULLISH FLAG pattern.
keep on watchlist.

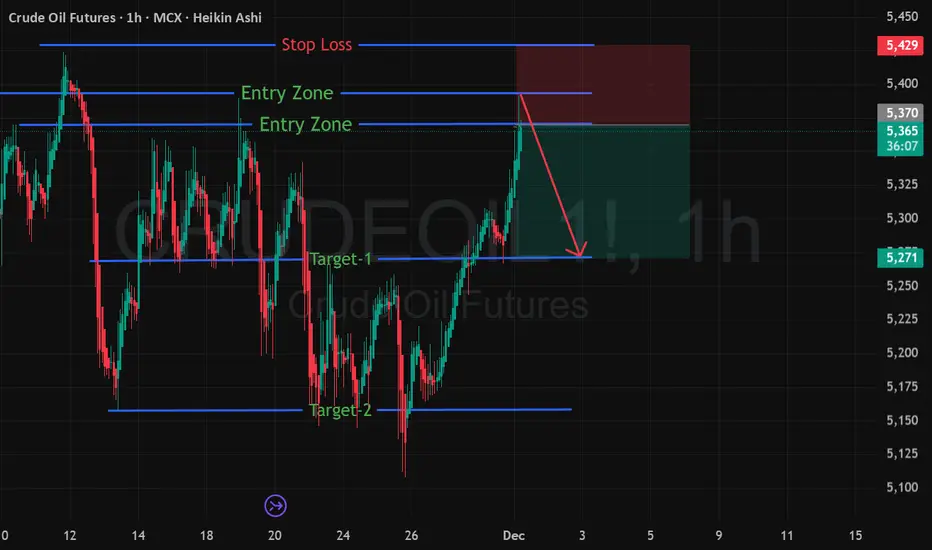
MCX CRUDE OIL (DEC-25) — Bullish Trend Setup IdentifiedA fresh Bullish Trend Entry Zone has been detected on MCX Crude Oil DEC-25, indicating a potential upside continuation from the demand zone.
📈 Trade Setup
🟢 Entry Range: 5370 – 5390
🔴 Stop Loss: 5430
🎯 Target 1: 5270
🎯 Target 2: 5170
📊 Chart Explanation
Crude Oil has recently shown strong accumulation behavior near the lower demand band. Price is now entering a bullish reversal range, supported by:
Prior demand zone retest
Higher-low structure
Increasing bullish momentum
Buyers absorbing supply near 5370–5390
This setup indicates a possible swing move towards the 5270 and 5170 zones.
⚠️ Risk Management
Keep SL strictly at 5430
Position sizing is crucial as volatility remains high
This analysis is for educational purposes—trade with discipline
📌 Summary
Crude Oil DEC-25 is showing a clean bullish continuation structure. If price sustains above the entry zone, we may see a strong move toward the mentioned targets.
Oil India | Bullish Breakout with Institutional Volume Surge💹 Oil India Ltd (NSE: OIL)
Sector: Energy | CMP: ₹438.05 | View: Bullish Breakout Setup
📊 Price Action:
Oil India has shown a strong bullish candle breakout after weeks of consolidation between 410–420. Buyers stepped in aggressively with volume confirmation, pushing price above the short-term resistance. A sustained close above 435 could trigger a fresh up-move toward the 450–455 zone.
HNI Trade Levels (STWP Setup):
Aggressive Entry: 434.75–436.20 | Stop Loss: 416.08
Low-Risk Entry: 432.57 | Stop Loss: 411.75
HNI and institutional buyers are showing strong accumulation interest with rising volumes. The breakout candle indicates smart money entering early into the trend. Sustained buying momentum suggests continued institutional participation ahead.
VCP Analysis:
Oil India is forming a smooth Volatility Contraction Pattern with clear price tightening in recent weeks. Volume contraction followed by today’s strong expansion indicates a potential VCP breakout stage. The surge in volume confirms institutional activity aligning with the final contraction phase breakout.
STWP Trading Analysis:
Entry: 436.20 | Stop Loss: 410.30
Strong bullish momentum with a wide-range candle backed by heavy institutional volumes. The breakout structure signals renewed trend strength with clear directional intent. Sustaining above 430 will keep the momentum in favor of buyers.
Fibonacci Analysis:
Oil India’s Fibonacci structure is plotted from the Swing Low at 384.6 to the Swing High at 491.5, capturing the recent trend wave. The stock is currently trading near the 50% retracement level at 438.05, showing a strong recovery within the ongoing uptrend. Holding above the 38.2% zone at 425.44 will keep momentum intact, while a breakout above the 61.8% level at 450.66 could extend the move toward 468–491, confirming trend continuation.
STWP Support & Resistance:
Resistances: 440.53 | 446.32 | 456.43
Supports: 424.63 | 414.52 | 408.73
While we note the above technical levels, the chart displays resistance zones at 448–456 and 478–491 as relatively weak, indicating limited selling pressure. However, supports near 392–384 and 325–350 appear strong, reflecting firm institutional demand and accumulation interest. This structure suggests a bullish bias, where sustained buying above 440 could trigger continuation momentum toward higher levels.
STWP Volume & Technical Setup:
Oil India delivered a power-packed bullish session today, marked by a strong Marubozu candle that reflected uninterrupted buying momentum from open to close. The chart’s yellow label captures a perfect storm of bullish confirmations — from exceptional volume (6.03M vs 2.48M avg, ratio 2.43x) to a Bollinger Band breakout emerging right after a compression phase, signaling fresh volatility expansion. The RSI breakout, 200 EMA crossover, and BB Squeeze trigger all align to validate institutional accumulation and trend strength. With buyer dominance clearly visible, Oil India stands poised for a momentum-driven continuation in the sessions ahead.
STWP Summary View:
Final Outlook:
Momentum: Strong | Trend: Bullish | Risk: Low | Volume: High
Oil India displays a textbook bullish setup with strong price action, expanding volume, and visible institutional activity.
A high-volume breakout from a tight base confirms trend strength and upside potential. Holding above key supports keeps risk low and the bullish momentum intact.
________________________________________
________________________________________
⚠️ Disclosure & Disclaimer – Please Read Carefully
The information shared here is meant purely for learning and awareness. It is not a buy or sell recommendation and should not be taken as investment advice. I am not a SEBI-registered investment adviser, and all views expressed are based on personal study, chart patterns, and publicly available market data.
Trading—whether in stocks or options—carries risk. Markets can move unexpectedly, and losses can sometimes exceed the money you have invested. Past performance or past setups do not guarantee future results.
If you are a beginner, treat this as a guide to understand how the market works and practice on paper trades before risking real money. If you are experienced, always assess your own risk, position sizing, and strategy suitability before entering trades.
Consult a SEBI-registered financial adviser before making any real trading decision. By engaging with this content, you acknowledge full responsibility for your trades and investments.
Position Status: No active position in (OIL) at the time of analysis.
Data Source: TradingView & NSE India (Past Chart Reference) (Historical levels)
💬 Found this useful?
🔼 Give this post a Boost to help more traders discover clean, structured learning.
✍️ Drop your thoughts, questions, or setups in the comments — let’s grow together!
🔁 Share with fellow traders and beginners to spread awareness.
👉 “If you liked this breakdown, follow for more clean, structured setups with discipline at the core.”
🚀 Stay Calm. Stay Clean. Trade With Patience.
Trade Smart | Learn Zones | Be Self-Reliant 📊

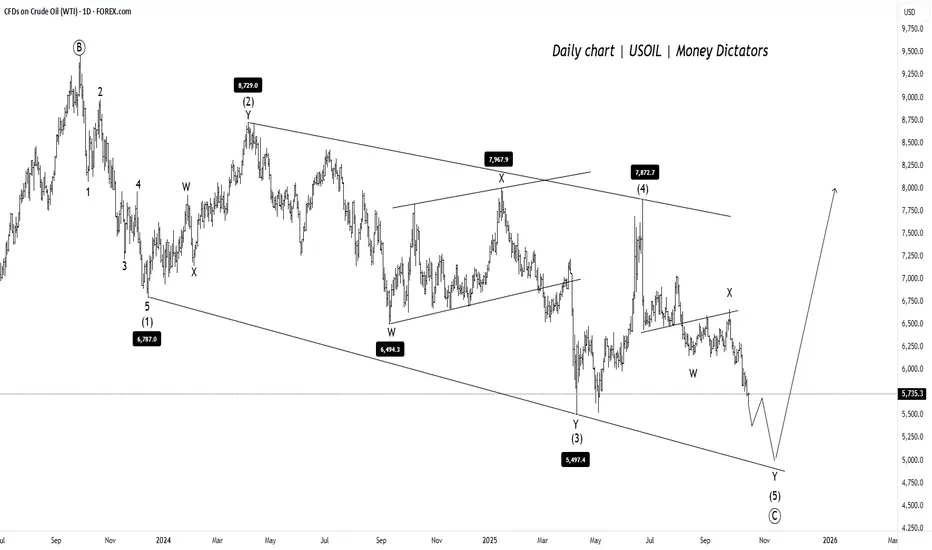
USOIL Near Final Leg USOIL is forming a clear corrective pattern inside a falling channel. Price is currently in the final leg of wave (5) of (C), suggesting one more dip is likely before reversal.
The downside target lies near 5,000–5,200 , where support from the channel base aligns. Once this level holds, a strong bullish reversal is expected, marking the end of the correction and the start of a new upward trend.
Stay Tuned!
@Money_Dictators :)
Crude Oil (WTI) Technical Analysis - October 17, 2025Current Price and OverviewAs
WTI Crude Oil is trading at 56.88 USD, down 0.58 (-1.01%) on the day. The market remains firmly in a bearish trend, with prices continuing to decline amid broader impulse wave C within a multi-month downtrend that began in July. Recent trading saw a brief rebound after testing support near 56.35, providing some positive momentum and easing oversold conditions, but the overall short-term outlook stays bearish. A bearish gap has formed below the key psychological level of 60.00, accelerating the downside.The technical summary across major indicators points to a Strong Sell, with no buy signals from moving averages and MACD confirming downward pressure.
Support and Resistance LevelsKey
Support Levels: 56.35 (immediate, recently tested), 49.5. (next major, deeper target zone 27 - 15 ).
Key Resistance Levels: 57.60–60.50 (Gold Zone, recent breakdown),
65.00 (major overhead resistance,
Price Action and Scenarios
Bearish Scenario (Primary): Prices have broken key support at 57.35 and the down-channel trendline, confirming continuation of wave C. Expect further downside to 55.20, with potential extension to 49.83 if momentum builds. Short positions are favoured on rebounds to resistance
Bullish Scenario ( Still Not Confirmed)
This analysis is based on hourly and daily charts; always consider fundamental factors like OPEC decisions or US inventory reports for confirmation.
Disclaimer
High Risk Investment
Trading or investing in assets like crypto, equity, or commodities carries high risk and may not suit all investors.
Analysis on this channel uses recent technical data and market sentiment from web sources for informational and educational purposes only, not financial advice. Trading involves high risks, and past performance does not guarantee future results. Always conduct your own research or consult a SEBI-registered advisor before investing or trading.
This channel, Render With Me, is not responsible for any financial loss arising directly or indirectly from using or relying on this information.

Crude Oil FallImpact of fresh tarriff imposition on China by US has led to further fall in crude oil. Quoting below 200 EMA. If breaks the suppport then further fall can be seen this week.

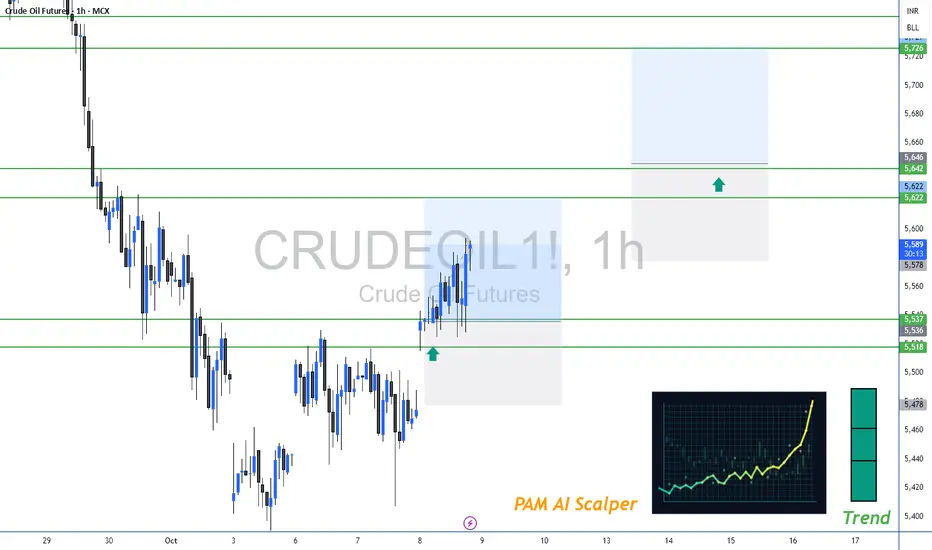
CRUDE OIL By KRS ChartsDate: 2nd July 2025 / 19:35
Why Crude Oil ?
1. Starting with 1H Tf. Accumulation is visible with LLs to Sideways and now HHs & HLs
2. Crude oil Price is currently in Buy Zone with strong support.
3. Recent Gap Dow is likely to be Shakeout for Buyers.
4. In Bigger Timeframe price has made Low in March is likely to be the bottom as per Wave thoery.
5. After that bottom price on Higher low side price accumulating.
6. From Here it seems like bullish side trades will be better option for Crude Oil for Targets which are mentioned in Chart. (Medium Term View).

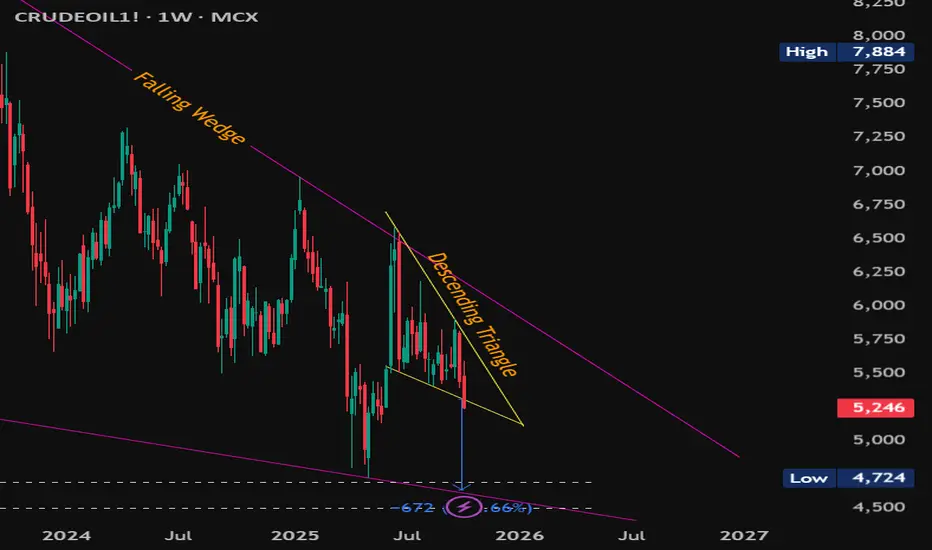
#MCXCrudeOil Weekly – Breakdown into Major Support Zone#MCXCrudeOil Weekly – Breakdown into Major Support Zone
CMP: 5,246
Crude Oil has broken down from a descending triangle with a confirmed weekly close below 5,308 , triggering target of 4,636 . This move unfolds within a larger falling wedge pattern , adding confluence and signaling potential volatility ahead.
This breakdown aligns with two key confluences :
📉 The falling wedge lower trendline.
🟠 A major historical demand zone at 4,692 – 4,499 , which was previous resistance turned strong support on multiple occasions.
This make-or-break support zone could act as:
🔄 A reversal zone , potentially triggering a bullish breakout from the wedge.
📉 Or, if breached, it may invalidate the wedge and lead to extended downside.
Key Levels:
Resistance: 5,903 & 6,184 (price action + wedge top)
Support: 4,692 – 4,499 (confluence zone)
Breakdown Target: 4,636 (descending triangle pattern)
Watch weekly candle behavior near this zone closely for signs of either rejection or continuation .
#CrudeOil #MCXCrude #ChartPatterns #FallingWedge #DescendingTriangle #PriceAction #BreakdownAlert #SwingTrading #CommodityTrading
📌 Disclaimer: This analysis is shared for educational purposes only. It is not a buy/sell recommendation. Please do your own research before making any trading decisions.
Crude Oil Levels For October 2025Important support and Resistance Levels For Crude Oil.
When Market touches the level, the price action plays important roles.
For More Learning Reach out to us.
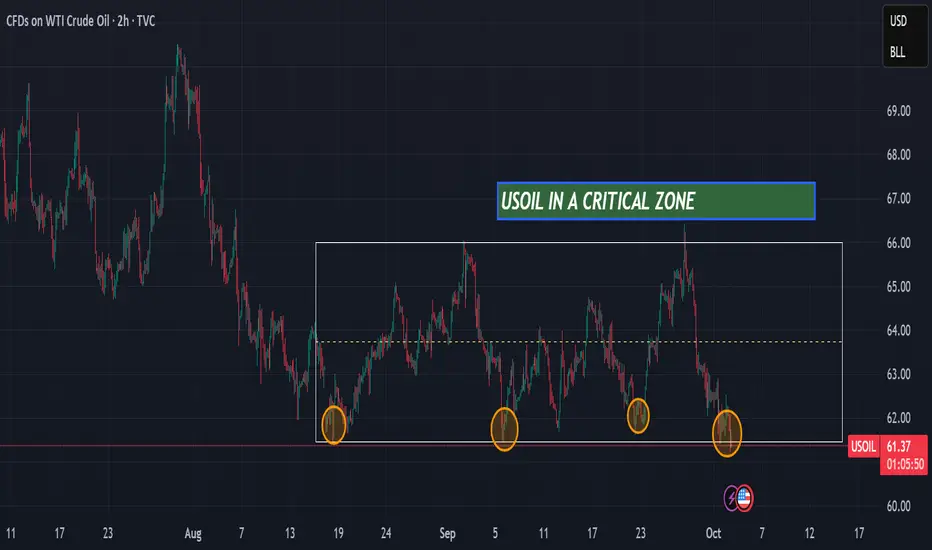
USOIL is in a critical zoneHello,
USOIL is currently at a major support level that has held for the past 2 months. There are two possible scenarios: either the support holds and USOIL bounces back toward the resistance at $66, or the support breaks and the price moves down to the next level at $60,
Ibrouri Abdessamad
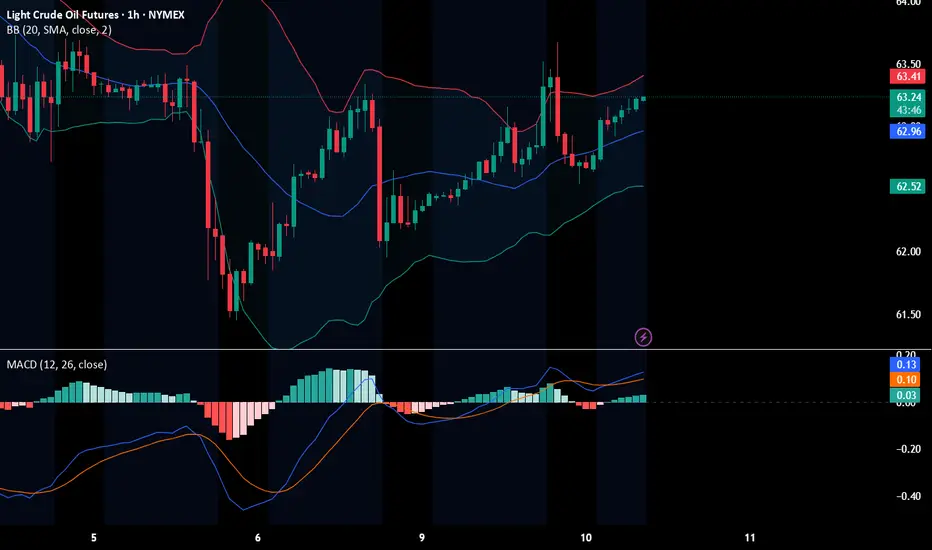
Will crude drop to $61.70?hello,
according to my analysis on 2h time frame there is high probability that crude oil futures could drop to 61.7 IN FEW HOURS,

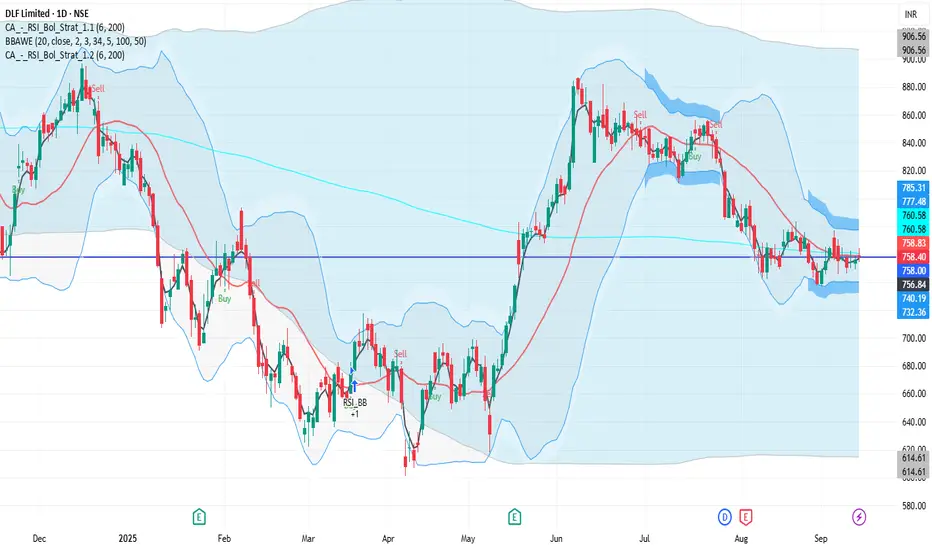
DLF 1D Time frame📉 Current Market Snapshot
Current Price: ₹758.40
Previous Close: ₹756.35
Day's Range: ₹754.20 – ₹764.40
52-Week High: ₹929.00
52-Week Low: ₹601.20
Market Cap: ₹1.87 lakh crore
P/E Ratio: 41.85
Dividend Yield: 0.79%
ROE: 10.76%
Debt-to-Equity Ratio: 0.10
Beta: 1.78
EPS (TTM): ₹18.12
Book Value: ₹172.51
Face Value: ₹2.00
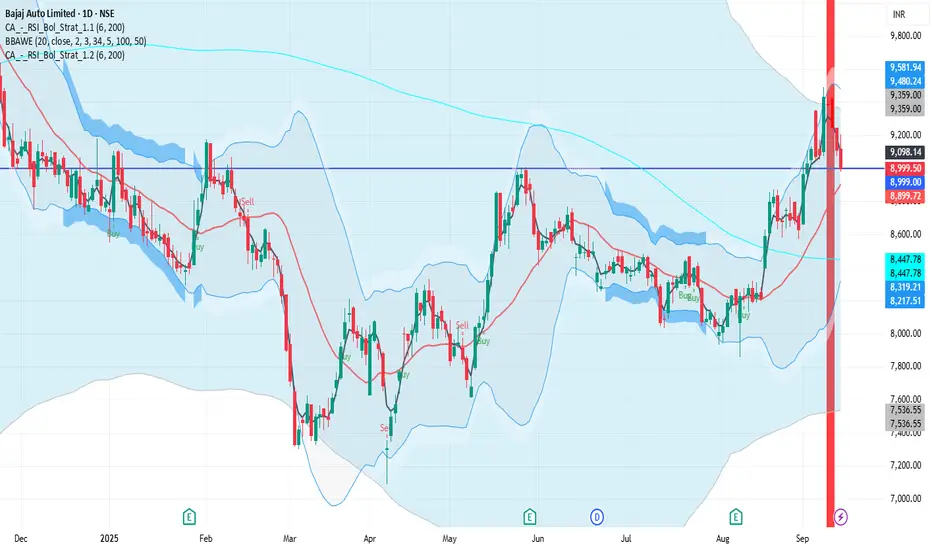
BAJAJ_AUTO 1D Time frame📉 Current Market Snapshot
Previous Close: ₹9,113.50
Today's Range: ₹8,979.50 – ₹9,205.00
Current Price: ₹8,999.50
Market Cap: ₹2,51,318 crore
P/E Ratio: 33.1
Dividend Yield: 2.33%
52-Week High: ₹12,774
52-Week Low: ₹7,089.35
Crude oil - Sell around 65.00, target 62.00-60.00Crude Oil Market Analysis:
Crude oil closed with a small positive candlestick yesterday, rebounding for three consecutive trading days. It appears that the 60.00 support level remains very strong and difficult to break in the short term. If it rebounds near 65.00, continue selling. Crude oil remains bearish. Today's strategy remains unchanged. Yesterday's positive close is somewhat related to the EIA crude oil inventory data.
Fundamental Analysis:
The most important data this week, the CPI, will be released today. The recent surge in gold prices is due to increased market expectations of a September rate cut by the Federal Reserve. This CPI may be the last data the Fed will use as a reference.
Trading Recommendation:
Crude oil - Sell around 65.00, target 62.00-60.00.

Crude oil - Sell around 63.30, target 62.00-60.00Crude Oil Market Analysis:
The strategy for crude oil is simple: a rebound is a selling opportunity. Don't dwell on the details. Crude oil has been fluctuating for a long time. If it breaks through, we will adjust our strategy. Today, sell crude oil around 64.30. The key resistance level for crude oil is around 65.60. A break of this level will trigger a strong trend. Sell crude oil in the short term during short-term fluctuations. A break of 60.00 will open up new room for significant declines.
Fundamental Analysis:
Today, focus on the EIA crude oil inventory data. The CPI will be released tomorrow, and this week's major action will also be tomorrow.
Trading Recommendations:
Crude oil - Sell around 63.30, target 62.00-60.00

WTI(20250910)Today's AnalysisMarket News:
U.S. employment data was significantly revised downward, with jobs for the 12 months ending in March revised down by 911,000.
Technical Analysis:
Today's buy/sell levels:
62.62
Support and resistance levels:
63.88
63.41
63.10
62.14
61.83
61.36
Trading Strategy:
On a breakout above 63.10, consider a buy entry, with the first target at 63.41.
On a breakout below 62.62, consider a sell entry, with the first target at 62.14
Crude oil - Sell near 63.50, target 62.00-60.00Crude Oil Market Analysis:
Crude oil has recently been recovering on the daily chart, with the focus of the recovery shifting downward. Weak inventory data is also the primary reason for the continued decline in crude oil prices. Today, we maintain a bearish outlook and focus on sell orders near 63.50. Don't chase crude oil today; wait for a small rebound before selling. It's been volatile, and the buying and selling game has been going on for a long time.
Fundamental Analysis:
The previous sharp drop in non-farm payroll data led to a surge in gold prices. This week, we will monitor CPI data.
Trading Recommendations:
Crude oil - Sell near 63.50, target 62.00-60.00
