Crude oil - Sell near 63.50, target 62.00-60.00Crude Oil Market Analysis:
Crude oil has recently been recovering on the daily chart, with the focus of the recovery shifting downward. Weak inventory data is also the primary reason for the continued decline in crude oil prices. Today, we maintain a bearish outlook and focus on sell orders near 63.50. Don't chase crude oil today; wait for a small rebound before selling. It's been volatile, and the buying and selling game has been going on for a long time.
Fundamental Analysis:
The previous sharp drop in non-farm payroll data led to a surge in gold prices. This week, we will monitor CPI data.
Trading Recommendations:
Crude oil - Sell near 63.50, target 62.00-60.00
Oil

Crude oil - Sell around 64.00, with a target range of 62.00-60.0Crude Oil Market Analysis:
Crude oil has recently begun to move slowly, with the daily chart beginning to decline. This week, we will focus on gains and losses around 60.00. If this level is broken, further downside is possible. We remain bearish on crude oil and continue to sell on rebounds. Every rebound presents an opportunity to sell again. Today, we are focusing on sell opportunities near 64.00. The recently released crude oil inventories are essentially flat, with no significant gap to support buying.
Fundamental Analysis:
Last week's non-farm payroll data showed a figure of 22,000, compared to expectations of 75,000 and a previous estimate of 79,000. This result is quite disappointing. In short, fewer US jobs, a weaker economy, and therefore a stronger gold price. This week, we will monitor the CPI.
Trading Recommendations:
Crude oil - Sell around 64.00, with a target range of 62.00-60.00.

Crude oil - Sell around 64.00, target 62.00-60.00Crude Oil Market Analysis:
Crude oil is still experiencing a recent correction in daily price action. We should consider continuing to sell on any rebounds. Previous crude oil contracts and inventories haven't changed the trend, and recent data doesn't support it. I predict it will be difficult to reverse the weak selling trend in the short term. Today, we're considering selling around 64.00.
Fundamental Analysis:
Recent fundamentals haven't significantly stimulated the market. Today, we'll focus on the US non-farm payroll data.
Trading Recommendations:
Crude oil - Sell around 64.00, target 62.00-60.00

Crude oil - Sell around 64.50, target 63.00-60.00Crude Oil Market Analysis:
The recent daily chart of crude oil has been a fluctuating pattern of rising and falling prices, making us question our own future. Today, we maintain a bearish outlook. Every rebound presents a selling opportunity. We've been selling crude oil for months, and it's been fluctuating for months now, with no signs of a rebound or upward movement. Unless the weekly hurdle of 75 is broken, a significant rally is unlikely. Consider selling if it rebounds to 64.50 today.
Fundamental Analysis:
Today we will have ADP employment and unemployment benefits data.
Trading Recommendation:
Crude oil - Sell around 64.50, target 63.00-60.00

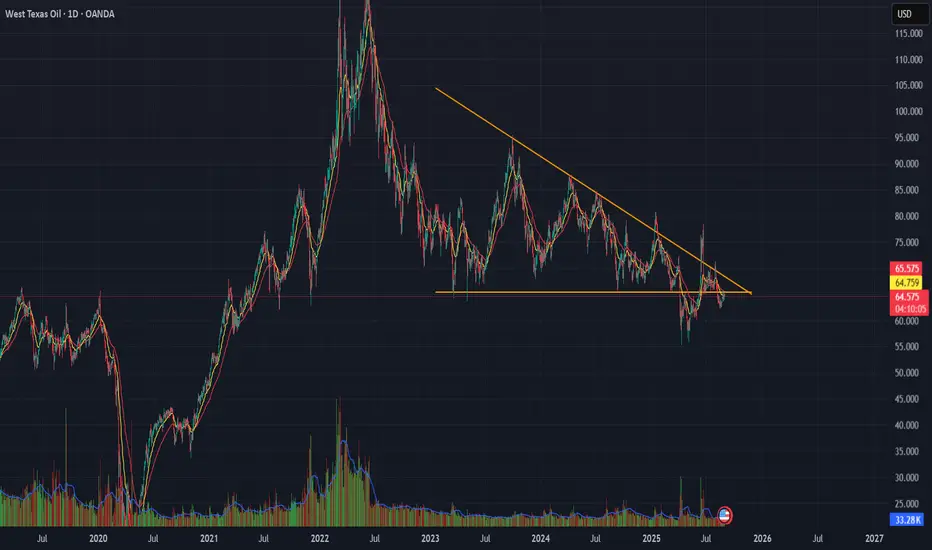
WTI Crude Oil Descending Triangle Pattern
WTI is forming a Descending Triangle pattern near recent support.
📊 Technicals : Flat base with lower highs compressing price action.
🔎 Key Levels: Breakdown below support 65 Leads To bearish continuation;
bounce above resistance 71 Leads To reversal setup.
⚠ Risk View: Energy fundamentals remain mixed — confirmation with volume is essential.
👉 Tactical takeaway: Wait for a breakout from the triangle before committing directionally.
USOIL Bearish Reversal & Selling OpportunityUSOIL (WTI Crude Oil) – Bearish Setup Analysis
The chart shows a clear bearish structure with multiple confirmations:
Trendline Rejection & Break: Price rejected from the upper rejection line and later broke the rising trendline, confirming bearish momentum.
FVG (Fair Value Gap) Selling Zone: Price retested the imbalance zone (63.53–63.94), creating a strong selling opportunity.
EMA Confluence: Both the 70 EMA and 200 EMA are above the price, acting as dynamic resistance, supporting bearish bias.
Market Structure Shift (MSS): Breakdown of higher lows signals shift to bearish structure.
Target: Downside continuation expected towards 61.65, the next liquidity and support zone.
Stop Loss: Above 63.94 (selling zone invalidation).
📉 Strategy: Look for sell entries around 63.53–63.94 zone, with target at 61.65 and stop loss above 63.94.

USOIL is taking support at lower levels and making higher highsThe trading signal for USOIL has been triggered. The asset has demonstrated consistent support near the 65.5 price level, exhibiting this pattern of support three times previously, each instance resulting in the formation of a higher high. Currently, USOIL is once again showing support at this crucial level. Therefore, I recommend initiating a bullish or long trade position, with a suggested entry point around the 65.75 mark.
CRUDEHello & welcome to this analysis
USOIL / CRUDE (MCX) after a very sharp rally till the slanting channel have now retraced to very strong support levels as per the ICHIMOKU indicator in daily time frame.
One could look for a 4hrs reversal candle confirmation between $64.50 - 63.75 / INR 5625 - 5450 for a resumption of rally till $77 / INR 6900 with resistance on its path at $68.50 & $74 / INR 5825 & INR 6400
Remember enter only after you get a bullish candle confirmation from lower time frame.
All the best

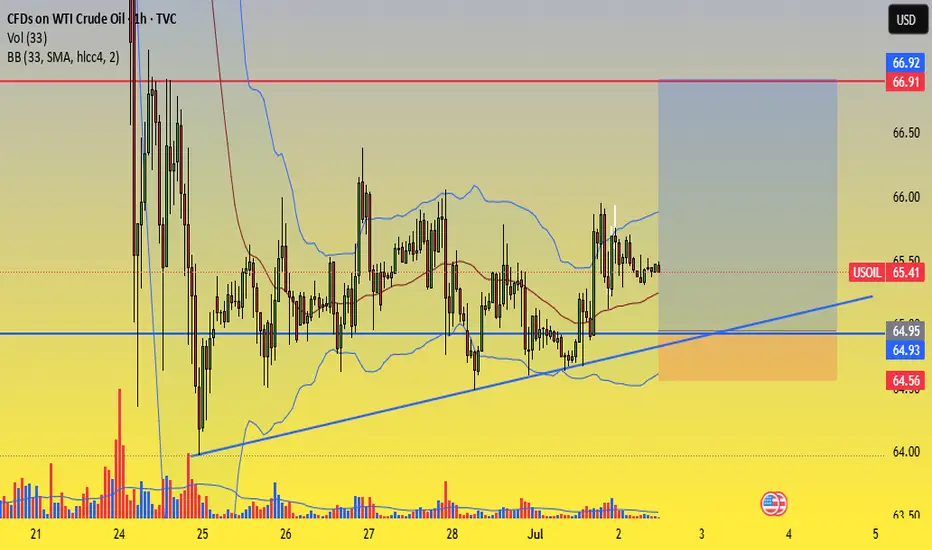
Trade Recommendation – BUY WTI Crude Oil (USOIL) – Entry #2✅ Trade Recommendation – BUY WTI Crude Oil (USOIL) – Entry #2
📅 Date: July 3–4, 2025
🕒 Timeframe: 1H
🎯 Trade Setup:
Entry Zone: 66.30 – 66.40 USD/barrel (short-term support and EMA20 zone)
Stop Loss (SL): 65.60 USD (below MA200 and previous bullish candle base)
Take Profit (TP):
• Target: 68.40 – 68.50 USD
📊 Technical Analysis:
Healthy pullback after a strong bullish breakout — price is currently consolidating around EMA20, potentially forming a new upward leg.
Volume surged during the July 2–3 breakout, indicating strong institutional buying interest.
Price structure: Clear uptrend with higher highs and higher lows.
Bollinger Bands: Price touched the upper band and is now retracing to the mid-band — a common continuation pattern.
EMA20 is acting as dynamic support.
🧭 Strategy Notes:
Wait for price to retrace into the 66.30 – 66.40 zone with a confirmation signal (e.g. bullish pin bar or engulfing candle).
Consider scaling in and holding the position toward the resistance area of 68.40 – 68.50.
Cut loss if price breaks below 65.60 and invalidates the current bullish structure.
fl me & ytb, winrate 90%! Thank

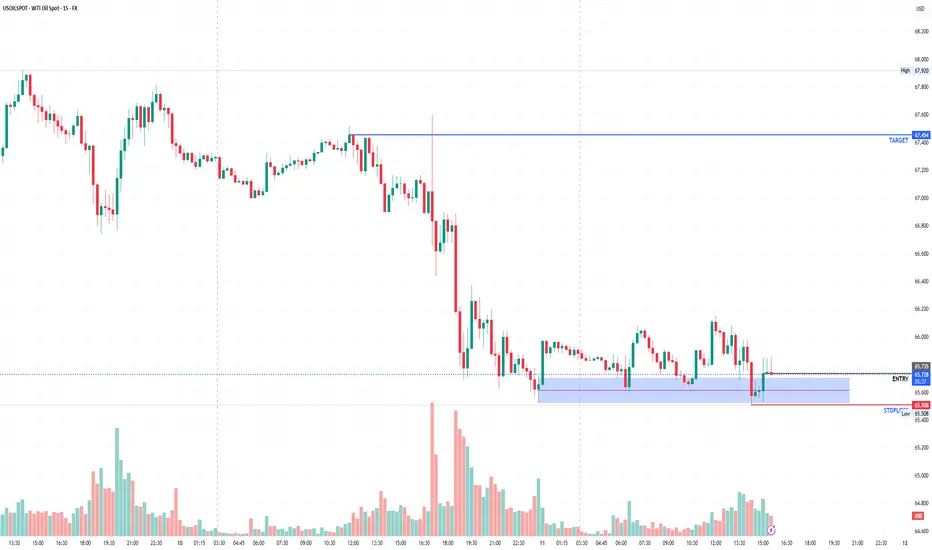
Trade Setup – BUY WTI Crude Oil (USOIL)✅ Trade Setup – BUY WTI Crude Oil (USOIL)
📅 Date: July 2–3, 2025
🕒 Timeframe: 1H
🎯 Trade Parameters:
Buy Zone (Entry): 65.00 – 64.90 USD/barrel
Stop Loss (SL): 64.55 USD (below rising trendline and lower Bollinger Band)
Take Profit (TP):
• TP1: 66.50 USD
• TP2: 67.00 USD
📊 Technical Analysis Highlights:
Rising trendline from June 24 continues to hold, forming a solid support area around 64.9–65.0.
Bollinger Bands are narrowing, indicating potential volatility expansion. Price is consolidating near the mid-band (MA20), often a precursor to bullish breakout.
Volume shows signs of accumulation around the trendline, suggesting buying interest at key support.
Multiple rejections from 64.90 without breakdown reinforces this level as near-term support.
🧭 Strategy Notes:
Enter on price pullback to the 65.00–64.90 zone with confirmation (e.g. bullish pin bar, engulfing pattern, volume spike).
Suggested position management:
• Take 50% profit at 66.50
• Hold the remaining 50% toward 67.00 if momentum is strong.
If price breaks below 64.55 with strong volume, exit the trade to preserve capital.
Good luck Everybody! Fl me here and ytb ! Thanks

CRUDE LONG at 73.08 spotSL is 72.
CRUDE get some support at 73.08 in hourly chart.
Target could be 76.
1:2

CrudeOil in major resistance area may give breakout*$$CrudeOil is trading near major resistance area with positive news around the world for it. If Iran block Strait of Hormuz then it will give breakout from this area for target of 6655-6722 area & then 6988, 7301, 7500,7750.
If Iran problem solved with USA then it may fall also from this resistance area with fast momentum for target of 6033, 5633, 5155, 4733.
Please consult your advisor before taking any trade & with proper risk management.
Thank You

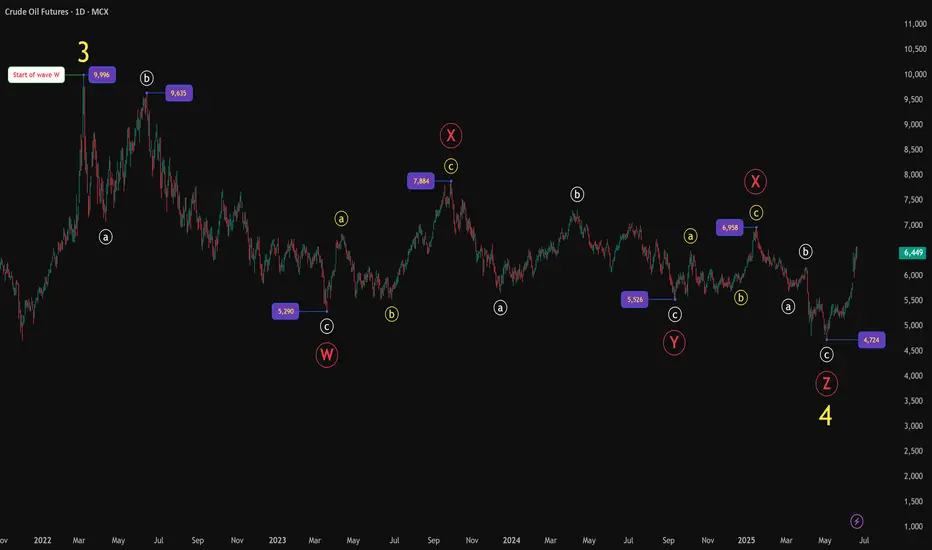
MCX Crude Oil: Complex Correction Complete?Big Picture Structure — Daily Timeframe
After peaking at 9996, Crude Oil entered a prolonged complex corrective phase, unfolding as a W-X-Y-X-Z structure, reflecting a Elliott Wave complex correction pattern.
Wave W formed via an initial abc decline.
Wave X delivered a corrective bounce.
Wave Y unfolded into another abc leg down.
A second X followed, creating further complexity.
Finally, Wave Z completed with a terminating abc decline, bottoming near 4724.
With this, the entire larger degree Wave 4 correction appears to have completed, setting the stage for a potential higher-degree advance.
Zoom In — 4H Timeframe Analysis
Zooming into the rally from 4724, price action unfolds very cleanly:
A strong 5-wave impulsive advance has developed.
Wave 3 displayed strong extension — a healthy sign of impulsive strength.
Wave 5 pushed to a higher high near 6585, completing a likely Wave (1) at smaller degree.
Notably, the final leg of this upmove developed with RSI bearish divergence, often an early warning of short-term exhaustion, suggesting a corrective Wave (2) pullback may now be developing.
Outlook Ahead
With higher degree Wave 4 likely behind us, attention shifts to the ongoing development of the larger degree Wave 5.
A corrective Wave (2) pullback may offer attractive entry zones for the next bullish impulsive leg.
As long as price maintains structural integrity above the 4724 low, the broader bullish outlook remains intact.
Summary
Complex W-X-Y-X-Z correction likely complete.
New bullish sequence underway.
Short-term corrective pullback (Wave 2) anticipated.
RSI divergence signals caution for immediate upside, but larger bullish trend remains intact.
Chart will be updated as price action evolves.
Disclaimer :
This analysis is for educational purposes only and does not constitute investment advice. Please do your own research (DYOR) before making any trading decisions.
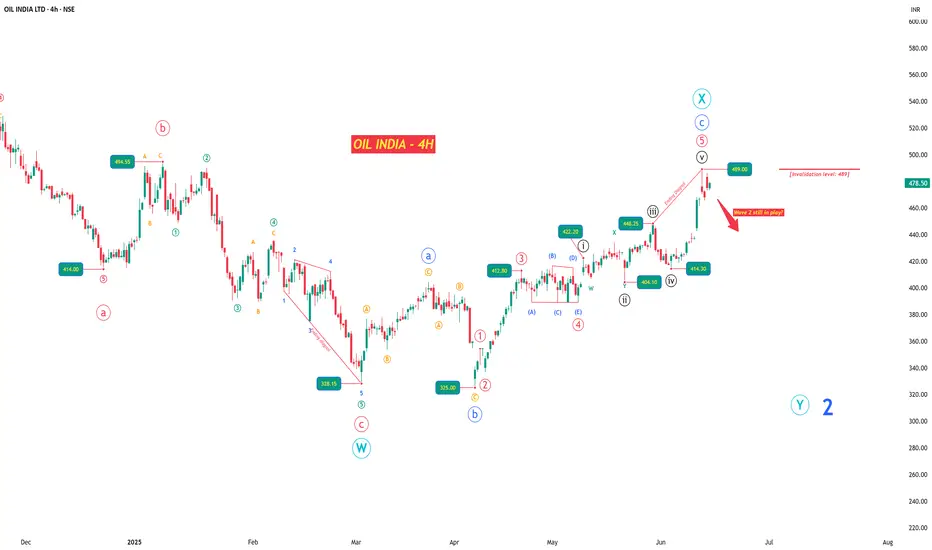
OIL INDIA LTD – Structure Tiring as Crude Starts Firing?What began as a heroic rally from ₹42 to ₹767 in a powerful impulse now finds itself wobbling under its own weight. OIL INDIA LTD’s chart tells a story of exhaustion — both structurally and contextually — just when crude oil is flexing again on the global stage.
Amid rising geopolitical tensions and war-like murmurs pushing crude prices higher, the Indian oil sector may be sailing into headwinds. And this isn’t just a macro hunch — the waves themselves are flashing caution.
After a Wave 1 climax near ₹767.90, price action has shifted into a corrective mode. I interpret the ongoing structure as a W-X-Y double zigzag , and within it, a key event unfolded: a classic ABC flat correction, beginning in March.
The April rally — which at first glance looks like a fresh impulse — is in fact the C leg of that flat. While it did unfold in 5 waves, the fifth wave formed an ending diagonal , complete with overlapping internals and fading momentum. This could be the last gasp .
Zooming into the 4H chart, the rise from ₹325 to ₹489 fits neatly into a corrective framework, not an impulsive one. That makes ₹489 a crucial invalidation level . If price stays below it, we likely begin Wave Y of the broader correction — a move that could push OIL INDIA back toward or even below ₹325.
However, if price breaches ₹489 and sustains, that’s your early signal that this entire bearish setup is off, and a new bullish sequence may be unfolding instead.
The stop-loss is tight, the downside wide. If this count holds, the risk-reward setup is highly favorable.
Further analysis continues in the notes below — covering multi-timeframe wave counts, internal structures, and confluences from RSI, volume, and Bollinger Bands.
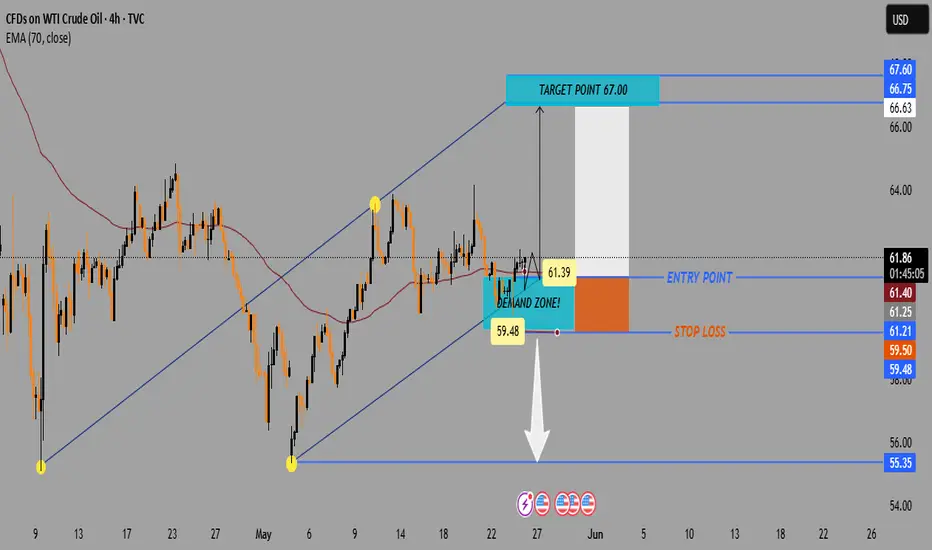
WTI Crude Oil 4H Chart – Bullish Setup from Demand Zone📈 Current Price: $61.74
🔵 Key Zones & Levels
🔹 Demand Zone (Buy Area):
🟦 $59.48 – $61.39
→ Price expected to bounce here
→ 🔄 Potential reversal zone
🔹 Entry Point:
🎯 $61.39
→ Ideal level to enter LONG
→ Just above demand zone
🔹 Stop Loss:
🛑 Below $59.48
→ Exit if price drops here
→ Protects capital
🔹 Target Point:
🚀 $67.00
→ Profit-taking zone
→ Strong resistance zone nearby:
* 66.63
* 66.75
* 67.60
📊 Indicators
📍 EMA (70): 🔴 61.40
→ Price trading above = bullish signal
→ EMA acting as support
📏 Trendline Channel:
🔼 Higher highs & higher lows
→ Supports uptrend continuation
📌 Trade Plan Summary
* Bias: 📈 Bullish
* Buy: At 61.39
* Stop: Below 59.48 🛑
* Target: 67.00 🎯
* Risk-Reward: ✔️ Favorable (~1:3)
🔍 What to Watch
* ✅ Bullish candles in demand zone
* 🔁 Retest of EMA or lower channel
* ❌ Avoid if it breaks below $59.48
Crude may bounce up to 5522 level.Crude oil is on bounce, As per chart Crude is showing divergence with morning start. It is at demand zone and add more if come down to 4900 level. It may test minimum 5522 level soon.

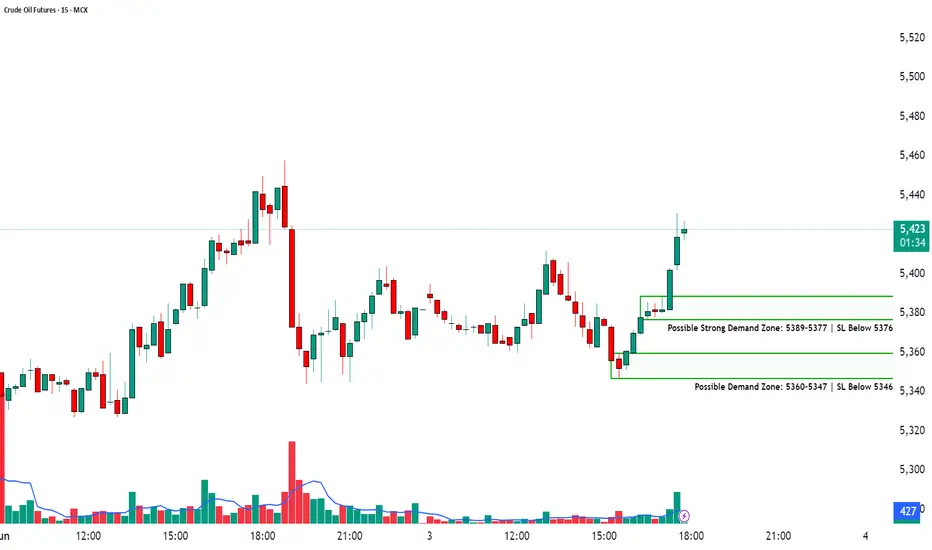
Demand Zone Breakdown + Trade Strategy📈CRUDE OIL FUTURES | 15-Min Chart Analysis
📆Date: June 3, 2025
Ticker: MCX:CRUDEOIL!
Chart Overview:
The chart highlights a bullish reversal from previously marked demand zones. Price sharply bounced with volume confirmation, indicating renewed buying interest.
Two demand zones have been marked for observation:
Possible Strong Demand Zone: ₹5389–5377 | SL Below ₹5376
Possible Demand Zone: ₹5360–5347 | SL Below ₹5346
Price is currently trading around ₹5,425, showing a significant up move post-demand zone test, suggesting buyer dominance in the short term.
Demand Zone Breakdown:
🟩🟩 Strong Demand Zone (₹5389–5377):
Strong volume-backed bullish engulfing formed after price dipped here.
Ideal zone for aggressive long entries with SL below ₹5376.
🟩 Lower Demand Zone (₹5360–5347):
Acts as deeper support and a conservative re-entry zone.
Long entries possible with SL below ₹5346 if retested.
How to Trade Demand Zones (Long Trade):
Wait for a retest of the zone.
Watch for bullish confirmation candles (hammer, bullish engulfing, etc.).
Enter long near the bottom of the zone.
Place SL just below the demand zone.
Stop-Loss Placement:
For Strong Demand Zone: SL below ₹5376
For Lower Demand Zone: SL below ₹5346
Targets: Use Risk-Reward Ratio
🎯 Use a 1:2 or 1:3 RRR to set logical target levels.
📌 Example: If risk is ₹10, target should be ₹20–₹30 above entry.
💡 Why Use Risk-Reward?
Sets clear and objective targets
Keeps emotions out of trading decisions
Helps maintain long-term profitability with disciplined risk control
⚠️ Risk Management Tip:
Always trade with a clearly defined stop-loss. Avoid impulse entries. Start with small quantities and increase size only with confirmation. Capital protection comes first.
📢 Disclaimer
This post is intended for educational and informational purposes only. It does not constitute investment advice or trade recommendations. Trading in commodities and financial markets involves risk. Please consult a SEBI-registered advisor before making financial decisions. The author is not SEBI registered and shall not be liable for any losses. Always use proper risk management and do your own research.
👉 Follow for more trade setups, chart breakdowns, and educational content to improve your trading edge. Stay informed. Trade smart. 📊📈
Major trend view for USOILAre we looking at a similar but mirrored bar pattern from 2008 to 2014?
Similarities:-
1. Impulse and steep wave.
2. Consolidation in the format of a triangle.
On the breakout, we had another fall equivalent to 61.8% of the impulse wave. If we are witnessing the same pattern, then on the breakout of this triangle consolidation, we will have the USOIL prices at $135 in the coming years. It shall be by the end of 2028!
PS: This chart is just for analysis purposes. When we know the major trend, we can position our trades carefully.

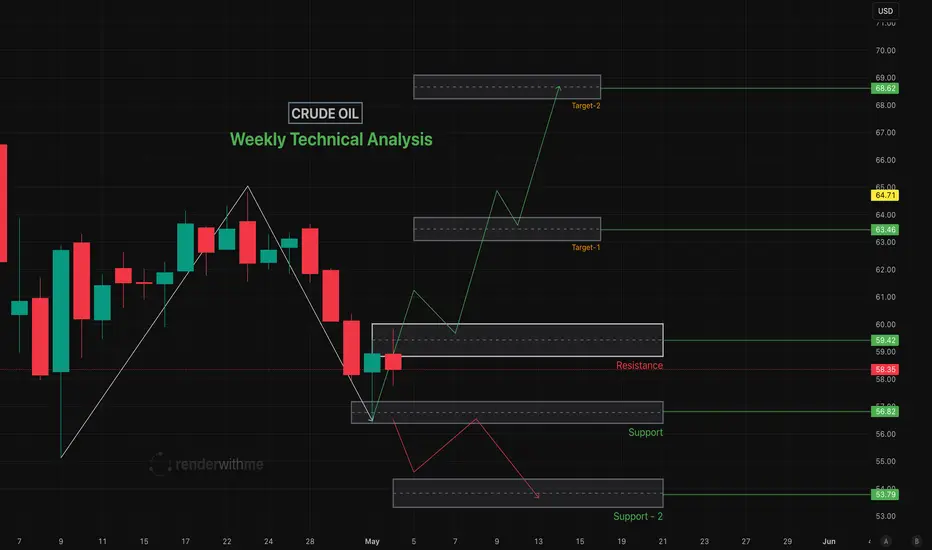
Crude Oil Technical Analysis for the Week of May 11–May 15, 2025nothing much to say Chart speaks itself
Chart for your reference
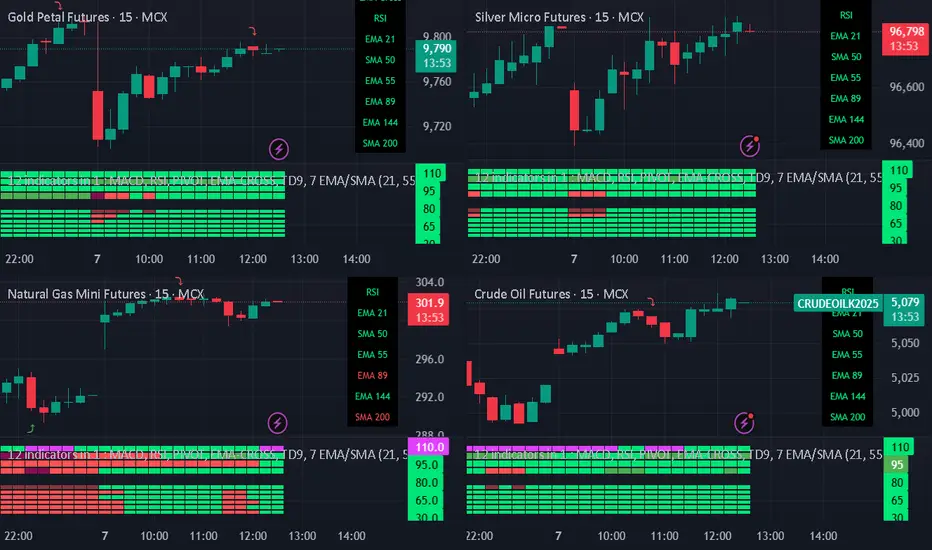
Best Commodity layoutBest Commodity layout
Crafting Your Optimal Commodity Technical Chart Layout in TradingView
The "best" commodity technical chart layout in TradingView is highly personalized, depending on your trading style, strategy, and the specific commodities you're analyzing. However, a well-structured layout should provide a clear, comprehensive view of price action and key technical indicators to aid in decision-making.
Here's a guide to creating an effective commodity technical chart layout in TradingView, incorporating common practices and versatile tools:
1. Choosing Your Main Chart Type:
Candlestick Charts: This is the most popular choice for most traders. Candlesticks provide detailed information about the open, high, low, and close (OHLC) prices for a specific period, making it easier to identify patterns and market sentiment.
Bar Charts: Similar to candlesticks, bar charts also display OHLC data but in a different visual format.
Line Charts: Useful for a quick overview of the overall trend, typically plotting the closing prices.
Heikin Ashi: These charts can help filter out market noise and make trends easier to identify by averaging price data.
Renko or Kagi Charts: These focus solely on price movement, ignoring time, and can be useful for identifying support and resistance levels.
Recommendation: Start with Candlestick charts for their detailed information. You can always switch to other types for different analytical perspectives.
2. Essential Technical Indicators for Commodities:
While the "best" set of indicators is subjective, here are some widely used and effective ones for commodity analysis in TradingView:
Moving Averages (MAs):
Types: Simple Moving Average (SMA) and Exponential Moving Average (EMA) are common. EMAs react faster to recent price changes.
Use: Identify trend direction, support/resistance levels, and potential crossover signals. Common periods include 20, 50, 100, and 200.
Layout: Add 2-3 MAs of different lengths directly onto your main price chart. For example, a 21-period EMA for short-term trends and a 50-period EMA for medium-term trends.
Volume Indicators:
Types: Volume (displays trading activity) and On-Balance Volume (OBV).
Use: Confirm the strength of price movements. A significant price move accompanied by high volume is generally considered more valid.
Layout: Typically displayed in a separate pane below the main price chart.
Oscillators (for identifying overbought/oversold conditions and momentum):
Relative Strength Index (RSI): Measures the speed and change of price movements. Values above 70 often indicate overbought conditions, while below 30 suggest oversold conditions. Standard period is 14.
Moving Average Convergence Divergence (MACD): Shows the relationship between two moving averages of an asset's price. It consists of the MACD line, signal line, and histogram.1 Used for trend identification and momentum.
1.
medium.com
medium.com
Stochastic Oscillator: Compares a particular closing price of an asset to a range of its prices over a certain period. Also used to identify overbought/oversold conditions.
Commodity Channel Index (CCI): Identifies cyclical trends and can signal overbought/oversold levels.
Layout: Oscillators are usually placed in separate panes below the main chart. You might choose 1 or 2 that best suit your strategy (e.g., RSI and MACD).
Volatility Indicators:
Bollinger Bands: Consist of a middle band (typically an SMA) and two outer bands representing standard deviations. They help identify volatility and potential price breakouts or mean reversion.
Keltner Channels: Similar to Bollinger Bands but use Average True Range (ATR) for the outer bands. Can be used for breakout and trend-following strategies.
Average True Range (ATR): Measures market volatility. Useful for setting stop-loss orders.
Layout: Bollinger Bands and Keltner Channels are overlaid on the main price chart. ATR is usually in a separate pane.
Trend-Following Indicators:
Ichimoku Cloud (Ichimoku Kinko Hyo): A comprehensive indicator that defines support/resistance, identifies trend direction, and provides trading signals. It includes several components like the Kumo (Cloud), Tenkan-sen, and Kijun-sen.
Donchian Channels: Plots the highest high and lowest low over a set period. Useful for identifying breakouts and trend direction.
Layout: Ichimoku Cloud and Donchian Channels are overlaid on the main price chart.
Recommendation for a Balanced Layout:
Main Chart: Candlesticks, 2-3 EMAs (e.g., 21, 50, 200), Bollinger Bands or Keltner Channels.
Pane 1 (below main): Volume.
Pane 2 (below main): RSI (14) or MACD.
Pane 3 (optional): CCI or ATR if your strategy heavily relies on them.
3. Drawing Tools:
Effective use of drawing tools is crucial for technical analysis:
Trendlines: Connect swing highs or lows to identify the direction and strength of trends.
Support and Resistance Levels: Horizontal lines drawn at key price levels where the price has historically struggled to break above (resistance) or fall below (support).
Fibonacci Retracement and Extension Levels: Help identify potential support/resistance levels and price targets based on Fibonacci ratios.
Channels: Parallel trendlines that can define a price range.
Chart Patterns: Use tools to identify patterns like head and shoulders, triangles, flags, and pennants.
Layout Tip: Keep your most frequently used drawing tools easily accessible in the TradingView drawing panel.
4. Multi-Timeframe Analysis & Multi-Chart Layouts:
Analyzing commodities across different timeframes can provide a broader market perspective. TradingView allows you to set up multi-chart layouts (the number of charts available depends on your subscription plan).
Common Setup:
Chart 1 (Long-Term): Weekly or Daily chart to identify the major trend.
Chart 2 (Medium-Term): 4-hour or Daily chart for more detailed trend analysis and identifying key levels.
Chart 3 (Short-Term): 1-hour or 15-minute chart for entry and exit signals.
Synchronization: TradingView allows you to synchronize symbols, crosshair, interval, and drawings across multiple charts in a layout, which can be very efficient.
5. Customization and Saving Your Layout:
Appearance: Customize chart colors (background, candles, grids), scales, and lines to your preference for better visual clarity and reduced eye strain. Access these via Chart Settings (the gear icon).
Saving Layouts: Once you have a setup you like, save it as a chart layout in TradingView. You can create multiple layouts for different commodities, strategies, or analytical purposes.
Indicator Templates: Save combinations of indicators as templates for quick application to new charts.
Tips for the "Best" Layout:
Keep it Clean: Avoid cluttering your chart with too many indicators. Focus on a few that you understand well and that complement your strategy.
Consistency: Use consistent settings for your indicators across different charts and timeframes.
Practice: The "best" layout is one that works for you. Experiment with different indicators and setups on a demo account or through backtesting to see what yields the best results for your trading style.
Stay Informed: Be aware that some commodities (e.g., agricultural products) can be influenced by seasonal patterns or specific reports (like USDA reports for crops, EIA for oil). While not a direct part of the "chart layout," integrating this knowledge with your technical analysis is crucial. TradingView has features to display key events like earnings reports or dividends, which can be relevant. Some community scripts on TradingView even offer overlays for planting and harvesting seasons for agricultural commodities.
By following these guidelines and experimenting to find what suits your individual needs, you can create a powerful and effective commodity technical chart layout in TradingView. Remember to regularly review and refine your layout as your trading strategies evolve.
USOIL at support range $56.56 to $56USOIL is at a major support level at $56.56 to $56, and the price is breaking this level. It will target downside levels of 50.53, 41.15, 31.90, and 36.08, respectively.
Price bouncing from this point will retest $62.99 and $73.88 as respective targets.
Prices may fall mostly for downside targets here.

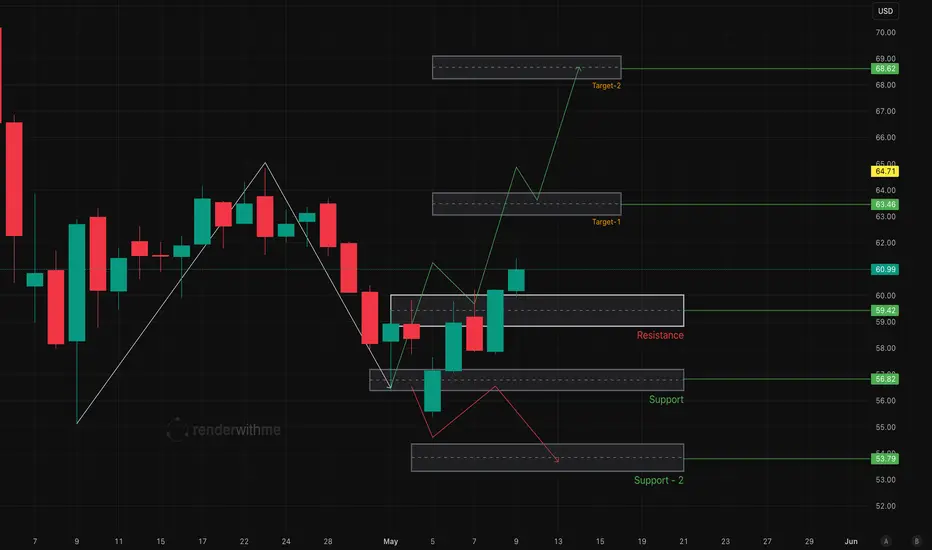
Crude Oil Technical Analysis for the Week of May 5–May 9, 2025Forecast for Next Week
Bearish Scenario (Higher Probability):
Trigger: Failure to reclaim $61.60 or a break below $56.
Targets: $55.05 (April 9 low), $52.53, or $49-$43 if the 4-year support at $64 breaks.
Rationale: Bearish MACD cross, descending channel, and OPEC+ production increase fears.
Bullish Scenario (Lower Probability):
Trigger: A hold above $57.08-$56.53 with a bullish reversal pattern (e.g., Bullish Engulfing) or OPEC+ signalling tighter supply.
Targets: $63.90, $65.81 or $68 (14-day forecast).
Rationale: Oversold RSI and potential demand zone support.
Range-Bound Scenario: If prices stay between $57.00-$60.60, expect choppy trading as the market awaits clarity from OPEC+ and economic data.