Sensex - Expiry day analysis Jan 22The price faced resistance at the 84100 zone and was falling for a few days. Now it is having a pullback from the 81100 zone. 82000 can act as resistance as it coincides with the trend line resistance.
Buy above 82040 with the stop loss of 81880 for the targets 82180, 82300, 82460, 82600 and 82780.
Sell below 81700 with the stop loss of 81860 for the targets 81560, 81400, 81240, 81080 and 80900.
As per the daily chart, the price is testing the trend line support.
Always do your analysis before taking any trade.
Community ideas

BTC Compression Phase: Where Smart Money Builds Positions!Hey guy's, When I look at this chart, I’m not seeing fear or trend failure.
I’m seeing something far more important, controlled compression above demand .
Bitcoin has pulled back, swept liquidity, and is now holding above a clearly defined demand area while volatility keeps contracting.
This kind of behaviour rarely appears during panic.
It usually appears when the market is absorbing supply quietly .
What I’m seeing on the chart:
Price is still respecting the ascending demand structure , which tells me higher-timeframe buyers are active and defending key levels.
The recent move cleaned out weak hands below demand , but price did not accept lower, a classic liquidity sweep, not a breakdown.
Supply is visible above , which explains why price is compressing instead of expanding immediately. Sellers are present, but they are not overpowering buyers.
The range between ascending demand and overhead supply is tightening . This is where impatience builds, and where strong positioning usually happens.
The psychology part (this matters):
This phase feels uncomfortable.
Price isn’t doing much.
Both sides are frustrated.
And that’s usually a clue.
If Bitcoin wanted to break structure, it had a clean opportunity below demand.
It didn’t take it.
That tells me sellers are getting weaker, not stronger.
So my thinking stays simple:
I don’t want to chase upside after expansion.
I don’t want to panic into a sell-off that already swept liquidity.
I want to watch how price reacts around demand, because this is where real decisions are made.
As long as structure holds:
Pullbacks into the 88k–87k demand zone remain high-probability reaction areas.
Compression above demand keeps the door open for a mean-reversion move toward higher levels.
Only a clean breakdown and acceptance below ~84k would invalidate this structure.
Until then, I’m not trying to predict the next candle.
I’m trying to read behaviour .
Markets don’t move when everyone is excited.
They move when most people get bored, confused, or impatient.
Disclaimer:
This analysis is for educational purposes only. Not financial advice. Always manage risk and trade according to your own plan.

Option TradingRetail and Institutional Option Trading
Retail traders usually focus on buying options, hoping for fast price movement. Institutions, on the other hand, mostly sell options because time decay (Theta) works in their favor.
Key differences:
Retail traders chase momentum and news
Institutions focus on probability, statistics, and data
Retail uses indicators
Institutions use Option Chain, OI, volume, and volatility
Retail looks for big wins
Institutions look for consistent returns
Institutions understand that 90% of options expire worthless, which is why option writing dominates institutional strategies.

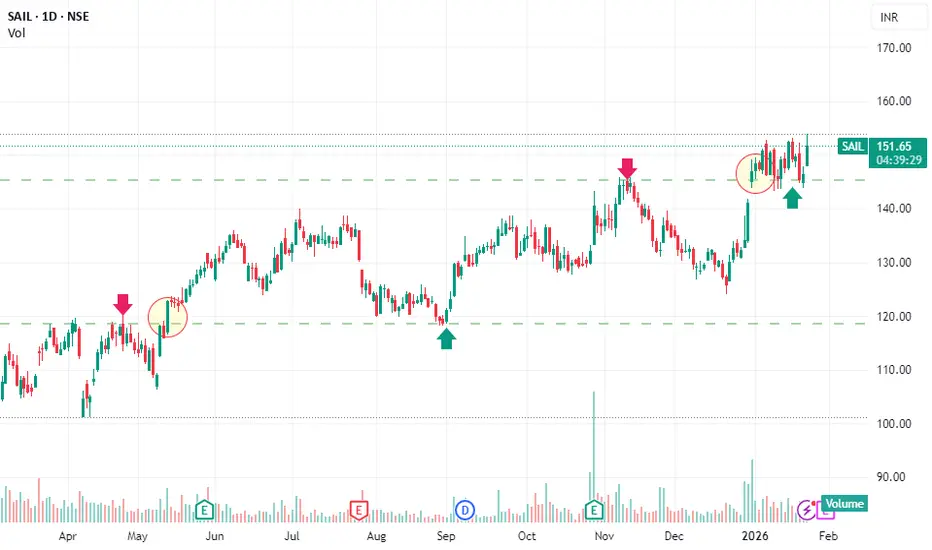
SAIL – Retest of Previous Breakout Turned Support
SAIL has successfully taken support at its previous breakout zone, which is a classic sign of strength. After breaking above the earlier resistance, the stock retraced back to the same level, where buyers defended the price, confirming the breakout’s validity.
Following this breakout–retest formation, SAIL has now started moving upward, indicating renewed buying interest and continuation of the bullish trend.
Technical Highlights:
Previous resistance has turned into strong support
Retest held without breakdown, showing bullish structure intact
Price action suggests higher-high and higher-low formation
Momentum is shifting back in favor of bulls
Conclusion:
As long as SAIL holds above the breakout support zone, the upside bias remains positive. The current move indicates a potential continuation of the ongoing uptrend, with higher levels likely in the coming sessions.
Jammu & Kashmir Bank (J&KBANK) By KRS CHARTS22nd January 2026 / 9:36 AM
Why J&KBANK ?
1. Clear Trend is visible with all the parameters.
2. 4th Wave Retracement was healthy enough to continue further for 5th .📈
3. Smaller TF Flag Breakout with Accumulations is visible at the bottom of 4th wave.
4. Favorable R/R min 1:3.
5. Stock is sustaining above 100 EMA in Major Time frames.
Targets are mentioned with SL below Flag ✅

Buy Dixon, W4 of Primary degree completionDixon completed W3 of Primary degree on 17 Dec 24 and ever since has been undergoing correction / forming W4 of Primary degree. The original thought was it was forming zigzag.
It completed Wave A on 7 Apr 25 and had a very good retracement of over 90% for Wave B (hence a flat) and completed same on 25 Sep 25 and started forming Wave C.
As per wave markings given in the chart, it is likely that stock has completed W5/Wave C at 50% of the overall length of W1-3 and took support at subwave iv of W3 region of the original impulse. This is also a general guideline under wave theory. (W4 tend to register their maximum retracement within the span of travel of the previous fourth wave of one lesser degree, most commonly near the level of its terminus).
Wave C has formed lower low than Wave A of the zigzag
RSI has formed clear divergence
Good support zone.
Buy with a stop loss below of 10,600. Target previous highs (medium term target).

XAUUSD 1D T/F ANALYSIS----
xauusd 1d t/f analysis-----previous whole demand will be completes so wait for making a red candle on reversal area then we can se marked supply 50 and full zone from trending support area let`s see---

GOLD (XAU/USD) – Bullish Continuation Toward Premium Zone🔍 Technical Analysis Breakdown
Market Structure: Clear bullish structure with higher highs & higher lows intact ✔️
Trendline: Price continues to respect the ascending trendline, confirming strong upside momentum 📈
Breakouts: Multiple confirmed bullish breakouts from consolidation and range zones 🔓
Volume: Strong bullish volume expansion during impulsive moves, validating institutional participation 💥
POI (Point of Interest): Repeated reactions from POI zones, acting as reliable demand areas 🎯
Pivot Point: The green pivot zone is holding as dynamic support after the pullback 🟩
Pullback: Current retracement is corrective and healthy, indicating accumulation before continuation 🔄
🎯 Targets & Trade Projection
Primary Target (TP1): 🟢 4,850 – 4,860
Extended Target (TP2): 🟢 4,890 – 4,920 (premium supply / liquidity zone)
Bullish Continuation Zone: Grey consolidation box → expected higher-low formation then expansion ⬆️
🛑 Invalidation / Risk Level
Bias invalidated below: ❌ 4,740 – 4,720 (High Pivot / trendline break)
✨ Trade Bias: Bullish Continuation
📍 Strategy: Buy pullbacks above pivot | Hold longs while trendline holds
📌 Key Message:
As long as GOLD holds above the pivot point + rising trendline, the path of least resistance remains upward toward the marked targets 🚀💰

XAUUSD (Gold) – Short-Term Bullish Rebound Within Broader ConsolPrice Action
Gold has rebounded from the recent swing low near 4775–4780, forming higher lows.
Price is moving along an ascending trendline (blue dashed line), indicating short-term bullish momentum.
However, the broader structure still looks like a range / consolidation after a prior impulsive move.
RSI (14)
RSI is around 54, back above the mid-line (50).
Earlier bearish RSI divergence played out, but momentum is now recovering, suggesting buyers are regaining control.
No overbought condition yet → room for further upside.
Awesome Oscillator (AO)
AO remains below zero, but red bars are shrinking.
This signals waning bearish momentum and a potential shift toward bullish pressure.
MACD (12,26,9)
MACD is still slightly below the signal line, but histogram is contracting upward.
Early signs of a bullish crossover forming if momentum continues.
Key Levels
Immediate Support: 4800 / 4775
Trend Support: Rising trendline from recent low
Resistance: 4850 → 4875
Upside Extension: 4900+ if bullish continuation confirms

Gold Analysis & Trading Strategy | January 21-22✅ 4-Hour Chart (H4) Analysis:
Gold has maintained a strong upward structure since launching from the 4537 area, with both highs and lows continuing to rise, confirming that the overall bullish trend remains intact. After reaching the 4888 area, upside momentum has started to slow, and price has entered a phase of high-level consolidation and technical correction. Although the moving average system (MA5 / MA10 / MA20) remains in a bullish alignment, the market clearly needs to digest the previous rapid advance. As a result, this is no longer an ideal stage to chase longs; a more reasonable approach is to wait for pullbacks before reassessing new trend-following opportunities.
✅ 1-Hour Chart (H1) Analysis:
On the short-term timeframe, price formed a temporary top near 4888 and has since entered a corrective phase, gradually pulling back toward short-term moving averages and the rising trendline. This movement is considered a normal correction within a broader bullish trend. As long as price holds above the 4800–4790 zone, the overall structure remains strong and the pullback can be viewed as a consolidation phase. However, a decisive break below this support area would increase the risk of a deeper correction and require tighter risk management.
🔴 Resistance Levels: 4850–4865 / 4888–4906
🟢 Support Levels: 4820–4800 / 4790–4775 / 4695–4700
✅ Trading Strategy Reference:
🔰 Trend-Following Approach (Primary Strategy)
📍 Wait for price to pull back into the 4820–4800 / 4790 zones
📍 After stabilization signals appear, attempt light, staggered long positions
Condition: The H1 structure remains intact
🔰 Defensive Approach (Risk Control)
📍 If price breaks below 4790 and fails to recover quickly
📍 Decisively reduce exposure or exit positions and wait for new structural confirmation
✅ Trend Summary:
👉 Medium-term trend (H4): Bullish trend remains intact, but price has entered a high-level consolidation phase
👉 Short-term condition (H1): Corrective pullback + cooling momentum
👉 Core strategy: Do not chase highs; focus only on pullback structures
👉 Key defense zone: 4800–4790 — a clear break below requires heightened caution

Just a national level tug of war || XAUSDAs of January 21, 2026, gold has smashed through several record highs, recently trading above $4,800 per ounce (and over ₹1,50,000 per 10 grams in India). This "uninterrupted uptrend" is being driven by a rare combination of geopolitical shocks and shifts in the global financial system.
To help you make sense of it, here is a breakdown of the four "pillars" driving today's market:
1. The "Greenland Factor" and Trade Wars
The most immediate cause of the current price surge is a massive diplomatic and trade standoff.
Geopolitical Friction: Tensions have escalated following U.S. President Trump’s pursuit of acquiring Greenland. This has led to a "transatlantic trade conflict" with Europe.
Tariff Threats: The U.S. has announced 10% tariffs on several European countries (like France, Germany, and the UK) starting February 1, with threats to raise them to 25% by June.
Impact: Whenever the world’s biggest economies fight, investors panic and "flight to safety"—which means buying gold.
2. Central Banks are "De-Dollarizing"
For the first time since 1996, gold now accounts for a larger share of global central bank reserves than U.S. Treasuries.
Record Buying: Central banks (led by Poland, China, and India) are buying gold at a historic pace to diversify away from the U.S. dollar.
The "Hedge" Strategy: Central banks view gold as the ultimate insurance policy against currency sanctions or a potential collapse of the fiat currency system.
3. Economic Volatility (Inflation & Interest Rates)
Weakening Dollar: The U.S. dollar has faced significant pressure in early 2026. Because gold is priced in dollars, a weaker dollar makes gold cheaper for international buyers, driving up demand.
Interest Rates: While the Federal Reserve has been hesitant to cut rates aggressively, the market is pricing in "lower for longer" yields. Since gold doesn't pay interest, it becomes much more attractive when bonds and savings accounts offer lower returns.
4. Supply and Demand Imbalance
Limited Mining: New gold discoveries are at a standstill. Mining output is only growing by about 0.3% per year, which isn't enough to keep up with the massive surge in investor demand.
Investment Inflows: Gold ETFs (Exchange Traded Funds) saw record-breaking inflows in late 2025 and early 2026, as even retail investors began treating gold as a primary wealth-protection asset rather than just a side investment.

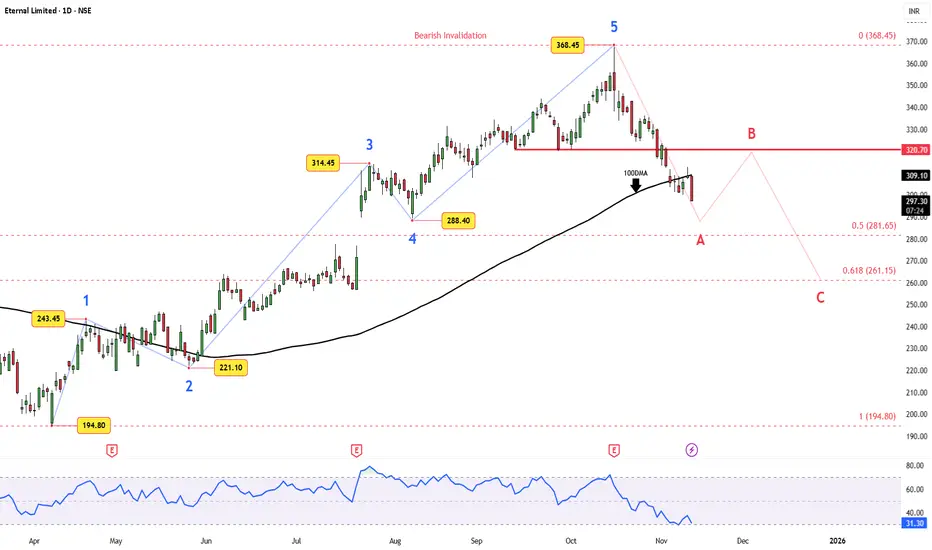
Eternal (Zomato) – 5-Wave Rally Meets a Reality CheckEternal (Zomato) appears to have completed a clean 5-wave impulse from ₹194 → ₹368.45 and is now shifting into a corrective phase.
Technical Setup:
Wave A is unfolding with price slipping below the 100DMA. A temporary Wave B rebound toward ₹320–₹325 could precede another decline toward ₹281–₹261 — aligning with 0.5–0.618 retracement levels.
The corrective bias holds unless ₹368.45 is decisively reclaimed.
Fundamental Snapshot:
The FY25 data shows revenue growth of 67% YoY , reaching ₹202.4B — impressive, but free cash flow plunged 82% , and long-term debt has been fully paid off. Despite a market cap near ₹2.94T, the P/E ratio remains sky-high (~1474) , hinting at over-optimism.
That combo — stretched valuation + slowing FCF momentum — supports the case for a technical pullback before the next sustained trend resumes.
Trade View:
Short-term corrective tone stays intact. Watch ₹320–₹325 for a possible lower high; deeper retracement likely toward ₹280–₹260 zone.
Invalidation: ₹368.45
Disclaimer: This analysis is for educational purposes only and does not constitute investment advice. Please do your own research (DYOR) before making any trading decisions.
Geopolitical tensions || XAUSD-Goldcurrent market data for January 22, 2026, gold prices are experiencing a sharp pullback after hitting historic highs. This shift is primarily driven by a "thaw" in geopolitical tensions regarding the US-Greenland situation.
What's Going On?
The Pullback: After surging to a peak of nearly $4,887 per ounce (and over ₹1,58,000 per 10g in India) on Wednesday, gold prices have dropped by roughly 1–2% today.
The Catalyst: President Trump retreated from immediate tariff threats against Europe over the Greenland issue, easing the "geopolitical risk premium." This has caused some investors to "sell the news" and take profits.
Current Price Levels: Spot gold (XAUUSD) is currently hovering around $4,780–$4,815 per ounce.
Strategy for Next Steps
Whether you should buy or sell depends on your time horizon:
1. If You Are Selling (Taking Profits)
The Window: If you bought during the early January consolidation (around $4,500–$4,600), you are still in a strong profit position.
Next Step: Consider trailing your stop-loss or selling a portion of your position now. While the long-term trend is bullish, the "Greenland premium" is deflating, which could push prices down to the $4,712 support level before they stabilize.
2. If You Are Buying (New Entry)
Wait for Support: Do not "catch a falling knife" during today’s drop. Analysts are watching the $4,750 and $4,712 levels as potential zones where buyers might step back in.
Next Step: Look for a "bounce" or stabilization at these support levels. If prices hold above $4,710, it confirms the uptrend is still healthy despite the news.
Long-term Outlook: Major banks like Goldman Sachs and J.P. Morgan have raised their 2026 targets toward $5,000–$5,400, suggesting that pullbacks today are likely "buying opportunities" for long-term holders.

XAUUSD – H2 Technical AnalysisLiquidity Pullback Within a Strong Bullish Structure | Lana ✨
Gold continues to trade within a well-defined bullish structure on the H2 timeframe. The recent surge was impulsive, followed by a healthy retracement that appears to be rebalancing liquidity rather than signaling a trend reversal.
Price action remains constructive as long as the market respects key structural levels and the ascending trendline.
📈 Market Structure & Trend Context
The overall trend remains bullish, with higher highs and higher lows still intact.
Price continues to respect the ascending trendline, which has acted as reliable dynamic support throughout the uptrend.
The recent pullback occurred after an aggressive upside expansion, fitting the classic sequence:
Impulse → Pullback → Continuation
No clear distribution pattern is visible at this stage. As long as structural support holds, the bias remains BUY on pullbacks, not selling strength.
🔍 Key Technical Zones & Value Areas
Primary Buy POC Zone: 4764 – 4770
This area represents a high-volume node (POC) and aligns closely with the rising trendline.
It is a natural zone where price may rebalance before resuming the bullish trend.
Secondary Value Area (VAL–VAH): 4714 – 4718
A deeper liquidity zone that could act as support if sell pressure temporarily increases.
Near-term resistance: 4843
Acceptance above this level strengthens the continuation scenario.
Psychological reaction zone: 4900
Likely to generate short-term hesitation or profit-taking.
Higher-timeframe expansion targets:
5000 (psychological level)
2.618 Fibonacci extension, where major liquidity may be resting.
🎯 Trading Plan – H2 Structure-Based
✅ Primary Scenario: BUY the Pullback
Buy Entry:
👉 4766 – 4770
Lana prefers to engage only if price pulls back into the POC zone and shows bullish confirmation on H1–H2 (trendline hold, strong rejection of lower prices, or bullish follow-through).
Stop Loss:
👉 4756 – 4758
(Placed ~8–10 points below entry, beneath the POC zone and the ascending trendline)
🎯 Take Profit Targets (Scaled Exits)
TP1: 4843
First resistance zone — partial profit-taking recommended.
TP2: 4900
Psychological level with potential short-term reactions.
TP3: 5000
Major psychological milestone and upside expansion target.
TP4 (extension): 5050 – 5080
Area aligned with the 2.618 Fibonacci extension and higher-timeframe liquidity.
The preferred approach is to scale out gradually and protect the position, adjusting risk as price confirms continuation.
🌍 Macro Context (Brief)
According to Goldman Sachs, central banks in emerging markets are expected to continue diversifying reserves away from traditional assets and into gold.
Average annual central bank gold purchases are projected to reach around 60 tons by 2026, reinforcing structural demand for gold.
This ongoing accumulation supports the idea that pullbacks are more likely driven by positioning and profit-taking, rather than a shift in long-term fundamentals.
🧠 Lana’s View
This remains a pullback within a bullish trend, not a bearish reversal.
The focus stays on buying value at key liquidity zones, not chasing price at highs.
Patience, structure, and disciplined execution remain the edge.
✨ Respect the trend, trade the structure, and let price come to your zone.

Gold: Structure Intact, Momentum Mature — Time Risk ZoneGold continues to trade within a well-defined long-term rising channel.
Recent acceleration has pushed price into higher Fibonacci stretch zones, indicating maturity rather than an immediate reversal.
Momentum is elevated, suggesting the market may cool via time and consolidation, not necessarily through a sharp decline.
As long as the primary channel holds, the broader structure remains intact.
This is an observation of market structure, not a directional call.
Risk management and decisions remain individual responsibility.
Key principle:
Structure > Excitement | Time-risk > Price targets
Structure is observed, not predicted.
Decisions remain the sole responsibility of the reader.

Part 2 Institutional Option Trading VS. Technical Analysis What Is an Option?
An option is a financial contract that gives the buyer the right, but not the obligation, to buy or sell an underlying asset at a predetermined price, on or before a specific date.
There are two types of options:
Call Option
Put Option
Each option contract is defined by:
Underlying asset
Strike price
Expiry date
Premium (price of the option)

Gold Trading Strategy for 22nd January 2026🟡 GOLD (XAUUSD) – TRADE SETUP 💰
📈 BUY SETUP
🟢 Buy above the HIGH of one candle
🔒 Condition: Candle close below 4870
🎯 Targets:
💵 4880
💵 4890
💵 4905
📉 SELL SETUP
🔴 Sell below the LOW of one 1-Hour candle
🔒 Condition: Candle close below 4796
🎯 Targets:
💵 4780
💵 4765
💵 4750
⚠️ DISCLAIMER
📌 This is not financial advice.
📌 Shared for educational purposes only.
📌 Trading in Gold / Forex involves high risk 💥
📌 Please trade with proper risk management & stop-loss.
📌 I am not responsible for any profit or loss.

Morning Star in SENSEX & NIFTYObserving MORNING STAR Pattern in Sensex & Nifty.
With the Tariff issues kind of subsiding and considering Budget on 1st Feb, market will see an Uptrend in the coming few weeks.
Sensex will rebound strongly and might reach around 85750 in the near term.

IRB: Leading Diagonal ?LD didn't quite make it to the Upper Trendline.
Wave C in progress.
Likely to bottom near 20.
Non-log chart.
Always open to a different perspective.

silver support and resitancelook for 300 if it close 295-297 strongly on up 1hr time frame its bullish , if get rejections exit at given lines

Part 1 Institutional Option Trading VS. Technical Analysis Introduction to Option Trading
Option trading is one of the most powerful yet misunderstood segments of the financial markets. Unlike traditional investing, where traders buy or sell shares outright, options are derivative instruments whose value is derived from an underlying asset such as stocks, indices, commodities, or currencies.
Options provide traders with flexibility, leverage, risk management tools, and income generation opportunities. However, they also involve complexity and risk, making education and discipline essential.
In modern markets, especially after the rise of derivatives exchanges like NSE, CBOE, and global electronic trading platforms, option trading has become central to institutional strategies, hedge funds, proprietary desks, and advanced retail traders.

NATURALGAS BOOM Naturalgas gas make a high of 444on 21 Jan 26. It's good move. Entry was given near 297 . Keep Trial SL don't make new entry . It's news based Rally.
Tgt 350+

BTC Cup and handle inside big BearFlag Risng wageUpdate
BTC reached a major rise around
1. Shows cup and handle where the handle is completed, short-term pullback might breakout today or tomorrow
2. Next Leg up around 97k - Porbablity 60%
3. Major Pull Back around 100k
