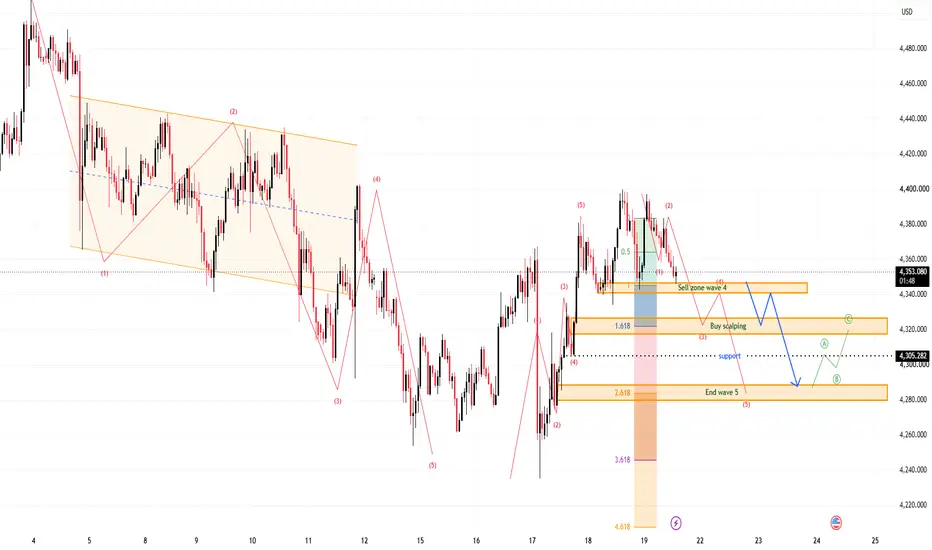
XAUUSD — Wave 5 Lower Toward 4,280
From Kelly’s view, gold is still trading inside a broader bearish structure. Price is currently around 4,352, while the recent rebound remains below the previous lower-high area near 4,380–4,395.
The key idea is simple: the current move may be completing a corrective Wave (4) around resistance, while the main structure still favors another bearish leg toward 4,320, 4,305, and potentially the 4,280 Wave (5) target zone.
⟡ Market structure
Gold continues to show a sequence of lower highs after
Opcoes
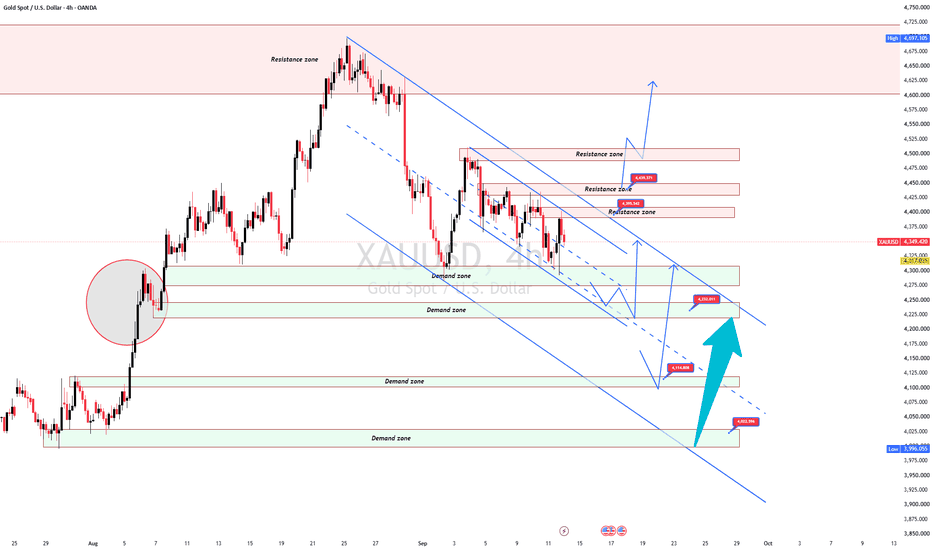
GOLD: 4.340–4.350 — BREAKOUT OR REJECTION?Today is FOMC day. Gold is approaching the descending trendline again, with 4.340–4.350 as the key short-term resistance zone.
🔴 Resistance:
4.340–4.350 │ 4.390–4.400 │ 4.420–4.435
🟢 Support:
4.300 │ 4.270 │ 4.225 │ 4.200 │ 4.160
🎯 TRADING SCENARIOS
Break above 4.340–4.350 → potential move toward 4.390–4.400 → 4.420–4.435.
Rejection at 4.340–4.350 → watch for a pullback toward 4.300 → 4.270 → 4.225.
Below 4.200 → next area to watch: 4.160.
🧠 PERSONAL VIEW
I still favor BUY at support and
KPRMILL: Weekly Descending Channel Breakout & Earnings Catalyst1. The Macro Perspective: The Descending Channel Formation
I am taking a LONG bias on K.P.R. Mill Limited (KPRMILL) on the macro weekly (1W) timeframe.
When analyzing pure market structure on a textile sector leader, extended markdown phases often form classical corrective patterns before the primary trend resumes. Following a peak, the stock entered a prolonged structural correction, carving out a well-defined Descending Channel visible on the chart. This multi-month digestion phase allowed ins
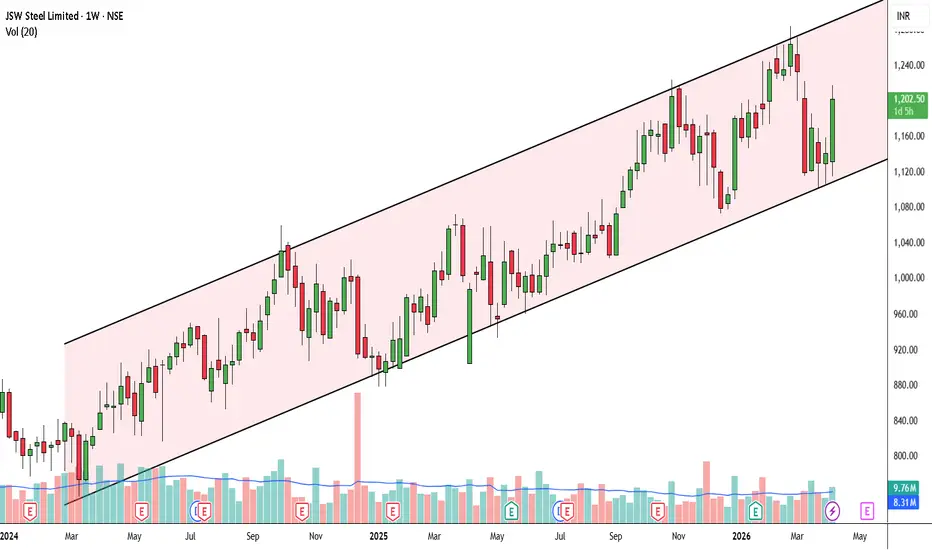
AAPL: Monthly Ascending Channel & Resistance Breakout1. The Macro Perspective: The Secular Ascending Channel
I am taking a LONG bias on Apple Inc. (AAPL) on the monthly (1M) timeframe.
When analyzing pure market structure on a mega-cap tech leader, long-term trend channels dictate the primary narrative. Look at the structural development on this chart. Since the pandemic crash in early 2020, AAPL has been flawlessly respecting a massive ascending parallel channel. This channel acts as a mechanical roadmap: the lower boundary consistently serves a
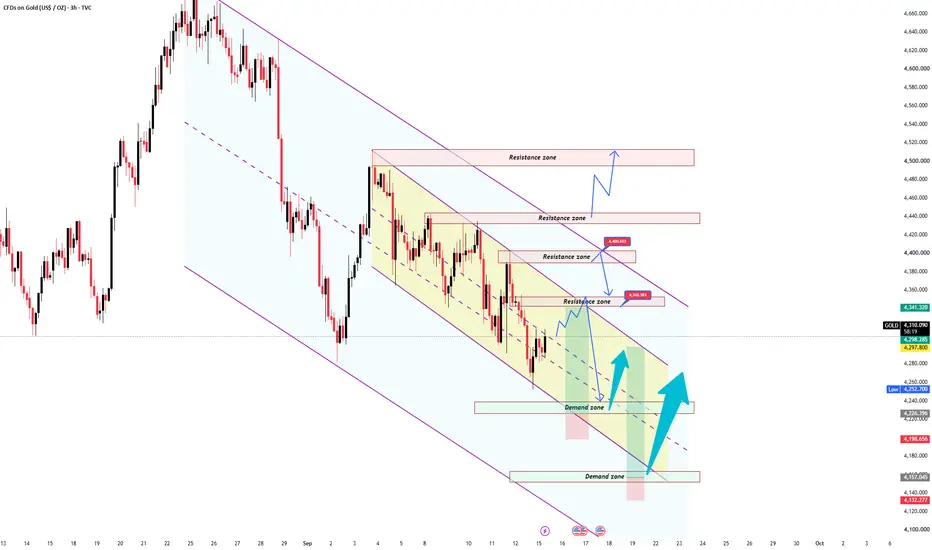
GOLD: SHORT-TERM BUY BEFORE FOMC?Gold is still moving within a downtrend channel. Yesterday’s daily candle closed below 4,300, but with a deep rejection wick, showing that buyers are still defending the market. Ahead of FOMC, I favor short-term BUYs at support and will wait for price confirmation.
🔴 Resistance: 4.316 │ 4.340–4.345 │ 4.390–4.400 │ 4.440
🟢 Support: 4.280 │ 4.250 │ 4.225 │ 4.200 │ 4.160
🎯 SCENARIO
Break above 4.316 → 4.340–4.345 → 4.390–4.400 → 4.440.
Above 4.440: stop SELLing, as gold could resume its uptrend.
GOLD: RANGE COMPRESSION – WAITING FOR FOMC?Gold is still moving within a downtrend channel, while the H4 chart is consolidating inside the 4.285–4.400 range. For Monday–Tuesday, I will mainly watch price action within this range and pay close attention to deep sweeps and liquidity grabs toward the support zones.
🔴 Resistance: 4.400 │ 4.408 │ 4.445 │ 4.500 │ 4.570–4.600
🟢 Support: 4.285 │ 4.250 │ 4.220 │ 4.150 │ 4.115
🎯 TRADING PLAN
Break above 4.400–4.445 → favor BUY on the breakout, targeting 4.500 → 4.570 → 4.580 → 4.600.
Break bel
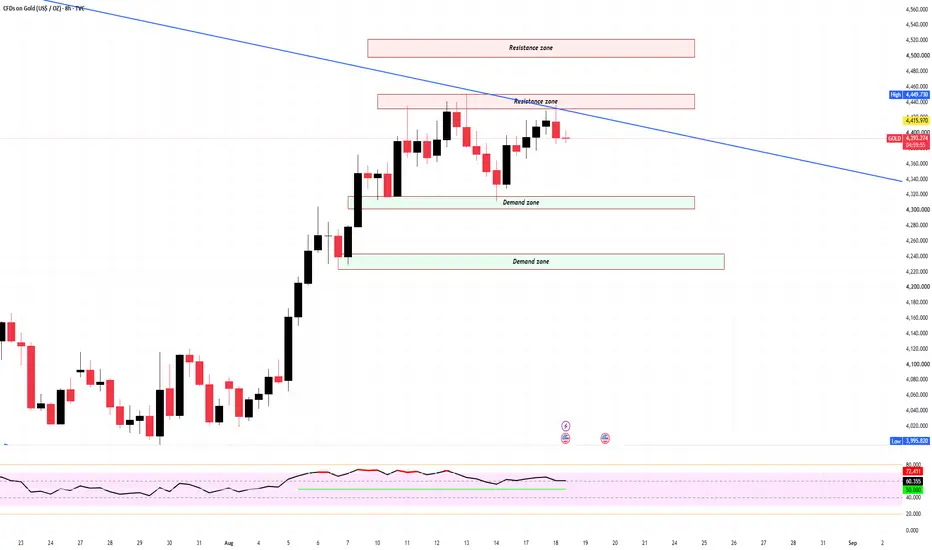
GOLD: WAITING FOR A BREAKOUTGold remains trapped within the 4,450–4,310 trading range following a strong rally from the 3,940 area. Price is currently approaching a key resistance zone where the range high, overhead liquidity, and a major descending trendline converge, making the 4,430–4,450 area a critical decision zone for the current market structure.
From a technical perspective, the market has not yet confirmed a breakout. Recent upward moves appear to be absorbed around the 4,430–4,450 area, while the support below
BSE Ltd. (1W) - Make or Break at Major Channel SupportOverview:
Looking at the Weekly (1W) timeframe for BSE Ltd. (NSE: BSE), the stock has been respecting a very well-defined, long-term ascending parallel channel. After a strong impulsive move to the upside that tested the upper boundary of this channel near the 4,400 - 4,500 levels, the stock has entered a corrective phase.
Technical Observations:
The Ascending Channel: The broader trend remains bullish as long as the price stays within this upward-sloping channel. Both the upper resistance li
OFSS (1D) - Approaching Crucial Resistance within an Ascending COverview:
Here is a technical breakdown for Oracle Financial Services Software Limited (OFSS) on the Daily (1D) timeframe. The stock has shown massive bullish momentum over the past few months but is now arriving at a critical decision point.
Key Technical Observations:
Established Ascending Channel: Since the major low earlier in the year, the price has been perfectly respecting a rising parallel channel (marked by the dotted trendlines). The stock has consistently found support at the lower
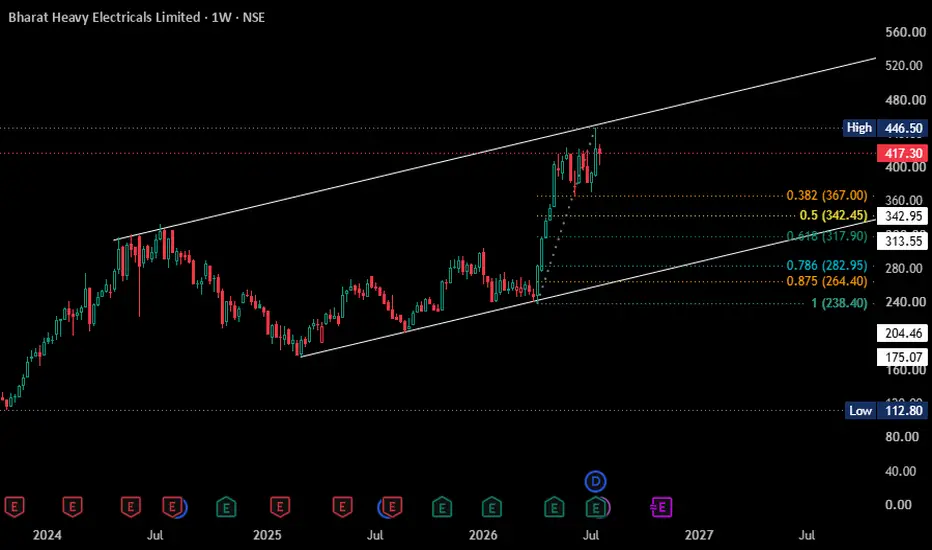
BHEL(W) TESTING UPPER RESISTANCE OF ASCENDING CHANNELLooking at the weekly timeframe for BHEL (NSE), the stock has been trading within a well-defined ascending channel over the past year.
Technical Observation:
Current Price Action: The stock is currently trading around the 417.30 level.
Pattern Setup: After a steady climb from the lower support trendline, the price has rallied aggressively to test the upper boundary of the channel.
Key Resistance: The immediate hurdle is the upper trendline and the recent high marked near 446.50.
Potential S
ZINC: Pullback to Breaker Block-Watching for Trend ContinuationMCX:ZINC1!
Zinc Futures are retesting a previously respected breaker block, which aligns with an important support zone after a strong impulsive rally.
The current decline appears corrective , forming a short-term falling channel while the broader market structure remains constructive. A sustained hold above the marked demand area, followed by a breakout from the channel, could indicate renewed bullish momentum.
For now, the reaction around this support zone remains the key area to watch.
360 One Wam Limited - Daily Chart Price Action Analysis Pattern: Ascending Channel
A clean ascending channel from mid-April to July 2026.
Lower trendline: Connects higher lows from ~₹975 in April → ~₹1030 in May → ~₹1050 in June → ~₹1077 in July
Upper trendline: Connects higher highs from ~₹1125 in April → ~₹1145 in May → ~₹1160 in June
Midline: Dashed center line. Price oscillates between upper/lower lines
Structure: Both lines slope up = bullish consolidation after a sharp fall.
This is a bullish channel after a washout.
TATAELXSI: Descending Channel Meets 200-Month EMAOverview
Tata Elxsi — one of India's premium technology and design services companies — has been in a significant correction since its all-time high of ₹10,760 in 2021. On the Monthly timeframe, a clear Descending Channel has formed, and price is now approaching a critical confluence zone where the Channel Lower Band meets the 200 Monthly EMA at ₹3,283.
This analysis covers multiple timeframes to present a complete picture of where TATAELXSI stands structurally.
The Descending Channel — Monthly
BANKNIFTY 1H | Triangle Breakout → Channel Resistance → PullbackOverview
BANKNIFTY has been trading inside a clean Ascending Channel on the 1-hour timeframe since early June. Within this channel, a textbook Symmetrical Triangle formed, compressed price, and then delivered a sharp breakout — sending price all the way to the Upper Channel Resistance at 58,708.
Price is now pulling back. The key question is: where does the pullback find support?
What the Chart Is Showing
📐 Symmetrical Triangle — A consolidation pattern formed between June 15–24 inside the asce
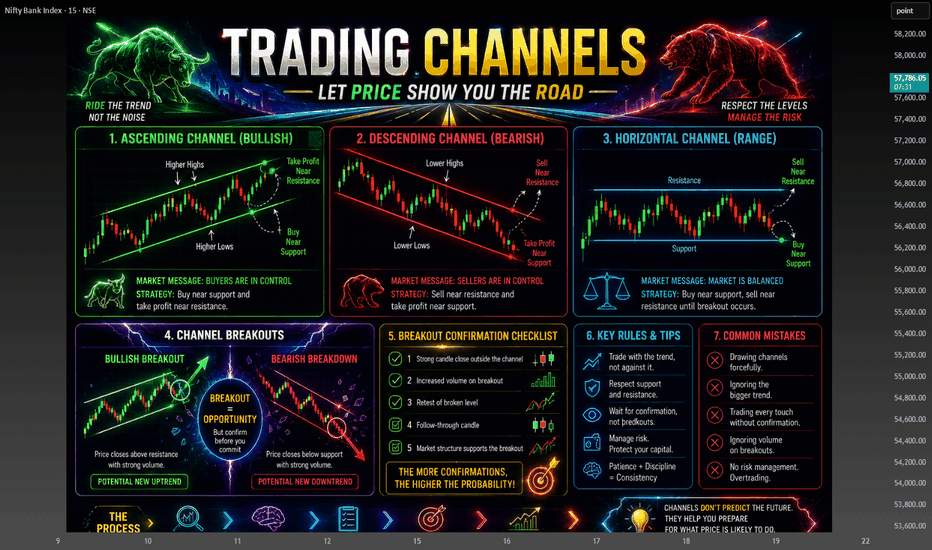
Where Breakouts Are Born: The Power of Trading Channels📈 CHANNELS IN TRADING — FOLLOW THE PATH, NOT THE NOISE
Many beginners spend months searching for the "perfect indicator."
But experienced traders often focus on something much simpler:
👉 Price Structure
One of the easiest ways to understand price structure is through Trading Channels.
━━━━━━━━━━━━━━━
🚦 WHAT IS A CHANNEL?
A channel is created when price moves between two parallel lines:
🔹 Upper Line = Resistance
🔹 Lower Line = Support
Think of it like a road.
As long as price stays insi
BSE Holding Trendline Support, Bulls Eyeing Higher LevelsPrice is currently trading near the 4000 level and holding above the rising trendline support. The 3930–3950 zone remains the key short-term support area.
As long as buyers defend this level, the bullish structure stays intact with a potential move toward the 4250–4300 resistance zone.
However, a decisive break below 3930 could weaken the trend and open the door for a deeper correction toward 3600.
Key Levels
Support: 3930–3950
Major Support: 3600( downsite after breaking the current supp
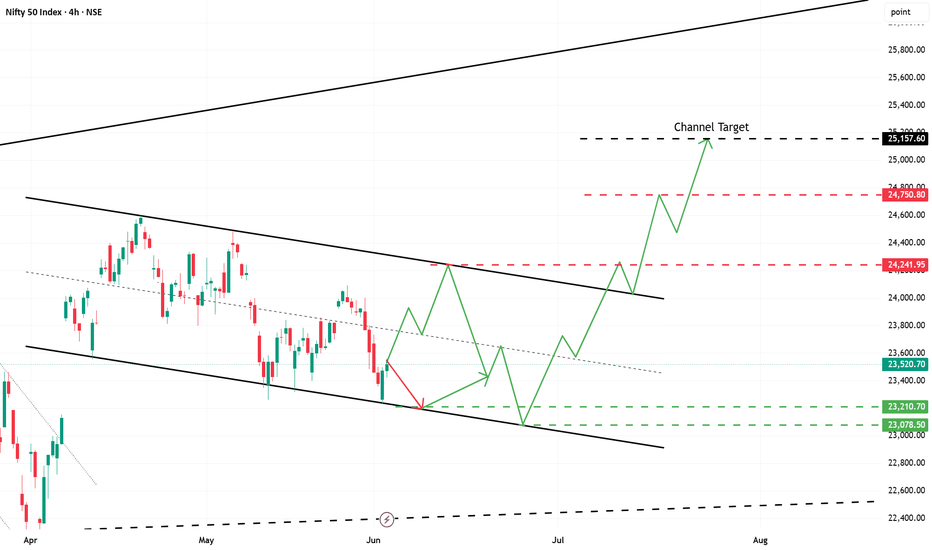
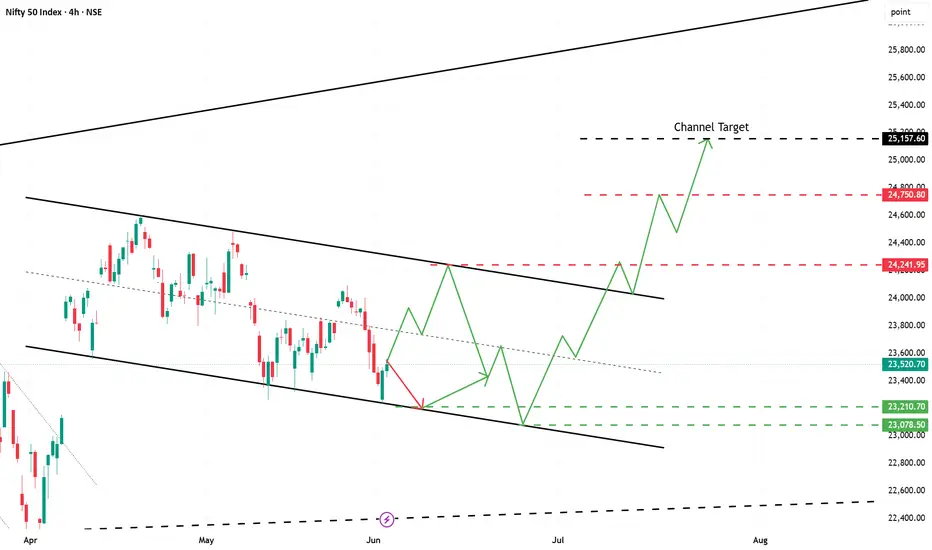
Nifty - Initiated 4 Hours Descending ChannelHi All,
Hope everyone doing well.
Today move has created a new support to the channel which has already rejected twice.
Market is not convincingly bullish yet, but showing some signs of recovery.
If today's momentum continues then we may see channel high in couple of days or later the week at ~24200.
Staying above ~24000 is key as of now to reach higher levels.
On the contrary ~23200 is the immediate support at the channel low again. From there I am expecting to follow the pattern upper sid
SANSERA: The Perfect Ascending Channel and Confluence Bounce1. The Macro Perspective: The Institutional Staircase
I am taking a LONG bias on Sansera Engineering Limited (SANSERA) on the daily (1D) timeframe.
When analyzing pure market structure, the most sustainable and lucrative trends do not go straight up vertically; they move in structured waves. Look at the massive structural development spanning this chart. I have highlighted a textbook "Ascending Channel." This pattern is the ultimate footprint of methodical, long-term institutional accumulation.
Descending channel in 4 hoursHope everyone is doing well.
Channel pattern has started on 15th April which is still following and market is within the range of this pattern. There was a slight deviation on 6, 7 and 8th of May month. From 11th May it has fallen again in the range.
As of today, channel top has touched one more time and strongly rejected at ~23717.
If the same pattern continues then we may see ~23000 first before breaking the pattern. Otherwise pattern breaks without touching it’s low then expecting retest a
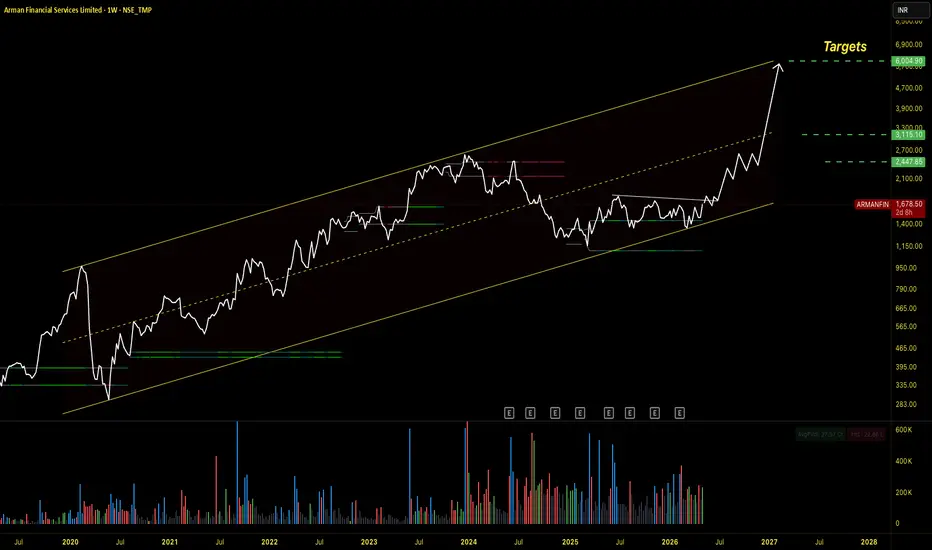
ARMANFIN - Respecting the 7-Year Ascending Channel | WeeklyArman Financial has been trading inside a clean, ascending parallel channel since 2019, now 7 years old and counting. This isn't a drawn channel hunting for a fit. The price has tested the lower boundary three times in seven years and bounced all three times:
→ COVID low (2020)
→ Post-peak correction (2022)
→ MFI sector blowup (2024–25) - the deepest, most brutal test
Each test was accompanied by a different set of macro or sector fears. The structure didn't flinch.
The stock peaked near ₹2,5
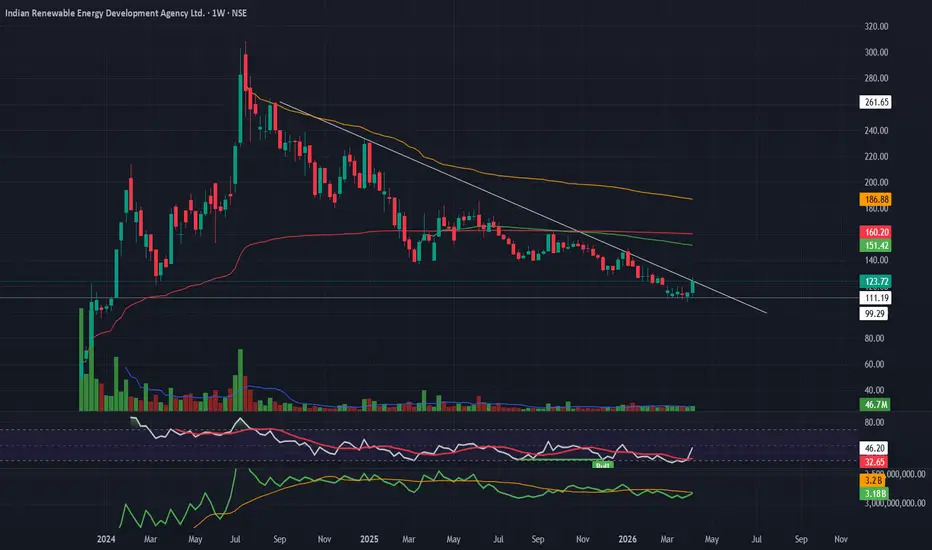
IREDA – Descending Triangle Breakout | Early Reversal SetupIREDA has broken out of a descending triangle, signaling a potential shift from downtrend to early accumulation phase.
RSI is reversing from oversold levels, while OBV has crossed above its SMA — confirming buying interest.
AVWAP confluence (ATH, prior swing, listing zone) adds strength to the current structure.
🔹 Entry: 126–130
🔹 Stoploss: 112
🔹 Targets: 145 → 160
👉 Counter-trend, but strong risk-reward.
👉 Sustaining above AVWAP cluster will be key for trend transition.
XAUUSD Reaction From Support Zone Possible Bullish Move Toward RXAUUSD Reaction From Support Zone | Possible Bullish Move Toward Resistance
Gold (XAUUSD) on the 45-minute timeframe is currently approaching a strong support zone around 5000 – 5020. This area has previously acted as an important demand level where buyers stepped into the market. 📉➡️📈
After a clear bearish move from the resistance zone near 5220, the price is now testing this support again. When price reaches strong support levels, we often see a potential reaction or temporary reversal becau
Bearish Channel ContinuationOverview
The chart shows a transition from a consolidation range into a bearish trend after a key support breakdown. Once the support level failed, price shifted into a descending channel structure, indicating sustained selling pressure.
⸻⸻⸻⸻⸻⸻⸻⸻⸻⸻⸻
Concept
Support and resistance zones often define market equilibrium. When price consolidates within a range and eventually breaks below support, it signals weakness in market structure and the beginning of a potential downtrend.
⸻⸻⸻⸻⸻⸻⸻⸻⸻⸻⸻