BUY TODAY SELL TOMORROW for 5% - BTST STOCK OPTIONDON’T HAVE TIME TO MANAGE YOUR TRADES?
- Take BTST Stock Option trades at 3:25 pm every day
- Try to exit by taking 4-7% profit of each trade
-Resistance Breakout in ASIANPAINT
BUY TODAY, SELL TOMORROW for 5%
Options-strategy

Option Trading Advanced StrategiesA. Option Buyer
The buyer pays a premium to purchase a call or put.
Rights: Has the right, not the obligation, to exercise the option.
Risk: Limited to the premium paid.
Reward: Potentially unlimited (for calls) or large (for puts).
B. Option Seller (Writer)
The seller receives the premium upfront.
Obligation: Must fulfill the contract if the buyer exercises it.
Risk: Very high (sometimes unlimited).
Reward: Limited to premium collected.
Option sellers typically have higher probability strategies but higher margin and high risk.

INFY | Weekly Bullish Options Setup | 30 Dec ExpiryTrade Structure:
• Sell 1640 PE
• Buy 1600 PE
• Defined-risk bull put spread
Why this setup works for NSE:INFY
INFY is showing a clear recovery from the lower band with improving momentum. RSI has turned up from the mid-zone and ROC is trending higher, suggesting strength is building rather than fading.
Price holding above the 1620–1640 support zone keeps downside limited, while steady IV makes short-premium structures efficient for the week.
View
Moderately bullish — expecting INFY to hold above support and grind higher.
This video is for education only. It’s not financial advice or a recommendation to trade.
#INFY #NiftyIT #WeeklyOptions #OptionsTrading #IndiaFNO #BullPutSpread #OptionSeller #PriceAction #NSEStocks #MarketAnalysis

Introduction to Futures HedgingUnderstanding Futures Contracts
A futures contract is a standardized legal agreement to buy or sell an asset at a predetermined price at a specified future date. These contracts are traded on organized exchanges, ensuring liquidity, transparency, and regulatory oversight. The underlying asset in a futures contract could be a physical commodity such as crude oil, wheat, or gold, or a financial instrument like an index, bond, or currency.
Futures contracts have key characteristics:
Standardization: The contract specifies the quantity, quality, and delivery date of the underlying asset.
Margin Requirements: Traders must maintain a margin—a fraction of the contract value—to enter into futures positions.
Mark-to-Market: Gains and losses are settled daily based on the contract’s market value.
Leverage: Futures allow traders to control large positions with relatively small capital, magnifying both potential gains and losses.
These features make futures contracts ideal tools for hedging because they provide predictability and protection against price volatility.
The Concept of Hedging
Hedging is the practice of taking an investment position in one market to offset potential losses in another. In essence, it acts like insurance: while it may limit potential profits, it also minimizes exposure to losses. There are two main types of hedging:
Long Hedge: Used when a business anticipates purchasing an asset in the future and wants to lock in the current price to avoid rising costs.
Example: An airline expects to buy jet fuel in six months. To protect against rising fuel prices, it can buy futures contracts now at the current price. If fuel prices rise, the gain on the futures contract offsets the higher cost of purchasing fuel in the future.
Short Hedge: Used when a business holds an asset and wants to protect against falling prices.
Example: A wheat farmer expects to harvest in three months. To avoid losses if wheat prices fall, the farmer can sell wheat futures contracts now. If the price drops, the profit on the futures contract compensates for the lower market price of the physical wheat.
By employing hedging strategies, both buyers and sellers can stabilize cash flows and plan their operations with more certainty.
Importance of Futures Hedging
Risk Management: The primary objective of futures hedging is to manage price risk. Businesses in agriculture, energy, metals, and finance frequently use futures to minimize the impact of adverse price movements.
Price Discovery: Futures markets facilitate price discovery, reflecting expectations of supply and demand. Hedgers benefit by gaining insight into future price trends.
Financial Stability: Hedging provides stability to earnings and costs. For companies with significant exposure to commodity or currency fluctuations, this stability supports strategic planning, investment, and growth.
Speculation Reduction: By hedging, companies avoid excessive exposure to speculation-driven market movements, focusing instead on their core business operations.
Enhanced Creditworthiness: Companies with effective hedging programs are viewed as financially prudent by lenders and investors, improving access to capital.
Mechanics of Futures Hedging
Hedging with futures involves several steps:
Identify the Exposure: Determine which assets, commodities, or financial instruments are exposed to price risk.
Select the Appropriate Futures Contract: Choose a futures contract that closely matches the underlying asset in terms of quantity, quality, and timing.
Decide the Hedge Ratio: The hedge ratio determines the number of futures contracts needed to offset the risk. Perfect hedges are rare; often, partial hedges are employed to balance risk reduction and cost.
Enter the Futures Position: Buy or sell futures contracts depending on whether a long or short hedge is appropriate.
Monitor and Adjust: As market conditions change, hedgers must monitor their positions and adjust contracts to maintain effective risk coverage.
Close or Offset the Hedge: Futures contracts can be offset before expiration by taking an opposite position or allowed to expire if physical delivery aligns with the hedger’s requirements.
Examples of Futures Hedging
1. Agricultural Hedging:
A corn farmer expects to harvest 10,000 bushels in four months. Concerned about falling prices, the farmer sells corn futures contracts now. When harvest time arrives, even if the market price has dropped, the farmer’s futures gains compensate for the lower sale price, ensuring financial stability.
2. Corporate Hedging:
A multinational company expects to receive €5 million in payments in six months but operates primarily in USD. To protect against EUR/USD exchange rate fluctuations, the company sells euro futures contracts. If the euro depreciates, gains on the futures offset the reduced dollar value of the payment.
3. Commodity Hedging:
An airline hedges against rising fuel costs by buying crude oil futures. If oil prices increase, the gain on the futures contracts compensates for higher fuel costs, helping maintain profitability.
Advantages of Futures Hedging
Predictable Cash Flows: Hedging reduces uncertainty in revenue and costs.
Flexibility: Futures can be tailored to different commodities, currencies, or indices.
Liquidity: Exchange-traded futures offer easy entry and exit.
Leverage: Efficient capital use allows risk management without tying up large amounts of money.
Transparency: Prices are visible and regulated, reducing counterparty risk.
Limitations of Futures Hedging
Basis Risk: The futures price may not move perfectly in line with the underlying asset, resulting in imperfect hedges.
Cost: Margins and transaction fees add to the cost of hedging.
Limited Profit Potential: Hedging locks in prices, reducing the opportunity to benefit from favorable market movements.
Complexity: Understanding contract specifications, hedge ratios, and market dynamics requires expertise.
Over-hedging Risk: Using excessive futures positions can create unintended exposure and losses.
Conclusion
Futures hedging is a vital risk management tool in modern financial and commodity markets. It allows businesses and investors to stabilize cash flows, plan effectively, and mitigate losses arising from adverse price movements. By understanding the mechanics, advantages, and limitations of futures contracts, market participants can use hedging strategies to navigate volatile markets with confidence. While futures hedging does not eliminate risk entirely, it transforms unpredictable market movements into manageable financial outcomes, fostering greater stability and strategic decision-making.
In an increasingly globalized and interconnected economy, the role of futures hedging has expanded beyond traditional commodities to include financial instruments, currencies, and indices. Companies, investors, and financial institutions that employ well-structured hedging strategies are better positioned to withstand market shocks, protect their profitability, and achieve long-term growth.
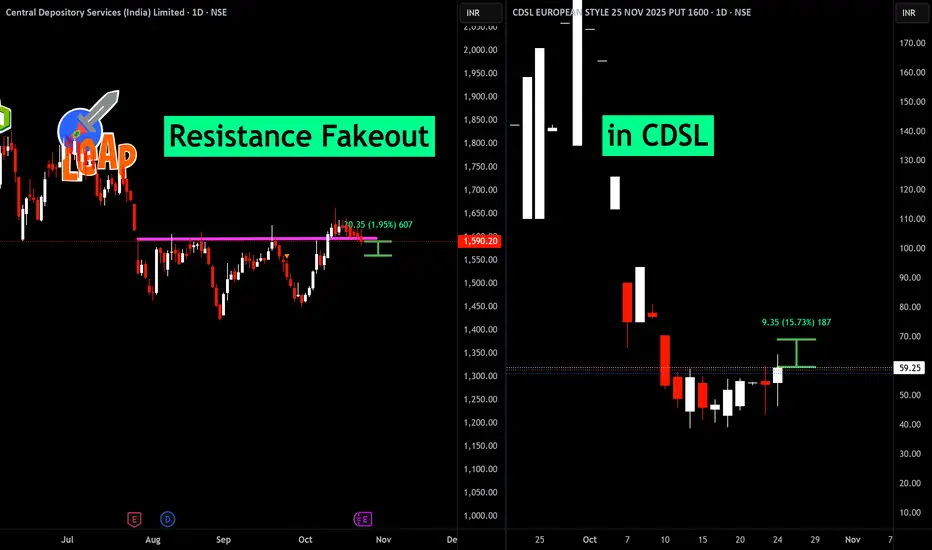
Resistance Fakeout in CDSLAfter a persistent rally, Central Depository Services (India) Limited approached a significant resistance zone near 1,590.20. The initial breakout attempt saw price closing above resistance, but follow-through was absent as sellers quickly regained control. This resulted in a classic false breakout or failed breakout pattern, with price slipping back below the resistance level and triggering a pullback.
False breakouts at key resistance happen when bullish momentum is not sustained, often trapping late buyers and prompting profit-taking. As evident here, the failed breakout signals possible short-term weakness and warrants caution for fresh longs unless the stock can convincingly reclaim and hold above the former resistance. Short-term traders may look for downside opportunities until renewed strength is visible above 1,590.20.
Risk management is essential in such setups as volatility around failed breakouts can be high. Monitor for support at lower levels and watch price behavior around previous resistance for directional clues.
Cup and Handle Breakout and Retested in NYKAANykaa triggers a textbook cup-and-handle breakout on the daily chart, followed by a clean retest that flips resistance into support and signals continuation potential toward the measured move. The 28 Oct 2025 257.5 CE premium surges alongside, reflecting bullish momentum but remains sensitive to decay if price slips back below the neckline

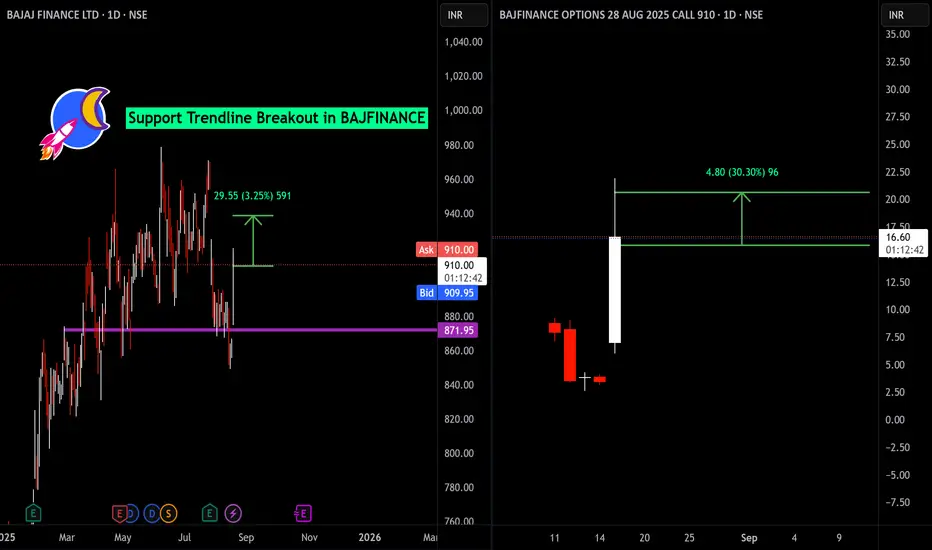
Support Trendline Breakout in BAJFINANCEBAJFINANCE has delivered a strong support trendline breakout, closing at ₹909.60 (+5.59%). Price action confirms bullish momentum above the ₹872 support, with a measured move target of ₹29.55 (3.25%). Notably, the 910 CALL option for 28 AUG 2025 surged 378% to ₹16.50, showing aggressive call buying and aligning with the spot breakout. This synchronization between spot and derivatives indicates robust upward sentiment. Traders may consider maintaining a bullish bias while managing risk below the breakout level. Monitoring volumes and options activity is essential for trend confirmation. This analysis is for educational purposes only.
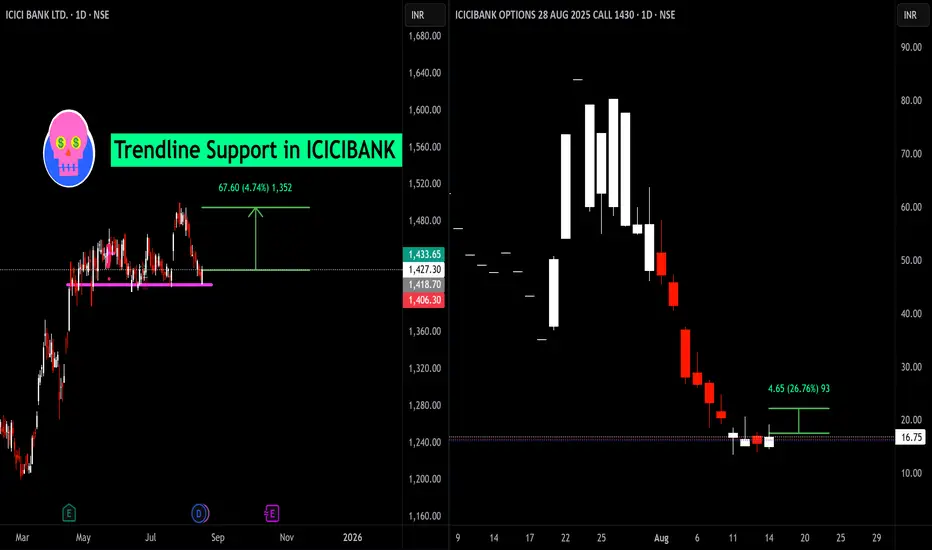
Trendline Support and Options Reaction in ICICI Bank📈 ICICI Bank at Major Support!
ICICI Bank is testing a crucial trendline support zone around ₹1,418–₹1,427 after a lengthy pullback. Historically, this level has held strong, showing multiple bounces — making it a key area for traders to watch.
Support Level: ₹1,418–₹1,427
Potential Upside: The chart highlights a recovery zone towards ₹1,433 and beyond, with a bounce of ₹67.6 (approx. 4.74%) possible if support holds firm.
🟢 Options Perspective: 1430 CE (August Expiry)
The ICICI Bank 1,430 August call option has shown significant volatility:
Current Premium: ₹16.75
Recent Change: +₹4.65 (+26.76%) on a single session!
Open Interest & Option Chain AnalysisIn the world of options trading, two of the most critical analytical tools are Open Interest (OI) and Option Chain Analysis. While price and volume are commonly used indicators, OI and the Option Chain give unique insights into market sentiment, strength of price movements, and likely support/resistance zones.
Let’s break down both concepts thoroughly and understand how you can use them to make smarter trading decisions.
1. What is Open Interest (OI)?
Open Interest (OI) refers to the total number of outstanding (open) option contracts that have not been settled or squared off. These contracts can be either calls or puts, and each open contract reflects a position that has been initiated but not yet closed.
Important: OI is not the same as volume.
Volume counts the number of contracts traded in a day.
OI shows how many contracts are still open and active.
Example:
If Trader A buys 1 lot of Nifty Call and Trader B sells it, OI increases by 1.
If later one of them exits the trade (either buy or sell), OI decreases by 1.
If the same contract is bought and sold multiple times in a day, volume increases, but OI remains the same unless a new position is created or closed.
2. Interpreting Open Interest Changes
Here’s how to interpret changes in OI:
Price Movement OI Movement Interpretation
Price ↑ OI ↑ Long Buildup (bullish)
Price ↓ OI ↑ Short Buildup (bearish)
Price ↑ OI ↓ Short Covering (bullish)
Price ↓ OI ↓ Long Unwinding (bearish)
This table is a cheat sheet for OI interpretation. Let’s break them down with simple language:
Long Buildup: Traders are buying calls/puts expecting further rise. (Positive sentiment)
Short Buildup: Traders are selling expecting fall. (Negative sentiment)
Short Covering: Sellers are closing their shorts due to rising prices. (Momentum shift to bullish)
Long Unwinding: Buyers are exiting as prices fall. (Loss of bullish strength)
3. What is Option Chain?
The Option Chain is a table or listing that shows all the available strike prices for a particular underlying (like Nifty, Bank Nifty, or a stock) along with key data:
Call & Put Options
Strike Prices
Premiums (LTP)
Open Interest (OI)
Change in OI
Volume
Implied Volatility (IV)
Structure of Option Chain
An Option Chain is usually divided into two sides:
Left Side → Call Options
Right Side → Put Options
In the middle, you have the Strike Prices listed.
4. Key Elements in Option Chain Analysis
A. Strike Price
The set price at which the holder can buy (Call) or sell (Put) the asset.
At the Money (ATM): Closest to current spot price
In the Money (ITM): Profitable if exercised
Out of the Money (OTM): Not profitable if exercised now
B. Open Interest (OI)
Shows how many contracts are still open for each strike. Higher OI means greater trader interest.
C. Change in OI
Shows how much OI has increased or decreased. This is critical for real-time sentiment tracking.
Increase in OI + Rising premium = Strength
Increase in OI + Falling premium = Resistance or Support forming
D. Volume
Number of contracts traded today. Shows activity and liquidity.
E. Implied Volatility (IV)
Indicates market expectation of future volatility. High IV means higher premiums.
5. How to Read Option Chain for Support & Resistance
One of the most powerful uses of Option Chain Analysis is identifying short-term support and resistance.
Highest OI on Call Side = Resistance
Highest OI on Put Side = Support
This happens because:
Sellers of Calls don’t want price to rise above their sold strike
Sellers of Puts don’t want price to fall below their sold strike
Example:
Let’s say:
19700 CE has 45 lakh OI
19500 PE has 40 lakh OI
This implies:
Resistance = 19700
Support = 19500
So, traders expect Nifty to remain between 19500–19700.
Conclusion
Open Interest and Option Chain Analysis are powerful tools to understand the mood of the market. They help traders:
Find real-time support and resistance
Gauge market direction and strength
Understand where big players (institutions) are placing their bets
Plan both intraday and positional trades with more accuracy
But remember, OI and Option Chain are not standalone indicators. Combine them with price action, volume, and technical levels for better results.
EURUSD Bulls in ControlHello everyone, what’s your take on EURUSD?
After breaking out of its descending channel, EURUSD has maintained its bullish momentum. In the short term, there are no clear signs of slowing down, especially with the 34 EMA acting as dynamic support — boosting buyer confidence.
Fundamentally, a weaker US dollar and renewed optimism in Europe are fueling euro strength. As long as price holds above the 1.1650 zone, the path of least resistance remains upward. The 1.1750 target is still in sight, confirming a textbook bullish continuation pattern.
What’s your view on where EURUSD is headed next?

25 April Nifty Trade zone#Nifty50 #option trading
99% working trading plan
👉Gap up open 24282 above & 15m hold after positive trade target 24362, 24520
👉Gap up open 24282 below 15 m not break upside after nigetive trade target 24188 , 24070
👉Gap down open 24188 above 15m hold after positive trade target 24282 , 24362
👉Gap down open 24188 below 15 m not break upside after nigetive trade target 24072, 24948
💫big gapdown open 24072 above hold 1st positive trade view
💫big Gapup opening 24362 below nigetive trade view
Trade plan for education purpose I'm not responsible your trade
More education follow & support me
📌 koi bhi trade leval se 20 point ke sl ke bhina karan nahi hi
📌 koi trade app activate tabhi karana hota hi level pe 2 candle uper ya niche closing aati hai to
📌 leval par Ane pe turant trade plan na kare ...
📌 Full risk apaki hi hi meri nah

What is adx and how to use it ?The ADX indicator is designed to quantify the strength of a trend, regardless of its direction. It does this by measuring the degree of price movement within a given period. The ADX values range from 0 to 100.
The traditional setting for the ADX indicator is 14 time periods, but analysts have commonly used the ADX with settings as low as 7 or as high as 30. Lower settings will make the average directional index respond more quickly to price movement but tend to generate more false signals.
ADX below 20: The market is currently not trending.
ADX crosses above 20: A new trend is emerging.
ADX between 20 and 40: This is considered as a confirmation of an emerging trend.
ADX above 40: The trend is very strong.
ADX crosses 50: the trend is extremely strong.

NIFTY going up or down from here?NIFTY is standing at crucial point. Here are two possibilities that will decide further move of NIFTY.
1. If price breaks down to 24548.65 level, it will be confirmed that wave C of Zig-zag has started and this move will go minimum up to 24255.75.
2. If price takes support near 24635 (or just say, reverses from anywhere without touching 24548.65) it will be considered that wave B of Zig-zag is still under formation. In this case NIFTY may show some up move upto 25299, and 25485.85.

Final accumulation before breakout is happening.The daily TF shows bars testing supply at breakout levels.
Decent target mentioned in short term.
Advantageous for call option.

15 Feb ’24 — Nifty within kissing distance of a Bullish breakoutNifty Analysis - Stance Neutral ➡️
Recap from yesterday: “In the 63mts chart, see the encircled region — the strength of the green candles stands out prominently. This has given Nifty a total makeover, till yesterday we were neutral with a moderate bearish bias. Today we are still neutral but with a bullish bias — as the resistance of 21913 is much closer than the support of 21491.”
4mts chart
Nifty has lived up to the expectation today, the momentum it gained yesterday post 14.07 was legitimate. Not only did Nifty hold its ground today but showed intent to take out the 21913 resistance. The open was right at that zone but we quickly lost a few points. The candle at 09.47 carried the hidden message that a breakout was in the cards. That single candle had a swing range of 73 points. Even though we did not do anything unusual till 13.31 - the options premium was going crazy. One mistake I made was to switch to the next-weekly instead of the current one as I felt a breakout would happen post 3 PM. The break came early at 13.35 and what it did was shoot up the CE premiums, nothing unusual in that. But the PEs were not dropping in value. So on one side, my short CEs were trading in deep RED whereas the short PEs were not going into green.
Meanwhile, the breakout did not prove successful - but it definitely woke up the bulls. Almost all the top 8 components were reacting positively to this break. The final close was right near the 21913 SR zone. Over the last week, Nifty rose 166 points ~ 0.76% and if you notice the 63-minute time frame - it has formed a triple bottom-like formation on a descending trendline. Since Nifty already retraced back to the resistance level - we assume it is ready for the next leg of outperformance. The first thing it has to make sure tomorrow is to defend the 21913 levels - if it falls below that, the bullish breakout will not pick up pace. A gap-up is ideal as it will quickly tip the balance to the Bulls as short sellers will have to run for cover. We wish to change the status from neutral to bullish only if we get a 63mts candle above the 21913 resistance line.
63mts chart

GBPUSD has not stopped with the current reductionHello everyone! On the daily chart, the downward trend continues. After losing momentum from the level of 1.313 USD, GBPUSD is still on a decline. Additionally, market conditions seem unfavorable and with the tightening of Fed policies, GU has depreciated.
The next target for further decline can be seen at 1.2000 level, which is a strong psychological barrier.

EURUSD continues to maintain an increase trendHello dear traders!
Today, EURUSD continues to decrease below 1,070. Currently on the price chart is moving horizontally around the price of 1,0645.
If the euro exceeds 1,0670, it is likely that the price will expand the trend to increase to the level of resistance of 1,0700.

SENSEX Trade By Ramajitrade(RAM)🙏👑🤑✔hello guys welcome to Ramajitrade 🙏😊
Today Target is 65,170.00 we achive this target 100%.
Also i see fake breakout in sensex also retest in banknifty last day.
and please Trail your stop loss and try to hold.
#i m data trader my 90% base on data tradeing i hope you like all my trade.
We Not Suggest you To Buy any Stock We just share our Ideas with you.

#LUPIN... Looking good 29.05.23#lupin...
Intraday as well as swing trade
All levels given in charts ...
IF good potential seen then we work in options also
if activate then possible a good movement Keep eye on this ...
We take trade only when it activates...
Possible to give good target
TRADING FACTS

#How to Trade in Option Market 💲🤑💲💸💰#We Make Only Profit.
#HDFCBANK #BANKNIFTY #NIFTY50 #NIFTY #SENSEX #TATA
Technical analysis and options trading can go hand in hand. Many of the best practices for options trading come directly from technical analysis concepts. Technical analysis focuses on price. Fundamental analysis does not solely focus on price.
what is option ?
Options are a type of derivative product that allow investors to speculate on or hedge against the volatility of an underlying stock. Options are divided into call options, which allow buyers to profit if the price of the stock increases, and put options, in which the buyer profits if the price of the stock declines.
RBI Forex Reserve Grow is this Good or Bad ?
1st 140 Billion loss hua hai or ab 20 Billion Grow hua hai to hai to abi bhi loss mai
Gover..t abi losss mai hai laken wo Backup bhi ready kr rhe hai take 2023 kese wjh se krab bhi jaye to economy
pe zada Farak na pade..

LnTBreakout in LnT
I am trading with Option Creadit spread.
Sell 1x 27JUL2023 2520PE - ₹ 60.15
Buy 1x 27JUL2023 2420PE - ₹ 20.1
Max Profit 12000/-
Max Loss 18000/-
Breakeven 2480
Prob. of Profit 54%

11 Jul '23 Post Mortem on Nifty + Long call continues...Today we had a perfect inverted V formation. The high of the day at exact 12.00 noon. A rally of 82pts from opening level and then a fall of 66pts. Even though nifty fell today, it was showing so much of positive energy and a general reluctance to fall. We will bring up the comparison with banknifty shortly & it will make sense.
Today's peak formation ensured we are getting a double top at the ATH levels ~ 19508. The profit booking may be attributed to that. If we continue to fall in the coming days - its better to change the bias from long to neutral.
---
Trades Taken
Yesterday I had reversed my short position to long position & had carried the 19400/19300 PE bullish credit spread overnight. Luckily it worked out alright today. By 10.43 I exited at a price of 29.6/12.9. I exited because more than 50% of premiums had decayed & not because I was bearish.
At the same time I entered into 19400/19300 PE bullish credit spread of the 20th July series for a price of 74.7/48.4. We then had the classic reversal, almost back to the open levels.
Somehow I felt the risk:reward was not matching & then exited the new position at a loss by 14.46 @ 79.7/49.4 and got back to the 19400/19300 PE spread in the 13th Jul series for 32.7/12.3.
The 15.00 candle really scared me and if you calculate the risk:reward was 3980:1020. So I exited the credit spread & went ahead with the call debit spread of 19300/19400 CE @ 176.15/95.15 by 15.03. The rationale being 19300 was still in the money & might offer some cushion as expiry is in 2 days. Whereas 19400 PE could go in the money if the move is 50pts or more.

Banknifty analysis 10 Jul 23Banknifty will try to fill the gap which may be act as support, follow chart for proper support and resistance levels.
