Part 3 Institutional Option Trading Vs. Technical Analysis What Are Options?
Options are derivative contracts whose value is derived from an underlying asset like index (Nifty, Bank Nifty), stocks, commodities, currencies, etc.
They give you the right, but not the obligation, to buy or sell the underlying at a fixed price before a specific date.
Options are mainly of two types:
Call Option (CE): Right to BUY
Put Option (PE): Right to SELL
They are widely used by traders for hedging, speculation, income generation, and risk management.
Optionstrading

NIFTY Sell on Rise | Options Trade with Defined RiskNIFTY continues to respect the upper trendline resistance, indicating a bearish bias in the near term. Price action suggests a sell-on-rise opportunity as long as the index trades below this resistance zone.
📉 Index View (Spot):
Resistance Zone: 25,750
Downside Targets: 25,650 – 25,600
Rejection from this zone could trigger another leg lower toward the mentioned targets.
📌 Trade Setup (Options Strategy)
Instrument: NIFTY 25,800 CE (20th Jan Expiry)
Buy Zone: ₹125 – ₹115
Target: ₹190
Invalidation / Risk: ₹95 (closing basis)
💡 Trade Logic:
As long as ₹125 holds, momentum remains favorable for an upside move in the option premium. A pullback into the buy zone may offer a low-risk, high-reward setup, aligned with volatility expansion near resistance.
⚠️ Risk Management is Key
Use strict stop-loss discipline
Adjust position size according to your risk appetite
Avoid overtrading in volatile conditions
📌 Disclaimer
This analysis is strictly for educational purposes and not financial advice. Please consult your financial advisor and follow your own trading plan before taking any trades.
If you find this idea useful, hit the like button and share your views—your feedback helps us create better trading insights for the community.
🚀 Trade smart. Trade disciplined.
Happy Trading,
– The InvestPro Team

ICICIPRULI | Weekly Bullish Options Setup | 27 Jan ExpiryTrade Structure (Text Format)
• Sell 690 PE
• Buy 680 PE
• Defined-risk Bull Put Spread
Why this setup works
NSE:ICICIPRULI
ICICIPRULI is holding above the 680 support zone with buyers stepping in on minor dips. Price is trading above the short-term averages, RSI remains in the bullish half, and put OI is building below 680, indicating strong downside protection.
With stable IV, put spreads offer efficient premium decay while keeping risk clearly defined.
View
Moderately bullish — expecting ICICIPRULI to stay above 680 and grind higher or move sideways.
This post is for education only. It’s not financial advice or a recommendation to trade.
#WeeklyOptions #BullishSetup #BullPutSpread #OptionsTradingIndia #NSEOptions #PremiumDecay #PriceActionTrading #StockMarketIndia #RMInvestech

Option Trading Advanced StrategiesA. Option Buyer
The buyer pays a premium to purchase a call or put.
Rights: Has the right, not the obligation, to exercise the option.
Risk: Limited to the premium paid.
Reward: Potentially unlimited (for calls) or large (for puts).
B. Option Seller (Writer)
The seller receives the premium upfront.
Obligation: Must fulfill the contract if the buyer exercises it.
Risk: Very high (sometimes unlimited).
Reward: Limited to premium collected.
Option sellers typically have higher probability strategies but higher margin and high risk.

NIFTY Buy-on-Dips | 26,000 CE Opportunity for Jan 6NIFTY continues to show bullish strength, and the broader structure favors a buy-on-dips approach for today, 2nd January 2026.
📌 Trade Setup (Options):
Instrument: NIFTY 26,000 CE (6th Jan Expiry)
Buy Zone: ₹180 – ₹170
Target: ₹240
Risk Level: ₹140 (must hold on closing basis)
As long as ₹140 remains intact, the bullish momentum stays valid. A dip into the mentioned buy zone could offer a low-risk, high-reward opportunity aligned with the current trend.
⚠️ Trade with strict risk management and adjust position sizing accordingly.
📌 Disclaimer:
This analysis is for educational purposes only and is not financial advice. Always manage risk and follow your trading plan.
Your feedback drives our content and keeps everyone trading smarter. Let’s make those pips together! 🚀
Happy Trading,
– The InvestPro Team

BUY TODAY SELL TOMORROW for 5%DON’T HAVE TIME TO MANAGE YOUR TRADES?
- Take BTST Stock Option trades at 3:25 pm every day
- Try to exit by taking 4-7% profit of each trade
- Trendline Breakout in HINDPETRO
BUY TODAY, SELL TOMORROW for 5%

INFY | Weekly Bullish Options Setup | 30 Dec ExpiryTrade Structure:
• Sell 1640 PE
• Buy 1600 PE
• Defined-risk bull put spread
Why this setup works for NSE:INFY
INFY is showing a clear recovery from the lower band with improving momentum. RSI has turned up from the mid-zone and ROC is trending higher, suggesting strength is building rather than fading.
Price holding above the 1620–1640 support zone keeps downside limited, while steady IV makes short-premium structures efficient for the week.
View
Moderately bullish — expecting INFY to hold above support and grind higher.
This video is for education only. It’s not financial advice or a recommendation to trade.
#INFY #NiftyIT #WeeklyOptions #OptionsTrading #IndiaFNO #BullPutSpread #OptionSeller #PriceAction #NSEStocks #MarketAnalysis

JSWENERGY | 30 Dec Expiry |BearishTrade Details (Text Format)
• Sell 450 CE @ 16.25
• Buy 470 CE @ 7.35
• Quantity: 1000 each
• Defined-risk bear call spread
Analysis
Price has slipped below the mid-band with momentum turning down. The weekly structure shows continued weakness after a long consolidation, and volatility is starting to expand on the downside.
The 470 zone sits well above the rejection area near the mean, making the risk curve favourable for a short-term bearish view.
IV remains controlled, keeping the spread efficient for a defined-risk bearish setup.
NSE:JSWENERGY
Note
This is not trade advice — sharing analysis for education.
#Nifty #IndiaFNO #OptionsTrading #BearCallSpread #OptionSeller #PriceAction #NSEStocks

ASHOKLEY | 30 Dec Expiry | Options Trade BullishA 161/159 bull put spread aligns with the current trend structure.
Price continues to push into higher highs with strong momentum, supported by firm ROC and an RSI holding in bullish territory. IVs remain steady with a mild downside skew, which makes short-premium structures efficient here.
The payoff curve benefits from the sustained breakout, and the 1 SD range sits comfortably above the short strike — a supportive backdrop for a defined-risk bullish setup.
NSE:ASHOKLEY
This is not trade advice — sharing analysis for education.
#Nifty #IndiaFNO #OptionsTrading #NSEStoc ks #PriceAction #OptionSeller #MarketsIndia

ADANIENT - Range Support Retest near 2280💹 Adani Enterprises Ltd (NSE: ADANIENT)
Sector: Conglomerate | CMP: 2280.00 | View: Range Support Retest near 2280
ADANIENT spent the day moving weakly, and the price behaviour was fairly simple to understand. The stock opened soft, tried to move up for a short while, but sellers stepped in around 2320–2340 and pushed it back down. After that, the price slowly fell and ended close to 2280 again. This shows that sellers were stronger throughout the day. The volumes also increased on the down-moves, which means the selling was genuine, not panic.
On bigger charts, the stock has been moving inside a wide range between 2240 at the bottom and 2600 at the top. Every time it tries to go up near 2320–2360 or even higher toward 2540–2600, it gets rejected. Since it is now close to the lower part of this range again, the stock is still sideways — not in a strong uptrend. For a beginner, the simple takeaway is: sellers are active above 2320, buyers support the stock near 2240–2280, and until one side breaks these levels, the stock will continue to move inside this range.
Today’s option activity shows that traders were expecting ADANIENT to stay within a range rather than make a big breakout. Call options (especially the 2300 CE) saw buying earlier in the day, which usually signals that some traders were hoping for an upward move if the stock stayed above support. However, not all call strikes were useful — some were too deep in the money or too far out of the money, making them less effective for quick intraday moves.
On the put side, a lot of traders were selling puts at 2280 and 2300. When traders sell puts, it usually means they believe the stock will stay above those levels. This also keeps put premiums lower, because sellers expect stability rather than a big fall. Since the price stayed near support, the put sellers had the advantage — they earned from slow premium decay.
Volatility (IV) remained moderate, meaning the market wasn’t expecting a huge jump or crash. The overall setup shows a tug-of-war: call buyers are holding on for a bounce, while put sellers are confident that 2280–2300 will act as a support zone.
In simple terms:
• If ADANIENT stays above 2280, call options may gain.
• If ADANIENT breaks below 2280, the fall may continue — but usually only after a retest confirms the breakdown.
This structure fits a typical range-bound market where both sides are active but support levels still matter.
For next session, the most important level on the chart is 2280. If the stock stays above this area, it can bounce toward 2320–2340. If it slips below 2280 and fails to get back above it, the next support lies around 2240–2250. For a bounce setup, the cleaner option is the 2300 CE — only take it if the stock holds 2280 and then climbs back above 2292–2295 on a 5 or 15-minute chart. Exit if the option premium drops around 20–25% or if the stock closes below 2275. For a breakdown setup, the safer choice is the 2260 PE, but only after the stock breaks 2280, retests it from below, and stays under 2275. Exit if the premium falls about 25–30% or if the spot goes back above 2285.
Avoid trading in the tight 2280–2298 band — price gets choppy there and option premiums decay quickly. Keep your position sizes reasonable and use strict stop-losses based on option premium, not just spot price. Watch how open interest and volumes behave — sudden changes often reveal the next move early. Overall, 2280–2300 is the fight zone. Holding it means a possible bounce; losing it opens the door to a deeper dip. Monday may be volatile in the first hour, so follow levels, watch volume, and react only after confirmation.
⚠️ STWP Legal Disclaimer
This document is strictly for educational and informational purposes. All examples, charts, levels, and option structures discussed are illustrative and are not intended as buy, sell, or hold recommendations. STWP does not provide investment advice, trading tips, signals, or personalized financial guidance of any kind, nor is it a SEBI-registered intermediary or research analyst. The analyses, illustrations, and risk–reward structures included here are generic in nature and based on publicly available data and observed market behaviour, which may change without notice. Financial markets involve significant risk; derivatives in particular carry the potential for substantial losses. Option premiums, implied volatility, open interest, delta, and other market variables can fluctuate rapidly and unpredictably.
Readers are solely responsible for their trading decisions, capital management, and risk assessment. Before making any investment or trading decision, please consult a SEBI-registered investment advisor. STWP, its representatives, and affiliates shall not be liable for any direct or indirect loss arising from the use of this material. Historical patterns or past market behaviour do not guarantee future outcomes, nor should any part of this document be interpreted as a promise of performance, accuracy, or returns.
Position Status: No active position in this instrument at the time of analysis.
Data Source: TradingView & NSE India.
💬 Found this useful?
🔼 Boost this post to support structured learning
✍️ Share your thoughts or questions in the comments
🔁 Forward this to traders who value clean technical studies
👉 Follow for disciplined, structured, STWP-style analysis
🚀 Stay Calm. Stay Clean. Trade With Patience.
Trade Smart | Learn Zones | Be Self-Reliant 📊

Introduction to Futures HedgingUnderstanding Futures Contracts
A futures contract is a standardized legal agreement to buy or sell an asset at a predetermined price at a specified future date. These contracts are traded on organized exchanges, ensuring liquidity, transparency, and regulatory oversight. The underlying asset in a futures contract could be a physical commodity such as crude oil, wheat, or gold, or a financial instrument like an index, bond, or currency.
Futures contracts have key characteristics:
Standardization: The contract specifies the quantity, quality, and delivery date of the underlying asset.
Margin Requirements: Traders must maintain a margin—a fraction of the contract value—to enter into futures positions.
Mark-to-Market: Gains and losses are settled daily based on the contract’s market value.
Leverage: Futures allow traders to control large positions with relatively small capital, magnifying both potential gains and losses.
These features make futures contracts ideal tools for hedging because they provide predictability and protection against price volatility.
The Concept of Hedging
Hedging is the practice of taking an investment position in one market to offset potential losses in another. In essence, it acts like insurance: while it may limit potential profits, it also minimizes exposure to losses. There are two main types of hedging:
Long Hedge: Used when a business anticipates purchasing an asset in the future and wants to lock in the current price to avoid rising costs.
Example: An airline expects to buy jet fuel in six months. To protect against rising fuel prices, it can buy futures contracts now at the current price. If fuel prices rise, the gain on the futures contract offsets the higher cost of purchasing fuel in the future.
Short Hedge: Used when a business holds an asset and wants to protect against falling prices.
Example: A wheat farmer expects to harvest in three months. To avoid losses if wheat prices fall, the farmer can sell wheat futures contracts now. If the price drops, the profit on the futures contract compensates for the lower market price of the physical wheat.
By employing hedging strategies, both buyers and sellers can stabilize cash flows and plan their operations with more certainty.
Importance of Futures Hedging
Risk Management: The primary objective of futures hedging is to manage price risk. Businesses in agriculture, energy, metals, and finance frequently use futures to minimize the impact of adverse price movements.
Price Discovery: Futures markets facilitate price discovery, reflecting expectations of supply and demand. Hedgers benefit by gaining insight into future price trends.
Financial Stability: Hedging provides stability to earnings and costs. For companies with significant exposure to commodity or currency fluctuations, this stability supports strategic planning, investment, and growth.
Speculation Reduction: By hedging, companies avoid excessive exposure to speculation-driven market movements, focusing instead on their core business operations.
Enhanced Creditworthiness: Companies with effective hedging programs are viewed as financially prudent by lenders and investors, improving access to capital.
Mechanics of Futures Hedging
Hedging with futures involves several steps:
Identify the Exposure: Determine which assets, commodities, or financial instruments are exposed to price risk.
Select the Appropriate Futures Contract: Choose a futures contract that closely matches the underlying asset in terms of quantity, quality, and timing.
Decide the Hedge Ratio: The hedge ratio determines the number of futures contracts needed to offset the risk. Perfect hedges are rare; often, partial hedges are employed to balance risk reduction and cost.
Enter the Futures Position: Buy or sell futures contracts depending on whether a long or short hedge is appropriate.
Monitor and Adjust: As market conditions change, hedgers must monitor their positions and adjust contracts to maintain effective risk coverage.
Close or Offset the Hedge: Futures contracts can be offset before expiration by taking an opposite position or allowed to expire if physical delivery aligns with the hedger’s requirements.
Examples of Futures Hedging
1. Agricultural Hedging:
A corn farmer expects to harvest 10,000 bushels in four months. Concerned about falling prices, the farmer sells corn futures contracts now. When harvest time arrives, even if the market price has dropped, the farmer’s futures gains compensate for the lower sale price, ensuring financial stability.
2. Corporate Hedging:
A multinational company expects to receive €5 million in payments in six months but operates primarily in USD. To protect against EUR/USD exchange rate fluctuations, the company sells euro futures contracts. If the euro depreciates, gains on the futures offset the reduced dollar value of the payment.
3. Commodity Hedging:
An airline hedges against rising fuel costs by buying crude oil futures. If oil prices increase, the gain on the futures contracts compensates for higher fuel costs, helping maintain profitability.
Advantages of Futures Hedging
Predictable Cash Flows: Hedging reduces uncertainty in revenue and costs.
Flexibility: Futures can be tailored to different commodities, currencies, or indices.
Liquidity: Exchange-traded futures offer easy entry and exit.
Leverage: Efficient capital use allows risk management without tying up large amounts of money.
Transparency: Prices are visible and regulated, reducing counterparty risk.
Limitations of Futures Hedging
Basis Risk: The futures price may not move perfectly in line with the underlying asset, resulting in imperfect hedges.
Cost: Margins and transaction fees add to the cost of hedging.
Limited Profit Potential: Hedging locks in prices, reducing the opportunity to benefit from favorable market movements.
Complexity: Understanding contract specifications, hedge ratios, and market dynamics requires expertise.
Over-hedging Risk: Using excessive futures positions can create unintended exposure and losses.
Conclusion
Futures hedging is a vital risk management tool in modern financial and commodity markets. It allows businesses and investors to stabilize cash flows, plan effectively, and mitigate losses arising from adverse price movements. By understanding the mechanics, advantages, and limitations of futures contracts, market participants can use hedging strategies to navigate volatile markets with confidence. While futures hedging does not eliminate risk entirely, it transforms unpredictable market movements into manageable financial outcomes, fostering greater stability and strategic decision-making.
In an increasingly globalized and interconnected economy, the role of futures hedging has expanded beyond traditional commodities to include financial instruments, currencies, and indices. Companies, investors, and financial institutions that employ well-structured hedging strategies are better positioned to withstand market shocks, protect their profitability, and achieve long-term growth.
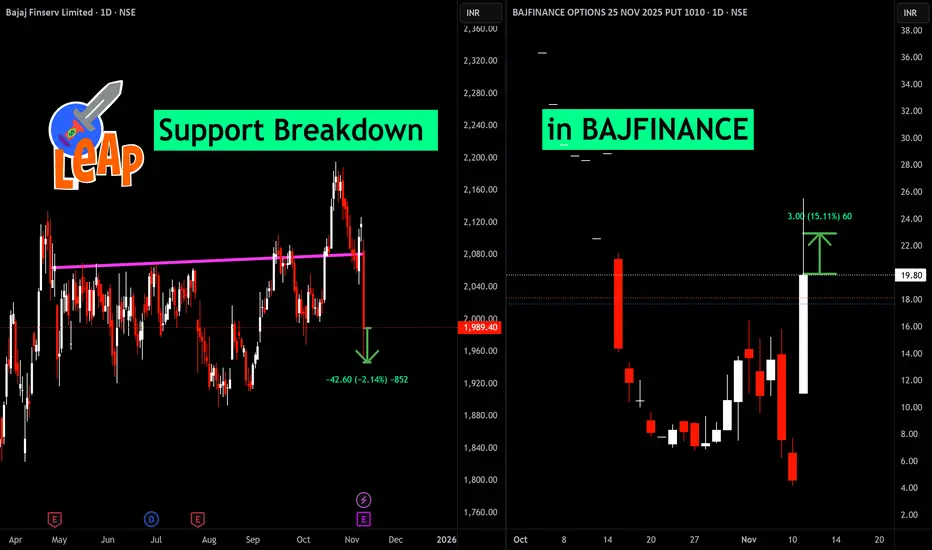
Support Breakdown in BAJFINANCEBajaj Finserv broke key support, triggering a sharp 2% drop and bearish momentum. This led to a strong move in Bajaj Finance PUT options, which surged 15%, reflecting aggressive downside hedging and trading interest. Watch for further volatility and trading opportunities following this breakdown
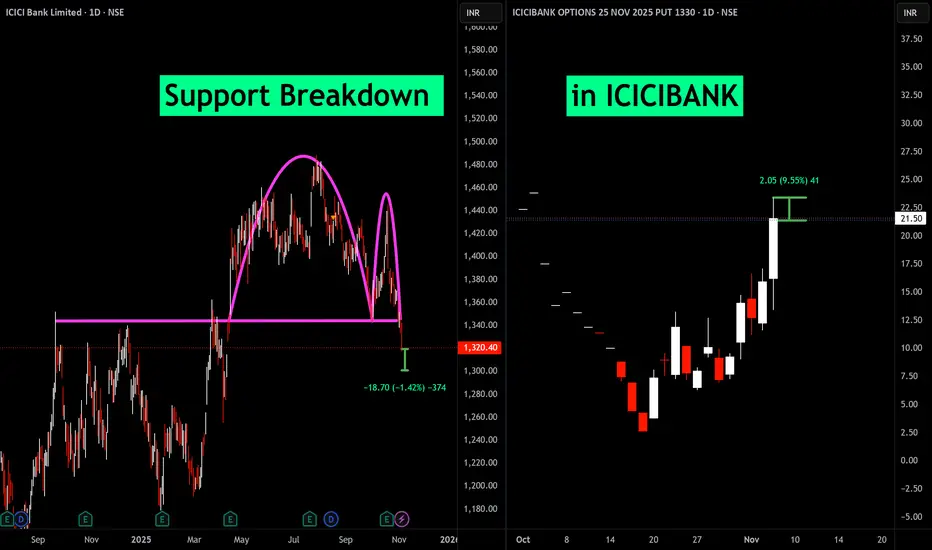
Support Breakdown in ICICIBANKThe breakdown of a key support level typically signals that sellers have gained control over the stock, which often leads to further declines.
The chart shows ICICI Bank's daily price slipping below strong support, which traders watch carefully to time short or protective put option trades.
Buying puts here benefits from the falling stock price causing put premiums to rise.
The suggested profit targets and stop-loss levels are based on technical price levels derived from the previous support turned resistance and the magnitude of the breakdown move.
This trade idea is best suited for traders comfortable with short-term bearish plays using direct short selling or options strategies that capitalize on falling prices.
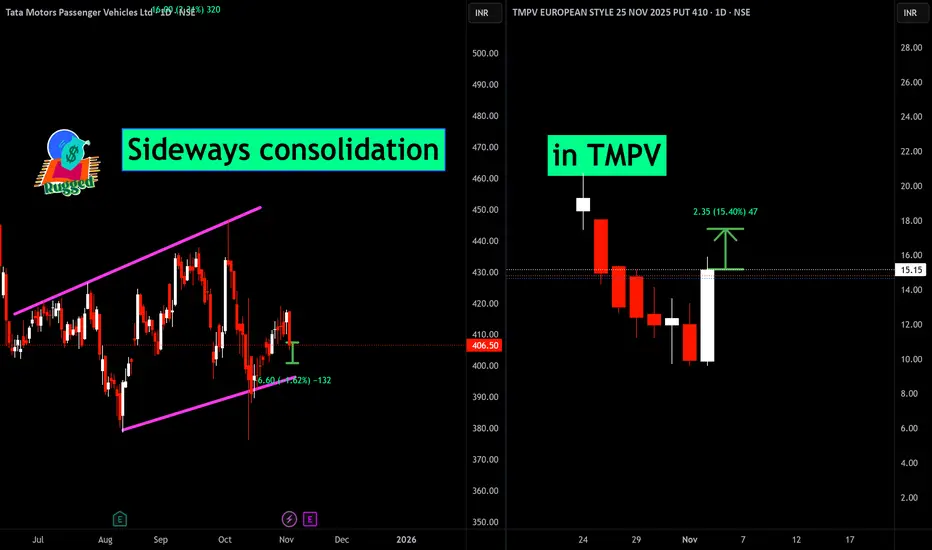
Sideways consolidation in TMPVSideways Range/Consolidation: The price moves between relatively defined support and resistance levels without a decisive breakout, indicating indecision and market participants waiting for stronger cues. This phase is often referred to as a rectangle or box pattern, commonly seen before a major move.
Nifty Bulls Cooling Off Before Next Surge?Eyeing a Strategic Entry on Pullback!
Nifty continues to ride the bullish wave 🌊, but signs point to a short-term pullback by Friday’s close — a healthy dip before the next leg up. 📉➡️📈
🎯 Trade Setup:
🔹 Buy: 25850 CE (28th Oct Expiry)
🔹 Entry: ₹165
🔹 Stop Loss: ₹135
🔹 Target: ₹225
📌 Risk-Reward is solid, with smart positioning ahead of next week’s move.
🧠 Stay patient — let the price come to you. Great setups don’t chase, they wait and strike. 🐅
Your feedback drives our content and keeps everyone trading smarter. Let’s make those pips together! 🚀
Happy Trading,
– The InvestPro Team

Trade Options Like a ProUnderstanding Options
Options are financial contracts that give the buyer the right, but not the obligation, to buy or sell an underlying asset at a predetermined price, called the strike price, before or on a specific date, known as the expiration date. There are two primary types of options:
Call Options – These give the holder the right to buy the underlying asset at the strike price. Traders buy call options when they anticipate that the price of the asset will rise.
Put Options – These give the holder the right to sell the underlying asset at the strike price. Traders buy put options when they expect the asset price to fall.
The buyer of an option pays a premium to the seller (writer) for this right. The premium is influenced by factors such as the underlying asset price, strike price, time to expiration, volatility, and prevailing interest rates.
Understanding these basic components is crucial because professional traders make decisions based not only on the direction of the market but also on the pricing dynamics of the options themselves.
Key Concepts for Professional Trading
1. The Greeks
Professional options traders rely heavily on the Greeks, which measure different risks associated with an option:
Delta (Δ): Measures how much the option price will change with a $1 change in the underlying asset. A delta of 0.5 means the option price moves half as much as the asset.
Gamma (Γ): Measures the rate of change of delta with respect to the underlying price. High gamma means the delta can change quickly, which is important for risk management.
Theta (Θ): Measures the time decay of an option. Options lose value as expiration approaches, and theta quantifies this effect.
Vega (ν): Measures sensitivity to volatility. High vega options are more affected by changes in market volatility.
Rho (ρ): Measures sensitivity to interest rates, which is more relevant for long-term options.
Mastering the Greeks allows professional traders to predict how options prices behave under different market conditions and helps in adjusting positions to manage risk effectively.
2. Implied Volatility (IV)
Implied volatility reflects the market’s expectation of future price fluctuations in the underlying asset. A high IV indicates that the market anticipates significant price movement, while low IV suggests stability. Professionals use IV to gauge whether options are overpriced or underpriced. Buying options when IV is low and selling when IV is high is a common strategy among experienced traders.
3. Option Pricing Models
Option pricing models like the Black-Scholes model or the Binomial model help traders calculate the theoretical value of an option. These models consider factors like underlying price, strike price, time to expiration, volatility, and risk-free interest rates. While professionals rarely rely solely on these models for trading decisions, understanding them helps in identifying mispriced options and arbitrage opportunities.
Developing a Professional Trading Strategy
Trading options like a pro requires a structured approach and a well-defined strategy. Strategies can be broadly divided into directional, non-directional, and hedging strategies.
1. Directional Strategies
Directional strategies are used when a trader has a clear view of the market direction.
Buying Calls/Puts: The simplest strategy. Buy calls if bullish and puts if bearish. Risk is limited to the premium paid, while profit potential can be significant.
Bull Call Spread: Buy a call at a lower strike and sell another call at a higher strike. This reduces cost while capping potential profit.
Bear Put Spread: Buy a put at a higher strike and sell a put at a lower strike. This strategy benefits from a declining market but limits both risk and reward.
2. Non-Directional Strategies
Non-directional strategies profit from market movements regardless of direction, often relying on volatility or time decay.
Straddles: Buy both a call and a put at the same strike price. Profitable if the underlying asset moves significantly in either direction.
Strangles: Buy a call and a put at different strike prices. Less expensive than a straddle but requires a larger move to be profitable.
Iron Condor: Sell an out-of-the-money call and put while buying further out-of-the-money options to limit risk. Profitable in low-volatility markets.
3. Hedging Strategies
Professional traders often use options to hedge existing positions to protect against downside risk.
Protective Put: Buy a put option to safeguard a long stock position. This ensures that losses are capped while retaining upside potential.
Covered Call: Sell a call option against a stock you own. Generates income through premiums but limits upside if the stock rallies significantly.
Risk Management
Trading options without effective risk management is a recipe for disaster. Professionals use several key principles:
Position Sizing: Never risk more than a small percentage of capital on a single trade.
Stop Losses: Set predefined levels for exiting trades to prevent large losses.
Diversification: Avoid concentrating on a single asset or sector. Spread risk across different instruments.
Regular Monitoring: Options require active management due to time decay and changing volatility. Professionals continuously adjust positions based on market conditions.
Psychological Discipline
Trading options professionally isn’t just about numbers; it’s also about psychology. Emotional control is vital because the leverage and complexity of options can amplify fear and greed. Professionals develop discipline through:
Adhering to a trading plan: Never deviate based on emotions.
Accepting small losses: Losses are part of trading. The key is to control them before they grow.
Continuous learning: Markets evolve, and successful traders adapt strategies to changing conditions.
Tools and Technology
Professional options traders leverage advanced tools to gain an edge:
Trading Platforms: Interactive brokers, Thinkorswim, and Zerodha Kite Pro provide sophisticated options analytics.
Screeners and Scanners: Identify trading opportunities based on volatility, price movements, or unusual activity.
Algorithmic Trading: Some pros use automated strategies to execute trades with precision and speed.
Practical Tips for Aspiring Professionals
Start Small: Begin with paper trading or small positions until comfortable with strategy and market behavior.
Focus on Learning Greeks: Understand how delta, gamma, theta, and vega affect your trades.
Track Performance: Maintain a trading journal to analyze wins, losses, and mistakes.
Stay Informed: Monitor economic indicators, earnings reports, and geopolitical events that influence markets.
Avoid Overtrading: Patience is key. Wait for high-probability setups rather than forcing trades.
The Advantages of Professional Options Trading
Trading options like a pro offers several distinct advantages:
Leverage: Options allow control of a larger position with less capital.
Flexibility: Traders can profit in rising, falling, or sideways markets.
Risk Management: Proper strategies can limit losses while allowing for substantial gains.
Income Generation: Strategies like covered calls can provide consistent income streams.
Common Mistakes to Avoid
Even experienced traders fall into traps if not careful:
Ignoring Time Decay: Long options lose value over time; ignoring theta can be costly.
Overestimating Volatility: Buying options in high-volatility periods without justification can lead to overpriced positions.
Lack of Plan: Trading without a clear strategy leads to impulsive and emotional decisions.
Neglecting Risk Management: Overleveraging or failing to diversify can wipe out portfolios.
Conclusion
Trading options like a pro requires a blend of knowledge, strategy, discipline, and continuous adaptation. Professionals understand the nuances of options pricing, volatility, and market behavior. They employ structured strategies, manage risk meticulously, and maintain psychological discipline. Options trading is not a shortcut to quick wealth; it is a sophisticated skill that rewards preparation, patience, and precision.
By mastering the fundamentals, leveraging advanced tools, and committing to continuous learning, any trader can elevate their approach from casual speculation to professional-grade options trading. With experience, practice, and discipline, the complexity of options transforms from a daunting challenge into a powerful instrument for wealth creation and portfolio protection.
Banknifty Unclear SignalsI traded on Banknifty 56,900 PE twice today 10 lots each time, in the morning around 11 am and again around 2 pm by making nominal profit of ₹ 500 after charges. Trend seesm to be missing today as the overall view is positive but the index is facing a hurdle at around 57,000.
Short-covering can't be neglected though say after 2:30 - 2:45 pm, if buying surge comes at 56,800 spot.
Option Trading What Is an Option?
An option is a contract between two parties: the buyer and the seller (writer).
It gives the buyer the right—but not the obligation—to buy or sell an underlying asset at a predetermined price (called the strike price) before or on a specific date (called the expiry date).
There are two main types of options:
Call Option – gives the buyer the right to buy the asset.
Put Option – gives the buyer the right to sell the asset.

Zero-Day Option TradingIntroduction
Zero-Day Option Trading (ZDOT), also referred to as 0DTE (Zero Days to Expiration) trading, has gained significant traction in the last few years, particularly among professional traders and high-frequency retail traders. The strategy revolves around trading options contracts that expire on the same day, often within hours. This ultra-short-term trading method leverages rapid price movements, time decay, and market volatility to generate potential profits.
While zero-day options present extraordinary opportunities, they also carry significant risk due to their extreme sensitivity to market movements and time decay. Understanding ZDOT requires knowledge of option pricing, market mechanics, strategies, and risk management.
Understanding Options Basics
Before diving into zero-day options, it is essential to revisit the fundamentals of options trading.
Options Types
Call Options: Give the holder the right, but not the obligation, to buy an underlying asset at a predetermined price (strike price) before expiration.
Put Options: Give the holder the right, but not the obligation, to sell an underlying asset at a predetermined price before expiration.
Option Pricing Factors
Options prices are derived from models like the Black-Scholes Model and are influenced by:
Underlying Asset Price: Directly affects the intrinsic value.
Strike Price: Determines whether the option is in-the-money (ITM), at-the-money (ATM), or out-of-the-money (OTM).
Time to Expiration (Theta): Represents time decay; the closer to expiry, the faster an option loses value.
Volatility (Vega): Higher volatility increases the option premium.
Interest Rates and Dividends: Affect the option's theoretical price marginally.
Option Greeks
Understanding Greeks is crucial in ZDOT because the risk-reward profile changes rapidly:
Delta (Δ): Measures the option’s price sensitivity to the underlying asset price.
Gamma (Γ): Measures the rate of change of delta; higher gamma means price reacts sharply to underlying moves.
Theta (Θ): Measures time decay; for zero-day options, theta is extremely high.
Vega (ν): Measures sensitivity to volatility.
Rho (ρ): Measures sensitivity to interest rates (less relevant for ZDOT).
What Are Zero-Day Options?
Zero-day options are options contracts that expire the same day they are traded. For example, if an S&P 500 index option expires on a Friday, a trader could enter a trade on Friday morning, and the contract would expire by market close.
Key characteristics include:
Ultra-Short Expiry: Time decay is at its peak, and option value is primarily extrinsic premium.
High Gamma: Small moves in the underlying asset lead to large changes in option delta.
Rapid Time Decay: Theta accelerates as the expiration hour approaches, making options highly sensitive.
High Liquidity (for popular underlyings): Index options (like SPX, NIFTY, or ES futures options) often offer tight spreads and high volume.
Speculative Nature: Traders often use these options for intraday speculation rather than long-term investment.
Why Zero-Day Options Have Gained Popularity
Several factors contribute to the rise of zero-day option trading:
Low Capital Requirement: Traders can take positions on small premium options with relatively low capital.
Leverage: Due to low cost and high delta, traders can control large exposure to the underlying asset.
High Reward Potential: Rapid price swings in the underlying asset can generate significant profits.
Advanced Technology and Platforms: High-frequency trading, algorithmic strategies, and low-latency platforms make execution faster.
Volatility-Based Strategies: Intraday volatility spikes (like FOMC announcements, economic data releases, or corporate earnings) create opportunities for short-term traders.
How Zero-Day Options Work
1. Time Decay (Theta)
Zero-day options are almost entirely driven by time decay. Theta measures the rate at which the option loses extrinsic value:
For long option holders, the value decays extremely fast.
For short option sellers, theta works in their favor as options lose value rapidly as expiration approaches.
Example:
A call option on NIFTY at-the-money might lose 50–70% of its value in the last few hours of trading due to accelerated theta.
2. Delta and Gamma
Delta indicates the likelihood of the option ending in-the-money:
At-the-money (ATM) zero-day options have a delta near 0.5.
Gamma is extremely high for ATM zero-day options, meaning small movements in the underlying asset can swing the delta dramatically.
Traders can quickly move from profitable to loss positions or vice versa.
3. Volatility (Vega)
Vega sensitivity diminishes as expiration nears.
ZDOT primarily focuses on underlying price movement rather than changes in implied volatility.
Volatility spikes can still create profitable opportunities, especially during market open or news events.
4. Liquidity and Execution
SPX, NIFTY, ES, and other major indices offer high liquidity.
Tight bid-ask spreads reduce slippage and execution risk.
Deep liquidity is essential as zero-day trading relies on quick entry and exit.
Common Zero-Day Option Strategies
Traders employ several strategies depending on their risk tolerance and market outlook. These can broadly be divided into directional and non-directional strategies.
1. Directional Strategies
These strategies assume a specific price movement in the underlying asset:
a. Buying ATM Calls or Puts
Traders speculate on intraday price movement.
High gamma can turn small moves into significant profits.
High risk due to rapid theta decay.
b. Long Straddle
Buying ATM call and put simultaneously.
Profitable if underlying moves sharply in either direction.
Risk: If the market remains flat, both options decay quickly.
c. Long Strangle
Buying slightly OTM call and put.
Less expensive than straddle.
Requires a larger move to become profitable.
2. Non-Directional / Theta-Based Strategies
These strategies aim to profit from time decay rather than directional moves:
a. Short Straddle
Selling ATM call and put simultaneously.
Profits if the market remains stable.
Extremely risky if underlying moves sharply.
b. Short Strangle
Selling OTM call and put.
Less risky than straddle, but still vulnerable to large moves.
c. Iron Condor
Selling OTM call and put while buying further OTM options for risk protection.
Profitable in low-volatility markets.
Limited risk, limited reward.
Risk Management in Zero-Day Option Trading
Zero-day trading is inherently high-risk. Effective risk management is critical for survival:
Position Sizing
Avoid allocating more than 1–2% of capital per trade.
Use small, calculated trades to minimize the risk of a total loss.
Stop Losses
Intraday exit rules are essential.
Some traders use delta-neutral stop-loss triggers or predefined percentage losses.
Hedging
Short and long combinations like iron condors provide built-in hedges.
Delta-hedging strategies can neutralize directional risk.
Volatility Awareness
Avoid trading near extreme market events unless prepared for rapid moves.
Sudden volatility spikes can wipe out short positions in seconds.
Market Hours and Liquidity
Trade during the most liquid periods (e.g., market open and last hour).
Avoid trading in illiquid or thinly traded instruments.
Advantages of Zero-Day Option Trading
High Profit Potential
The leverage effect of options can lead to significant intraday gains.
Rapid Feedback
Traders quickly see results, allowing rapid learning and strategy adjustments.
Flexibility
Both directional and non-directional strategies can be employed.
Scalability
Strategies can be applied across indices, stocks, commodities, and ETFs.
Disadvantages and Risks
Extreme Risk
A single wrong move can result in 100% loss of the premium for long options or unlimited loss for naked shorts.
Requires Expertise
Understanding Greeks, market microstructure, and timing is crucial.
Psychological Pressure
High-speed trading can induce stress and emotional errors.
Limited Margin for Error
Zero-day options leave no room for delayed reaction or misjudgment.
Practical Tips for Traders
Start Small
Begin with minimal exposure to learn the mechanics.
Focus on Highly Liquid Instruments
SPX, NIFTY, and ES are preferred due to tight spreads.
Use Technical Analysis
Short-term support, resistance, and intraday momentum patterns can guide entry and exit.
Combine Strategies
Blend directional bets with non-directional strategies to manage risk.
Track News Events
Economic releases and earnings can cause rapid price swings suitable for zero-day trades.
Regulatory and Brokerage Considerations
Some brokers restrict zero-day option trading due to high risk.
Margin requirements may be higher for selling options.
Traders must be aware of regulatory guidelines in their region (e.g., SEBI in India, SEC in the U.S.).
Conclusion
Zero-Day Option Trading is a high-risk, high-reward intraday trading technique that has gained popularity due to low capital requirements, rapid time decay, and leverage opportunities. While it offers extraordinary profit potential, the strategy demands discipline, expertise, and rigorous risk management. Traders must understand option Greeks, market volatility, liquidity, and intraday technical patterns to succeed.
For beginners, zero-day trading should be approached cautiously, starting with small trades and focusing on education. For experienced traders, it offers a tool to exploit rapid market movements, hedge positions, or implement advanced strategies like gamma scalping.
In essence, ZDOT is not for the faint-hearted—it is a strategy where precision, timing, and strategy execution determine success. With proper planning and discipline, zero-day option trading can be a powerful component of an intraday trader’s toolkit.

Option Trading Derivatives (FAO)1. Introduction to FAO
FAO stands for Futures and Options, two major categories of derivatives. Derivatives are financial contracts whose value depends on an underlying asset, such as stocks, indices, commodities, currencies, or interest rates. The primary purpose of derivatives is to provide risk management, speculation, and arbitrage opportunities.
Key Features of FAO:
Leverage: Traders can control large positions with relatively small capital.
Hedging: Protect against adverse price movements in underlying assets.
Speculation: Profit from both rising and falling markets.
Liquidity: Popular derivatives are highly liquid, allowing easy entry and exit.
2. Understanding Options
Options are contracts that give the buyer the right, but not the obligation, to buy or sell an underlying asset at a predetermined price (strike price) before or on a specific date (expiry date). There are two primary types of options:
Call Option: Gives the holder the right to buy the underlying asset at a fixed price.
Put Option: Gives the holder the right to sell the underlying asset at a fixed price.
Key Terminology:
Strike Price: Price at which the option can be exercised.
Premium: Price paid to purchase the option.
Expiry Date: Date on which the option contract becomes invalid.
In-the-Money (ITM), Out-of-the-Money (OTM), At-the-Money (ATM): Terms describing the relationship between the strike price and current market price.
Options provide flexibility and multiple strategies for traders, allowing them to maximize profits or minimize losses.
3. Understanding Futures
Futures are standardized contracts that oblige the buyer to purchase and the seller to sell an asset at a predetermined price and date. Unlike options, futures contracts carry an obligation to buy or sell, not just a right. They are widely used in commodities, indices, currencies, and interest rate markets.
Key Features:
Leverage: Futures allow traders to control large positions with a fraction of the total contract value.
Mark-to-Market: Daily settlement of gains and losses ensures liquidity and transparency.
Hedging and Speculation: Corporations hedge against price fluctuations, while traders speculate on market direction.
4. FAO Trading Mechanics
Trading FAO requires understanding market participants, contract specifications, and trading platforms.
Market Participants:
Hedgers: Minimize risk exposure. Example: Farmers selling crop futures.
Speculators: Profit from market movements. Example: Traders buying stock options.
Arbitrageurs: Exploit price differences across markets.
Contract Specifications:
Lot Size: Minimum quantity for trading a contract.
Expiry Cycle: Monthly or weekly expirations.
Margin Requirements: Funds required to maintain positions.
Trading FAO occurs on regulated exchanges, such as NSE, BSE, CME, and ICE, providing standardized contracts, clearing mechanisms, and transparent pricing.
5. FAO Trading Strategies
5.1 Option Strategies:
Covered Call: Holding underlying shares and selling call options to earn premium.
Protective Put: Buying a put option to protect against downside risk.
Straddle: Buying call and put options simultaneously to profit from volatility.
Iron Condor: Combining multiple options to profit from low volatility.
5.2 Futures Strategies:
Hedging: Lock in future prices to mitigate risk.
Speculation: Taking positions to profit from expected price movements.
Spread Trading: Buying and selling related futures to benefit from relative price changes.
6. Risk Management in FAO
Trading derivatives involves high risk due to leverage and market volatility. Effective risk management strategies include:
Setting Stop-Loss Orders: Automatically exit losing trades.
Position Sizing: Allocate only a fraction of capital to each trade.
Diversification: Spread exposure across assets and strategies.
Volatility Analysis: Understand implied and historical volatility for better decision-making.
7. Advantages of FAO Trading
Leverage for Higher Returns: Small capital can control large positions.
Hedging Capabilities: Protect investments from market swings.
Flexibility and Variety: Multiple strategies suit different market conditions.
Transparency and Regulation: Exchange-traded derivatives ensure standardized practices.
8. Challenges and Risks
High Volatility: Prices can move quickly against traders.
Complexity: Advanced knowledge is required for strategy execution.
Margin Calls: Traders may need to deposit additional funds if losses occur.
Liquidity Risk: Not all options or futures are highly liquid.
9. Regulatory Environment
FAO markets are tightly regulated to protect investors:
Securities and Exchange Board of India (SEBI) regulates derivatives trading in India.
Commodity Futures Trading Commission (CFTC) and SEC regulate U.S. markets.
Exchange Rules: Each exchange sets contract specifications, margin requirements, and trading hours.
10. Practical Examples of FAO Trading
Hedging Example: A wheat farmer sells wheat futures to lock in a price before harvest.
Speculation Example: A trader buys Nifty call options expecting an upward movement.
Volatility Trading: Traders implement straddles and strangles during earnings season to profit from price swings.
11. Technology and FAO
Modern FAO trading relies heavily on algorithmic trading, AI analytics, and real-time data. Platforms offer:
Option Chain Analysis: View all available options for a stock or index.
Greeks Monitoring: Delta, Gamma, Theta, Vega – to understand option sensitivity.
Risk Management Tools: Automated alerts and portfolio analytics.
12. Conclusion
Option trading derivatives (FAO) represent a powerful set of financial instruments that combine leverage, flexibility, and risk management. While they provide opportunities for profit maximization, they also carry substantial risks, making knowledge, discipline, and strategy essential. Successful FAO trading requires understanding market mechanics, advanced strategies, and effective risk management to harness the potential of these derivatives responsibly.
Trendline Support in INFOSYSInfosys showing strong trendline support and a bullish move from key levels. October 1520 call option surged nearly 11% with rising momentum—looks promising for follow-through trades.

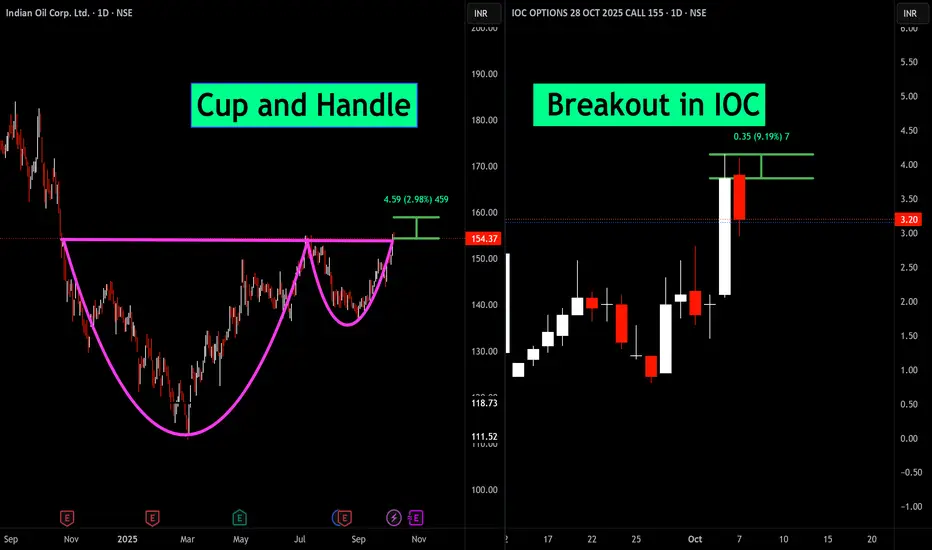
Cup and Handle breakout in IOCdian Oil Corporation (IOC) is exhibiting a classic cup and handle pattern on the daily chart, signaling bullish momentum. Recently, a breakout was observed, supported by strong volume, with a potential upside of nearly 3%. Options activity also confirms bullish sentiment. This setup offers a compelling risk-reward opportunity for traders.
Advanced Option Strategies1. Understanding Advanced Option Strategies
Advanced option strategies involve combining multiple option positions in ways that optimize outcomes for specific market scenarios. Unlike straightforward buying or selling of single options, these strategies use combinations of calls, puts, or both, sometimes with different strike prices and expiration dates, to achieve nuanced profit/loss structures.
Traders use these strategies for several reasons:
Hedging: Protect existing portfolios against adverse price movements.
Speculation: Take calculated bets on the direction, volatility, or timing of price movements.
Income Generation: Earn premiums through selling options while controlling risk.
Volatility Trading: Profit from changes in implied volatility rather than price direction alone.
To successfully implement advanced option strategies, traders must have a deep understanding of option Greeks (Delta, Gamma, Theta, Vega, and Rho), as these metrics determine how option prices react to market movements.
2. Popular Advanced Option Strategies
2.1 Spreads
Spreads involve buying and selling options of the same type (calls or puts) on the same underlying asset but with different strike prices or expiration dates. Spreads can be broadly categorized into vertical spreads, horizontal spreads, and diagonal spreads.
2.1.1 Vertical Spreads
Vertical spreads involve buying and selling options with the same expiration date but different strike prices. They can be bullish or bearish.
Bull Call Spread: Buy a call at a lower strike and sell a call at a higher strike. This strategy limits both profit and loss and is profitable if the stock price rises moderately.
Bear Put Spread: Buy a put at a higher strike and sell a put at a lower strike. Profitable if the underlying declines moderately.
Example: A stock trading at $100:
Buy 1 call at $100 strike for $5
Sell 1 call at $110 strike for $2
Net cost: $3, Maximum gain: $7, Maximum loss: $3
2.1.2 Horizontal (Time) Spreads
Also called calendar spreads, horizontal spreads involve options with the same strike price but different expiration dates.
Long Calendar Spread: Buy a long-dated option and sell a short-dated option at the same strike. This strategy profits from low volatility and time decay.
2.1.3 Diagonal Spreads
A combination of vertical and horizontal spreads, diagonal spreads involve options with different strikes and expiration dates. These allow traders to take advantage of both time decay and directional moves.
2.2 Straddles and Strangles
These strategies are designed to profit from volatility, regardless of price direction.
2.2.1 Straddle
A straddle involves buying a call and a put at the same strike price and expiration date. Traders use straddles when they expect significant price movement but are unsure of the direction.
Pros: Unlimited profit potential if the underlying makes a large move.
Cons: High cost due to purchasing two options, risk of losing premium if the price remains stable.
2.2.2 Strangle
A strangle is similar to a straddle but uses out-of-the-money options. This makes it cheaper but requires a bigger price movement to be profitable.
Example: Stock at $100:
Buy 1 OTM call at $105
Buy 1 OTM put at $95
Outcome: Profitable if the stock moves significantly beyond $105 or below $95.
2.3 Butterfly Spreads
Butterfly spreads are limited-risk, limited-reward strategies that involve three strike prices. The most common is the call butterfly spread:
Buy 1 call at lower strike
Sell 2 calls at middle strike
Buy 1 call at higher strike
This strategy profits if the underlying price remains near the middle strike at expiration. Variants include put butterflies and iron butterflies.
Iron Butterfly: Combines a call and put spread, offering a strategy that benefits from low volatility with defined risk and reward.
2.4 Condors
Condor strategies, like butterflies, involve four strikes and aim to profit from a narrow price range.
Iron Condor: Sell an OTM put and OTM call, and buy further OTM put and call to limit risk.
Pros: Generates income in low volatility markets.
Cons: Limited profit, requires precise range predictions.
2.5 Ratio Spreads
Ratio spreads involve buying and selling options in unequal quantities. For instance, a trader might buy 1 call and sell 2 calls at a higher strike.
Pros: Can generate credit upfront, benefit from moderate moves.
Cons: Unlimited risk if the underlying moves sharply beyond the sold options.
2.6 Backspreads
Backspreads are the opposite of ratio spreads: they involve selling fewer options and buying more further out-of-the-money options. Traders use them when expecting large moves in the underlying asset.
Example: Sell 1 ATM call, buy 2 OTM calls.
Outcome: Profitable if the stock surges, limited risk if the stock drops slightly.
2.7 Synthetic Positions
Synthetic strategies replicate the payoff of holding the underlying asset using options:
Synthetic Long Stock: Buy a call and sell a put at the same strike and expiration.
Synthetic Short Stock: Sell a call and buy a put.
These strategies allow traders to gain exposure to price movements without actually holding the underlying stock.
2.8 Box Spread
A box spread is a combination of a bull call spread and a bear put spread, effectively creating a riskless arbitrage if executed correctly.
Profit/Loss: The spread’s value converges to the difference between strikes at expiration, usually used by professional traders for interest rate arbitrage.
3. Practical Considerations
Advanced option strategies require careful planning and risk management. Key considerations include:
Volatility: High implied volatility increases option premiums, affecting the profitability of debit vs. credit strategies.
Time Decay (Theta): Strategies like calendar spreads benefit from time decay, while long options lose value as expiration approaches.
Liquidity: Illiquid options can have wide bid-ask spreads, increasing execution costs.
Greeks Management: Understanding Delta, Gamma, Vega, and Theta is critical for predicting how positions respond to market changes.
Margin Requirements: Complex strategies, especially those with naked positions, may require significant margin.
4. Risk Management
Even advanced strategies carry risks. Techniques to manage risk include:
Diversification: Avoid putting all capital into a single underlying or strategy.
Stop-Loss Orders: Predefined exit points can prevent large losses.
Position Sizing: Limit exposure per trade to a fraction of the total portfolio.
Adjustments: Rolling or converting positions can mitigate adverse movements.
5. Advantages of Advanced Option Strategies
Flexibility: Traders can structure strategies for bullish, bearish, or neutral market conditions.
Defined Risk: Many strategies offer limited-risk exposure compared to outright positions in the underlying asset.
Profit from Volatility: Traders can earn profits even in sideways markets.
Portfolio Hedging: Protects against large moves without selling assets.
6. Challenges and Limitations
Complexity: Understanding multiple legs, Greeks, and expiration cycles can be challenging.
Execution Costs: Commissions and slippage can reduce profits.
Market Timing: Many strategies require precise timing and predictions.
Psychological Pressure: Multi-leg trades can be stressful and require constant monitoring.
7. Conclusion
Advanced option strategies offer traders sophisticated tools to manage risk, speculate on price movements, and generate income. From spreads and straddles to butterflies and synthetic positions, each strategy has unique characteristics suited for different market conditions. Success in these strategies requires a thorough understanding of option pricing, Greeks, volatility, and risk management techniques. While the rewards can be substantial, the complexity and risks demand disciplined execution, continual learning, and practice.
For traders willing to invest the time in mastering these strategies, options provide a versatile framework to navigate today’s dynamic markets and optimize portfolio performance.