Cup and Handle Breakout and Retested in NYKAANykaa triggers a textbook cup-and-handle breakout on the daily chart, followed by a clean retest that flips resistance into support and signals continuation potential toward the measured move. The 28 Oct 2025 257.5 CE premium surges alongside, reflecting bullish momentum but remains sensitive to decay if price slips back below the neckline
Optionstrading

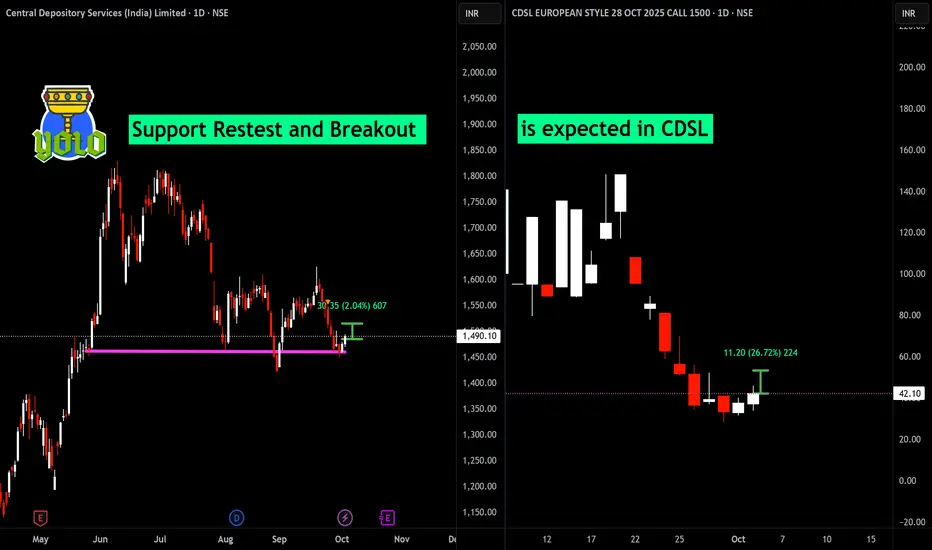
Support Restest and Breakout is expected in CDSLCentral Depository Services Ltd (CDSL) has shown a classic support retest and breakout on the daily chart, indicating renewed bullish strength from a key zone. The price respected previous support and has now confirmed a breakout with momentum, aligning with technical breakout trading setups. Additionally, a sharp recovery is visible in the CDSL 1500 call option, suggesting a potential reversal and short-term upside for both the equity and its derivative.
Cup & Handle Breakout Expected in Punjab National Bank A classic Cup & Handle formation is visible on Punjab National Bank’s weekly chart, signaling a potential bullish breakout. The pattern is nearing its resistance, with a clear neckline retest. Currently, there is confluence with higher volume on the breakout attempt, further supporting the bullish thesis.
Cup & Handle resistance is set around ₹113 on the weekly chart, with a recent confirmation candle and strong price action.
Call option for 28th October 2025 (113 CE) has moved sharply, with a gain of nearly 12% intraday as speculative interest increases.
Watch for sustained closes above ₹113 for trend continuation. Target for the pattern hints at another 2–3% upside, with stop-loss just below breakout level for risk management.
This post reflects a sell-side trading perspective; maintain strict discipline with entries and exits.

Bullish Iron Condor on Nifty (30th September 2025 expiry)Hello Traders!
Just like we shared the August Iron Condor setup, here comes the fresh plan for September expiry.
Nifty is trading around 24,840 and we are witnessing a defined range between 23,750 – 25,500.
Such ranges are perfect for premium eating strategies like the Iron Condor, where time decay works in our favour as long as the index stays inside the zone.
So here’s the September plan:
Position Details
Sell 2 lots 24,700 PE @ 140.30
Buy 2 lots 24,400 PE @ 71.60
Sell 2 lots 25,500 CE @ 53.95
Buy 2 lots 25,750 CE @ 22.95
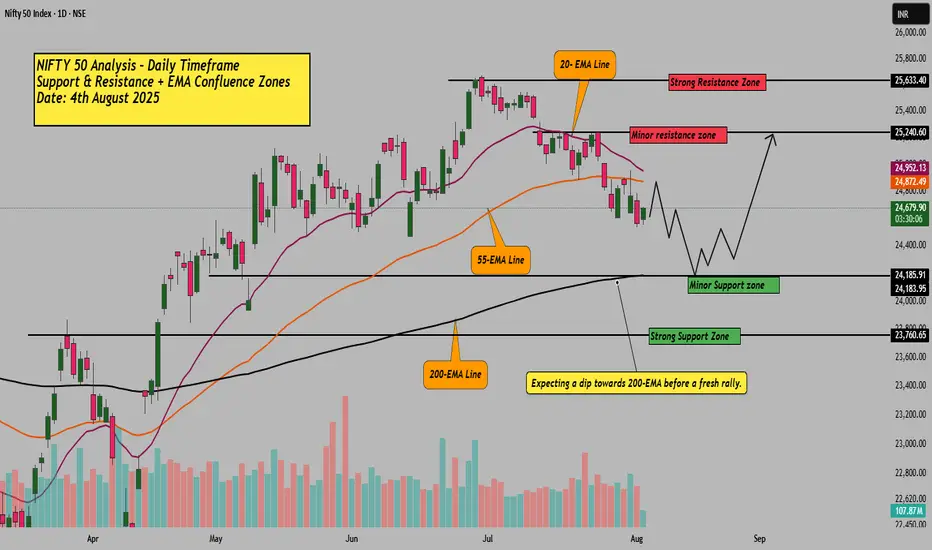
We expect Nifty to consolidate between 23,750 – 25,500 as per our technical chart analysis .
200-DEMA is acting as dynamic support
Strong resistance capped near 25,500 – 26,270
Until a breakout happens on either side, premium sellers can stay in control
This Iron Condor gives us a balanced risk-reward setup and benefits from time decay while keeping risk well-defined.
Why I Like This Setup:
Limited loss , defined by hedge positions
High probability of success as long as Nifty remains in the range
Best suited for traders focusing on consistent income from option writing
Rahul’s Tip 👉 Discipline in trade management is always more important than the setup itself.
For income-based option strategies, always check for:
Key events and news (policy, RBI, FED, budgets, etc.)
Breakout signals beyond short strikes
Quick exit or adjustment if market moves out of range
Disclaimer This post is for educational purposes only . Please manage your risk and position sizing wisely.
Avoid large quantities at once – it’s always better to scale in gradually once the range confirms.

F&O Watchlist – Stocks with Action👋 Hello Traders!
Welcome to the Daily Options Trade Setup & Watchlist – 12th Sept 2025 🚀
The market is showing strong activity today with fresh long build-ups, surging volumes, and supportive OI data across key F&O names. Volatility remains balanced, creating opportunities for traders to ride the momentum while keeping risks in check.
This watchlist highlights stocks where data and trend are aligning, giving us a clearer picture of market sentiment and possible trading setups.
Let’s explore today’s opportunities 👇
ADANIENT | 11th Sept 2025
Overall Bias: Bullish
Spot Price: ₹2,446.50
Trend: Uptrend
Volatility: Moderate (IV ~24–25%)
Ideal Strategy Mix: Directional Bullish + OTM Convexity + Hedge via PE
________________________________________
✅ Bullish Trade (Naked options as per trend)
ADANIENT 2450 CE LTP @ ₹34.45
Why:
Long Build-up at 2450 CE → OI ↑ 173% with Price ↑ 118% (strong confirmation).
Volume surge 986% → heavy participation.
Delta 0.46 → balance of ITM probability & convexity.
Rising IV (5.9%) → supports premium expansion.
________________________________________
⚠️ Contrarian Trade (Naked options against trend)
ADANIENT 2300 PE LTP @ ₹21.50
Why:
Acts as a downside hedge in case of reversal.
IV 28.7% with IV ↑ 26.8% → room for premium spike.
Delta -0.33 → controlled risk hedge.
Suitable for protection if momentum stalls.
________________________________________
🎯 Strategy Trade (As per trend + OI data)
Bull Call Spread → 2450 CE LTP @ ₹34.45 & 2550 CE LTP @ ₹10.75
Why:
• Aligns with strong bullish OI build-up (2400–2600 CE cluster).
• Captures upside momentum with defined risk.
• Excellent R:R (1:3+) → low cost, high potential reward.
• Short CE hedge (2550) cuts theta decay and risk.
________________________________________
________________________________________
ADANIPORTS | 11th Sept 2025
Overall Bias: Bullish
Spot Price: ~₹1,438 (near 1440 zone)
Trend: Uptrend
Volatility: Moderate (IV ~23–26%)
Ideal Strategy Mix: Directional Bullish + OTM Convexity + Hedge via PE
________________________________________
✅ Bullish Trade (Naked options as per trend)
ADANIPORTS 1440 CE LTP @ ₹13.90
Why:
Long Build-up at 1440 CE → OI ↑ 100.6% with Price ↑ 50.3% (classic long-side confirmation).
Volume surge 524.5% → strong participation.
Delta 0.39 → sweet spot between ITM probability & convexity.
IV rising 20.7% → supportive of premium expansion.
________________________________________
⚠️ Contrarian Trade (Naked options against trend)
ADANIPORTS 1400 CE LTP @ ₹27.90 (used here as hedge/play on exhaustion)
Why:
Higher ITM CE with Delta 0.51 → limited convexity, may underperform if momentum slows.
OI ↑ only 12.3% → weaker build-up compared to mid-OTM strikes.
IV 23.0% (low side) → less premium expansion potential.
Can act as a contrarian hedge if market consolidates below 1440.
________________________________________
🎯 Strategy Trade (As per trend + OI data)
Bull Call Spread → ADANIPORTS 1440 CE LTP @ ₹13.90 & 1500 CE LTP @ ₹4.95
Why:
• Strong long build-ups across 1420–1460 strikes → confirms directional bias.
• Captures upside momentum with defined risk using OTM convexity (1500 CE).
• Excellent R:R (≈ 1:2+) → low debit, higher potential payoff.
• Short OTM CE (1500) reduces theta decay and caps risk.
________________________________________
________________________________________
AUROPHARMA | 11th Sept 2025
Overall Bias: Bullish
Spot Price: ~₹1,118 (near 1120 zone)
Trend: Uptrend
Volatility: Rich (IV ~30–32%)
Ideal Strategy Mix: Bullish Directional + Debit Spreads (IV hedging) + Convexity via OTM Calls
________________________________________
✅ Bullish Trade (Naked options as per trend)
AUROPHARMA 1140 CE LTP @ ₹18.95
Why:
Long Build-up → Price ↑ 351% with OI ↑ 280% (strong long confirmation).
Volume surge 1792% → very active participation.
Delta 0.40 → sweet convexity with good ITM odds.
IV rising 6.2% → supports premium expansion.
________________________________________
⚠️ Contrarian Trade (Naked options against trend)
AUROPHARMA 1060 CE LTP @ ₹64.25 (deep ITM hedge / slowdown risk)
Why:
Short covering at 1060 CE (OI ↓ 15.8%) → weaker continuation if fresh longs don’t add.
Higher ITM delta (0.74) → less convexity, less reward-to-risk.
IV rich (31.6%) → premiums already expensive.
Could underperform if price momentum cools off near resistance zones.
________________________________________
🎯 Strategy Trade (As per trend + OI data)
Bull Call Spread → AUROPHARMA 1120 CE LTP @ ₹26.65 & 1160 CE LTP @ ₹13.10
Why:
• Strong long build-ups between 1120–1160 strike cluster confirm bullish continuation.
• Captures upside momentum with limited debit exposure.
• IV ~30+ → spreads preferred over naked calls (reduces risk of IV crush).
• Good convexity → balance of ITM probability and upside leverage.
________________________________________
________________________________________
HAL | 11th Sept 2025
Overall Bias: Bullish
Spot Price: ~₹4,650 (near 4600–4700 zone)
Trend: Uptrend
Volatility: Moderate (IV ~25–28%)
Ideal Strategy Mix: Directional Bullish + OTM Convexity + Debit Spreads for IV balance
________________________________________
✅ Bullish Trade (Naked options as per trend)
HAL 4800 CE LTP @ ₹36.10
Why:
Long Build-up → Price ↑ 16.8% with OI ↑ 7% (fresh long confirmation).
Volume surge 72.5% → active participation.
Delta 0.34 → balance of convexity & ITM probability.
IV 25.7% → stable with upside potential.
________________________________________
⚠️ Contrarian Trade (Naked options against trend)
HAL 4500 CE LTP @ ₹158.55 (short covering driven, contrarian hedge)
Why:
Short covering at 4500 CE → OI ↓ 13.7% while Price ↑ 12.8%.
Delta 0.61 → deeper ITM, lower convexity.
Volume dropped 56% → thinner liquidity, size should be reduced.
Better suited as hedge / risk balancer in case momentum stalls.
________________________________________
🎯 Strategy Trade (As per trend + OI data)
Bull Call Spread → HAL 4800 CE LTP @ ₹36.10 & 4900 CE LTP @ ₹21.00
Why:
• OI build-up across 4700–4900 CE cluster confirms bullish continuation.
• Debit spread reduces IV risk (IV ~25–27%) and limits loss.
• Defined-risk setup with convexity at 4900 CE.
• Cleaner R:R profile compared to naked long calls.
________________________________________
________________________________________
TCS | 11th Sept 2025
Overall Bias: Bullish
Spot Price: ~₹3,135 (near 3140 zone)
Trend: Uptrend
Volatility: Moderate (IV ~17–19%)
Ideal Strategy Mix: Directional Bullish + OTM Convexity + Debit Spread to balance low IV
________________________________________
✅ Bullish Trade (Naked options as per trend)
TCS 3200 CE LTP @ ₹25.05
Why:
Long Build-up → Price ↑ 9.2% with OI ↑ 7.9% (long confirmation).
IV 17.9% → moderate, stable for option buying.
Delta 0.36 → sweet spot of convexity & ITM odds.
Fits directional bullish bias near resistance breakouts.
________________________________________
⚠️ Contrarian Trade (Naked options against trend)
TCS 3100 CE LTP @ ₹67.85 (short covering driven, weaker momentum trade)
Why:
Short covering at 3100 CE → OI ↓ 4% while Price ↑ 6.1%.
Volume dropped 72.5% → thin liquidity, size down.
IV 17.2% easing -5.3% → weaker premium expansion.
Higher ITM delta (0.59) → less convexity, limited upside gearing.
________________________________________
🎯 Strategy Trade (As per trend + OI data)
Bull Call Spread → TCS 3200 CE LTP @ ₹25.05 & 3300 CE LTP @ ₹8.25
Why:
• Strong long build-ups in 3140–3200 CE cluster confirm bullish continuation.
• Low IV environment (17–19%) → debit spreads attractive.
• Defined-risk setup with convexity via OTM CE (3300).
• Good balance of premium outlay vs reward with capped downside.
________________________________________
________________________________________
📘 My Trading Setup Rules
Avoid Gap Plays → Check pre-open price action to avoid trades influenced by gap-ups/gap-downs.
Breakout Entry Only → Enter trades only if price breaks previous day’s High (for bullish trades) or Low (for bearish trades).
Watch Volume for Confirmation → Monitor volume closely. No volume = No trade.
Enter on Strong Candle + Volume → Execute the trade only if a strong candle appears with increasing volume in the direction of the trade.
Defined Risk:Reward Only → Take trades only if R:R is favorable (ideally ≥ 1:2).
Premium Disclaimer → Option premiums shown are based on EOD prices — real-time premiums may vary during execution.
Time Frame Preference → Trade with your preferred time frame — this strategy works across intraday or positional setups.
⚠️ Disclaimer – Please Read Carefully
The information shared here is meant purely for learning and awareness. It is not a buy or sell recommendation and should not be taken as investment advice. I am not a SEBI-registered investment advisor, and all views expressed are based on personal study, chart patterns, and publicly available market data.
Trading — whether in stocks or options — carries risk. Markets can move unexpectedly, and losses can sometimes exceed the money you have invested. Past performance or past setups do not guarantee future results.
If you are a beginner, treat this as a guide to understand how the market works — practice on paper trades before risking real money. If you are experienced, always assess your own risk, position sizing, and strategy suitability before entering trades.
Consult a SEBI-registered financial advisor before making any real trading decision. By engaging with this content, you acknowledge full responsibility for your trades and investments.
💬 Found this useful?
🔼 Give this post a Boost to help more traders discover clean, structured learning.
✍️ Drop your thoughts, questions, or setups in the comments — let’s grow together!
🔁 Share with fellow traders and beginners to spread awareness.
👉 “If you liked this breakdown, follow for more clean, structured setups with discipline at the core.”
🚀 Stay Calm. Stay Clean. Trade With Patience.
Trade Smart | Learn Zones | Be Self-Reliant 📊
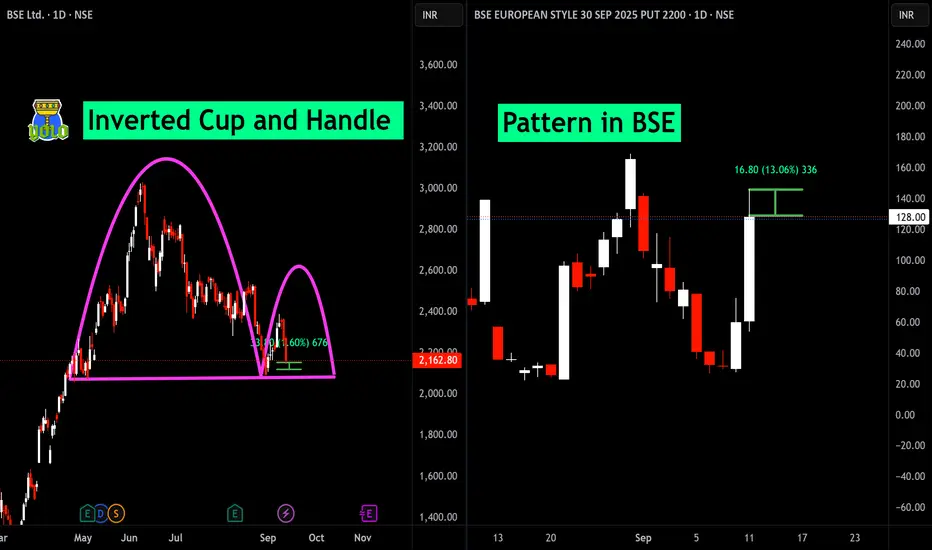
Inverted Cup and Handle Pattern in BSE Spotting high-probability setups in BSE Ltd.: The left chart reveals a textbook Inverted Cup and Handle breakdown, signaling potential bearish continuation if support cracks. On the right, the BSE option displays a powerful breakout pattern, offering a 13% move and momentum for agile traders.
Why It Matters
Bearish momentum building in BSE Ltd.—watch for downside triggers.
Volatility surge in BSE PUT options—opportunity for decisive trades.
Take action: Review your positions and set alerts for key breakdown or breakout levels to capture the next move. For premium setups and live market calls—connect today!
Support Breakdown in SUZLONSupport breakdown in Suzlon points to increasing bearishness and the possibility of continued declines.
Suzlon's put option exhibits strength, suggesting market participants are positioning for downside risk.
Monitoring both price action and option activity can help navigate market momentum during breakdowns.

STT Explained – The Silent Tax That Eats Into Your Profits!Hello Traders!
Many traders calculate their profit after entry and exit, but forget a hidden cost that reduces it every single time: STT (Securities Transaction Tax) .
It doesn’t look big on paper, but over time it silently eats into your profits. Let’s break it down in simple terms.
What is STT?
STT is a tax charged on the value of every buy/sell transaction in equities, derivatives, and ETFs.
It was introduced to generate revenue for the government and applies to all market participants.
Example: If you buy shares worth ₹1,00,000, you pay a small percentage as STT. The same applies when you sell. In options and futures, it’s mostly charged on the sell side.
Where Does STT Apply?
Equity Delivery: STT applies on both buy and sell transactions.
Equity Intraday: STT is charged only on the selling side.
Futures: STT applies only on the sell side of the contract.
Options: STT applies on the sell side, but at a higher rate compared to futures.
Why Traders Must Care About STT
It Reduces Net Profit: Even if your trade looks profitable on the chart, STT takes away a portion. In short-term trading, these small cuts add up.
Impacts Scalpers & Option Sellers Most: Since they do high-frequency trading, STT can eat into a large chunk of their returns.
Hidden in Brokerage Statements: Many traders blame “brokerage” for high costs, but in reality, STT is often the bigger factor.
Rahul’s Tip:
Always calculate the real cost of trading , not just entry and exit points. Brokerage, STT, GST, exchange fees, all matter.
Sometimes the best trade is not the most frequent one, but the one with the best cost-to-profit balance.
Conclusion:
STT may look small, but it has a big impact over time.
The difference between a losing trader and a winning trader is often not the strategy, but how well they manage costs like STT.
If this post cleared your doubts on STT, like it, drop your experience in comments, and follow for more trading education that really matters!
Cup and Handle Breakout in NYKAAA potential Cup and Handle breakout is forming in Nykaa (FSN E Commerce Ventures) on the daily chart. Price action shows a classical rounded base followed by handle consolidation, with prices breaking above resistance at ₹229.50. The breakout target is approximately ₹4.70 higher (about 2% upside), supporting bullish momentum. Additionally, the September 230 CALL option has surged 13.89%, reinforcing strong follow-through and trader interest on the breakout. This setup fits textbook continuation patterns and suggests a positive short-term outlook for Nykaa as long as prices hold above the breakout level.
Trade Context for Posting
Pattern: Cup and Handle breakout.
Underlying: FSN E Commerce Ventures (Nykaa), NSE daily chart.
Breakout Level: ₹229.50.
Target Upside: ₹4.70 (approx. 2% from breakout), option up 13.89%.
Validation: Bullish price action, volume expansion, supportive option activity.
Trade Plan: Consider long positions above ₹229.50, with stop-loss below the handle low. Watch for sustained momentum and volume, aiming for the indicated breakout objective.
This trade is based on established technical analysis principles, showing strong risk-reward from current levels, and is backed by sharp movement in related call options.

Risk Management in Trading1. Introduction: Why Risk Management Matters
Trading in the stock market, forex, commodities, or crypto can be exciting. The charts move, opportunities appear every second, and profits can be made quickly. But at the same time, losses can also come just as fast. Many traders, especially beginners, enter the market thinking only about profits. They study chart patterns, indicators, or even copy trades from others. But what most ignore at the beginning is the one factor that separates successful traders from unsuccessful ones: Risk Management.
Risk management is not about how much profit you make; it’s about how well you protect your money when things go wrong. Trading is not about being right every time. Even the best traders in the world lose trades. What makes them profitable is that their losses are controlled and their winners are allowed to grow.
Without risk management, even the best strategy will eventually blow up your account. With risk management, even an average strategy can keep you in the game long enough to learn, improve, and grow your capital.
2. What is Risk Management in Trading?
Risk management in trading simply means the process of identifying, controlling, and minimizing the amount of money you could lose on each trade.
It’s not about avoiding risk completely (that’s impossible in trading). Instead, it’s about managing risk in such a way that:
No single trade can wipe out your account.
You survive long enough to take advantage of future opportunities.
You build consistency over time instead of gambling.
Think of trading like driving a car. Speed (profits) is fun, but brakes (risk management) keep you alive.
3. The Golden Rule of Trading: Protect Your Capital
The first rule of trading is simple: Don’t lose all your money.
If you lose 100% of your capital, you are out of the game forever.
Here’s the reality of losses:
If you lose 10% of your account, you need 11% profit to recover.
If you lose 50%, you need 100% profit to recover.
If you lose 90%, you need 900% profit to recover.
This shows how dangerous big losses are. The more you lose, the harder it becomes to get back to break-even. That’s why smart traders focus less on “How much profit can I make?” and more on “How much loss can I tolerate?”
4. Key Elements of Risk Management
Let’s go step by step through the major pillars of risk management in trading:
a) Position Sizing
This is about deciding how much money to risk in a single trade. A common rule is:
Never risk more than 1–2% of your account on one trade.
Example:
If your account size is ₹1,00,000 and you risk 1% per trade → maximum loss allowed = ₹1,000.
This way, even if you lose 10 trades in a row (which happens sometimes), you’ll still have 90% of your capital left.
b) Stop Loss
A stop loss is a price level where you accept that your trade idea is wrong and you exit automatically.
Without a stop loss, emotions take over. Traders hold losing trades, hoping they’ll turn profitable, but often the losses grow bigger.
Always set a stop loss before entering a trade.
Respect it. Don’t move it further away.
Example:
If you buy a stock at ₹500, you might set a stop loss at ₹480. If price drops to ₹480, your loss is controlled, and you live to trade another day.
c) Risk-to-Reward Ratio
Before entering any trade, ask yourself: Is the reward worth the risk?
If your stop loss is ₹100 away, your target should be at least ₹200 away. That’s a 1:2 risk-to-reward ratio.
Why is this important?
Because even if you win only 40% of your trades, you can still be profitable with a good risk-to-reward system.
Example:
Risk ₹1,000 per trade, aiming for ₹2,000 reward.
Out of 10 trades:
4 winners = ₹8,000 profit
6 losers = ₹6,000 loss
Net profit = ₹2,000
This shows you don’t need to win every trade. You just need to control losses and let winners run.
d) Diversification
Don’t put all your money in one stock, sector, or asset. Spread your risk.
If one trade goes bad, others can balance it.
Avoid overexposure in correlated assets (like buying 3 IT stocks at once).
e) Avoiding Over-Leverage
Leverage allows you to control big positions with small money. But leverage is a double-edged sword: it multiplies both profits and losses.
Beginners often blow accounts using high leverage. Rule of thumb:
Use leverage cautiously.
Never take a position so big that one wrong move wipes out your account.
5. Psychological Side of Risk Management
Risk management is not only about numbers; it’s also about mindset and discipline.
Greed makes traders risk too much for quick profits.
Fear makes them close trades too early or avoid good opportunities.
Revenge trading happens after a loss, when traders try to win it back immediately by increasing position size. This often leads to bigger losses.
Good risk management keeps emotions under control. When you know that your maximum loss is limited, you trade with a calm mind.
6. Practical Risk Management Techniques
Here are some practical tools and methods traders use:
Fixed % Risk Model – Always risk a fixed percentage (like 1% per trade).
Fixed Amount Risk Model – Always risk a fixed rupee amount (like ₹500 per trade).
Trailing Stop Loss – Adjusting stop loss as price moves in your favor, to lock in profits.
Daily Loss Limit – Stop trading for the day if you lose a set amount (say 3% of account). This prevents emotional overtrading.
Portfolio Heat – Total risk across all open trades should not exceed 5–6% of account.
7. Common Mistakes Traders Make in Risk Management
Not using stop losses.
Risking too much in one trade.
Moving stop losses further away to “give trade more room.”
Trading with borrowed money.
Doubling position after a loss (“martingale” strategy).
Ignoring position sizing.
These mistakes often lead to blown accounts.
8. Case Studies
Case 1: Trader Without Risk Management
Rahul has ₹1,00,000. He risks ₹20,000 in one trade (20% of account). If he loses 5 trades in a row, his account goes to zero. Game over.
Case 2: Trader With Risk Management
Anita has ₹1,00,000. She risks only 1% per trade (₹1,000). Even if she loses 10 trades in a row, she still has ₹90,000 left to keep trading and learning.
Who will survive longer? Anita.
And survival is the key in trading.
9. Risk Management Beyond Single Trades
Risk management is not only about one trade, but also about your whole trading career:
Set Monthly Risk Limits → e.g., stop trading if you lose 10% in a month.
Keep Emergency Funds → Never put all life savings into trading.
Withdraw Profits → Don’t leave all profits in the trading account. Take some out regularly.
Review Trades → Keep a trading journal to learn from mistakes.
10. The Connection Between Risk Management & Consistency
Consistency is what separates professionals from gamblers. Professional traders don’t look for a “big jackpot trade.” Instead, they look for consistent growth.
Risk management provides that consistency by:
Preventing big drawdowns.
Allowing small steady growth.
Giving confidence in the system.
Trading is like running a business. Risk management is your insurance policy. No business survives without managing costs and risks.
Final Thoughts
Risk management may not sound exciting compared to finding “hot stocks” or “sure-shot trades.” But in reality, it’s the most important part of trading.
Think of it this way:
Strategies may come and go.
Indicators may change.
Markets may behave differently.
But risk management principles stay the same.
The traders who last years in the market are not the ones who find secret formulas. They are the ones who respect risk.
If you master risk management, you can survive long enough to improve, adapt, and eventually succeed. Without it, no matter how smart or lucky you are, the market will take your money.
August Iron Condor Setup on Nifty – Premium Eating Strategy!Hello Traders!
Just like we nailed the July Iron Condor, here comes the fresh setup for August expiry.
Nifty is trading around 24680 and we are seeing tight range movement with no clear trend for now. In such times, Iron Condor becomes a powerful income-generating strategy for option sellers, especially if the market stays within a defined range.
So here's the plan:
Strategy Type:
Bullish Iron Condor on Nifty (28th August 2025 expiry)
Position Details:
Sell 2x 24300 PE @ 130.05
Buy 2x 23800 PE @ 53.75
Sell 2x 25000 CE @ 172.50
Buy 2x 25500 CE @ 49.30
Strategy payoff graph:
Strategy Rationale:
We’ve created a wide range between 24101 to 25199 as our breakeven zone. As long as Nifty stays in this range by expiry, we collect full premium and enjoy time decay.
Why We Call It Bullish Iron Condor:
We’ve kept the Put side tighter and Call side slightly wider, meaning we have a bullish bias but still want to benefit from a range-bound expiry.
Rahul Tip:
Don’t go for iron condors blindly, always check for major events, news, or breakout signals. A sudden breakout or breakdown can flip your setup. Adjust or exit if market moves out of your defined zone.
Disclaimer:
This strategy is for educational purposes only. Please do your own risk management and position sizing. Avoid taking full quantity at once — better to scale in once the range confirms.
Options Trading Strategies1. Introduction to Options Trading
Options are one of the most versatile financial instruments available in the stock market. Unlike straightforward stock trading, where you buy or sell shares, options give you the right but not the obligation to buy or sell an underlying asset at a pre-determined price within a specific time.
Because of their flexibility, options allow traders to:
Hedge against risk,
Generate income,
Speculate on market direction, or
Even profit from volatility itself.
Options trading strategies are structured combinations of options (calls, puts, or both) that help traders tailor risk and reward according to their outlook. Understanding these strategies is essential because options are a double-edged sword: they can multiply profits but also magnify risks if used incorrectly.
2. Basics of Options
Before diving into strategies, let’s recap the key concepts:
Call Option → Right to buy the asset at a certain price. (Bullish in nature)
Put Option → Right to sell the asset at a certain price. (Bearish in nature)
Strike Price → Pre-decided price at which the option can be exercised.
Premium → Cost of buying the option.
Expiry → The date on which the option contract ends.
In the Money (ITM) → Option has intrinsic value.
Out of the Money (OTM) → Option has no intrinsic value, only time value.
Understanding these basics is critical because all option strategies are built using calls and puts in different combinations.
3. Why Use Option Strategies?
Traders and investors don’t just buy calls and puts randomly. Instead, they use structured strategies to achieve specific goals:
Hedging: Protecting a stock portfolio against downside risk.
Income Generation: Earning premium by selling options.
Speculation: Taking directional bets with limited risk.
Volatility Trading: Profiting from changes in implied volatility regardless of direction.
4. Categories of Option Strategies
Option strategies can be grouped into four main categories:
Bullish Strategies → Profit when the market rises (e.g., Bull Call Spread, Covered Call).
Bearish Strategies → Profit when the market falls (e.g., Bear Put Spread, Protective Put).
Neutral Strategies → Profit when the market stays in a range (e.g., Iron Condor, Butterfly).
Volatility Strategies → Profit from volatility expansion/contraction (e.g., Straddle, Strangle).
5. Popular Options Trading Strategies
Let’s dive into some of the most commonly used strategies with examples, payoff logic, pros, and cons.
5.1 Covered Call (Income Strategy)
How it works: Hold the stock + sell a call option.
Example: Own 100 shares of Reliance at ₹2,500. Sell a call with strike ₹2,600 for ₹30 premium.
Payoff:
If Reliance stays below ₹2,600 → keep shares + earn ₹30 premium.
If Reliance rises above ₹2,600 → shares are sold at ₹2,600 but you still keep the premium.
Pros: Steady income, reduces cost of holding.
Cons: Caps upside potential.
5.2 Protective Put (Insurance Strategy)
How it works: Hold stock + buy a put option.
Example: Buy Infosys at ₹1,400. Buy a put with strike ₹1,350 at ₹20 premium.
Payoff:
If stock rises → unlimited upside, only premium lost.
If stock falls → downside limited at strike price.
Pros: Protects against big losses.
Cons: Premium cost reduces profit.
5.3 Bull Call Spread (Moderately Bullish)
How it works: Buy a lower strike call + Sell a higher strike call.
Example: Buy Nifty 19,800 Call at ₹200, Sell 20,200 Call at ₹80. Net cost = ₹120.
Payoff:
Max profit = Difference in strikes – net premium = ₹400 – ₹120 = ₹280.
Max loss = ₹120 (premium paid).
Pros: Limited risk, limited reward.
Cons: Capped profit even if market rallies big.
5.4 Bear Put Spread (Moderately Bearish)
How it works: Buy a higher strike put + sell a lower strike put.
Example: Buy 19,800 Put at ₹220, Sell 19,400 Put at ₹100. Net cost = ₹120.
Payoff:
Max profit = Difference in strikes – net premium = ₹400 – ₹120 = ₹280.
Max loss = ₹120 (premium).
Pros: Controlled bearish play.
Cons: Capped profit.
5.5 Straddle (Volatility Play)
How it works: Buy 1 Call + 1 Put of the same strike.
Example: Nifty at 20,000 → Buy 20,000 Call (₹200) + Buy 20,000 Put (₹180). Total = ₹380.
Payoff:
If Nifty moves sharply either side (>₹380), profit.
If Nifty stays near 20,000, loss of premium.
Pros: Profits from big moves.
Cons: Expensive, time decay hurts if market is flat.
5.6 Strangle (Cheaper Volatility Play)
How it works: Buy OTM Call + OTM Put.
Example: Buy 20,200 Call (₹120) + Buy 19,800 Put (₹100). Cost = ₹220.
Payoff: Needs larger move than straddle, but cheaper.
Pros: Lower cost.
Cons: Requires significant market move.
5.7 Iron Condor (Range-Bound Strategy)
How it works: Combine a Bull Put Spread + Bear Call Spread.
Example:
Sell 19,800 Put, Buy 19,600 Put.
Sell 20,200 Call, Buy 20,400 Call.
Payoff: Profit if Nifty stays between 19,800–20,200.
Pros: Income from stable markets.
Cons: Risk if market breaks range.
5.8 Butterfly Spread (Range-Bound, Low Risk)
How it works: Buy 1 ITM Call, Sell 2 ATM Calls, Buy 1 OTM Call.
Example:
Buy 19,800 Call, Sell 2×20,000 Calls, Buy 20,200 Call.
Payoff: Max profit if expiry near middle strike (20,000).
Pros: Low risk, good for low-volatility outlook.
Cons: Limited reward, needs precise prediction.
5.9 Collar Strategy (Hedged Investment)
How it works: Own stock + Buy Put + Sell Call.
Purpose: Locks range of returns.
Example: Own stock at ₹1,000. Buy 950 Put, Sell 1,050 Call.
Pros: Protects downside at low cost.
Cons: Caps upside.
5.10 Calendar Spread (Time-based Play)
How it works: Sell near-term option + Buy long-term option of same strike.
Profit: From time decay of short option while holding longer-term exposure.
Best used: In low-volatility environments.
6. Risk-Reward Analysis
Limited Risk Strategies: Spreads, Condors, Butterflies.
Unlimited Profit Potential: Long Calls, Long Puts, Straddles.
Income-Oriented: Covered Calls, Iron Condor, Credit Spreads.
Hedging-Oriented: Protective Puts, Collars.
7. How to Choose the Right Strategy
Factors to consider:
Market View (Bullish, Bearish, Neutral).
Volatility Outlook (High, Low, Expected to rise/fall).
Risk Appetite (Aggressive vs Conservative).
Capital Availability (Some require margin).
8. Common Mistakes in Option Strategies
Over-leveraging (buying too many contracts).
Ignoring time decay (theta).
Trading only naked options without strategy.
Not adjusting positions when market moves.
Misjudging volatility.
9. Advanced Insights
Option Greeks: Delta, Gamma, Theta, Vega, Rho – help measure sensitivity to price, time, and volatility.
Implied Volatility (IV): Crucial in pricing; high IV inflates premiums, low IV reduces them.
Adjustments: Rolling options, converting spreads to condors, hedging with futures.
10. Conclusion
Options trading strategies are powerful tools. They allow traders to make money in bullish, bearish, sideways, or volatile markets – but only if used with discipline. A successful trader doesn’t just guess direction; they analyze market conditions, volatility, risk tolerance, and then select the appropriate strategy.
The beauty of options lies in flexibility: you can limit risk, enhance returns, or even profit from time and volatility itself. But the danger lies in misuse – options should be treated as structured financial instruments, not lottery tickets.

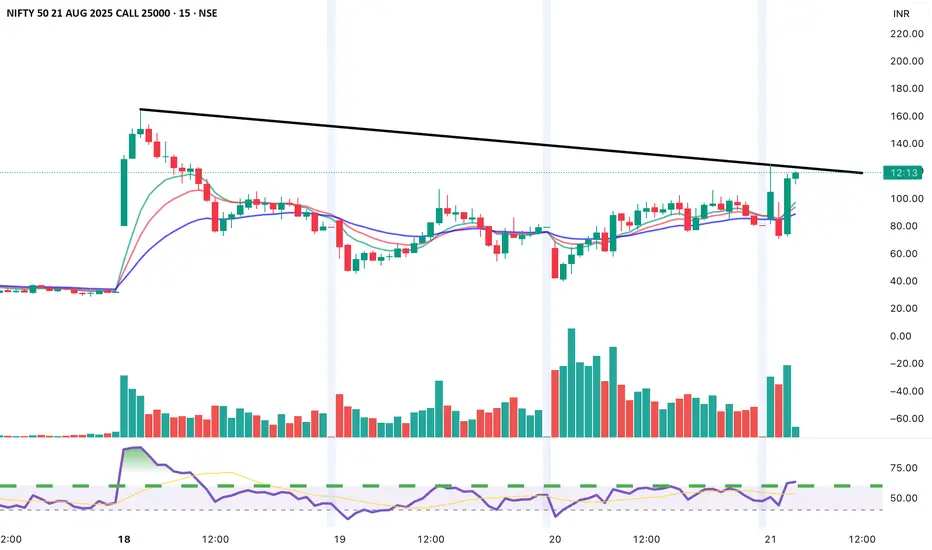
NIFTY 50 21 AUG 2025 CE 25000 – 15min Chart🔹 Price just tested the falling trendline resistance.
🔹 RSI is turning up from neutral zone.
🔹 Volume spike shows buying interest.
⚡ Buy Entry Plan
Buy Above: ₹120 (trendline breakout confirmation).
Stop Loss: ₹105.
Target 1: ₹140
Target 2: ₹160
(Valid only if candle closes above trendline with volume).
🔹 Price is facing trendline resistance (black line).
🔹 RSI near 70 → showing overbought zone.
🔹 Strong rejection candle at resistance with volume.
⚡ Entry Idea
Sell / Short Entry: Around ₹113–115 (near resistance zone).
Stop Loss: Above ₹135.
Target: ₹95 / ₹85 support levels.
(Only for intraday/scalping, not positional 🚨).
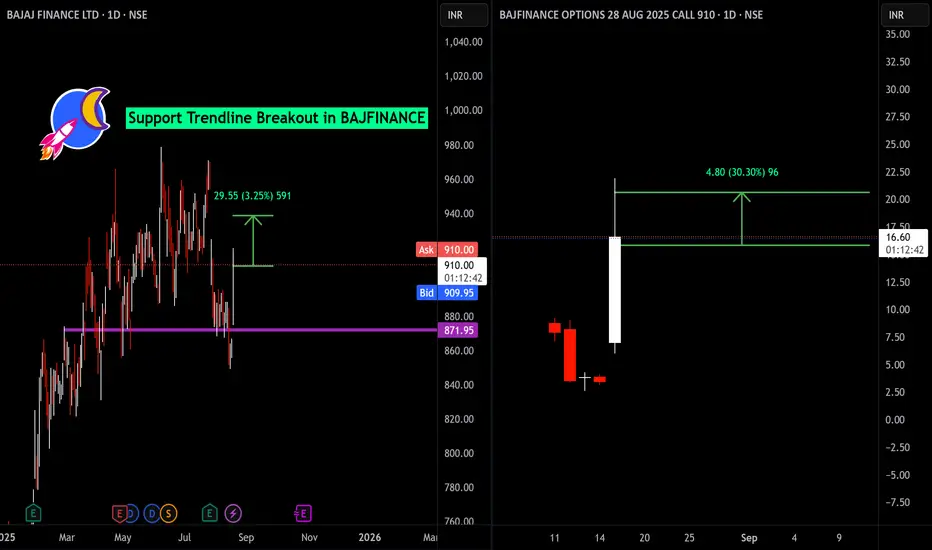
Support Trendline Breakout in BAJFINANCEBAJFINANCE has delivered a strong support trendline breakout, closing at ₹909.60 (+5.59%). Price action confirms bullish momentum above the ₹872 support, with a measured move target of ₹29.55 (3.25%). Notably, the 910 CALL option for 28 AUG 2025 surged 378% to ₹16.50, showing aggressive call buying and aligning with the spot breakout. This synchronization between spot and derivatives indicates robust upward sentiment. Traders may consider maintaining a bullish bias while managing risk below the breakout level. Monitoring volumes and options activity is essential for trend confirmation. This analysis is for educational purposes only.
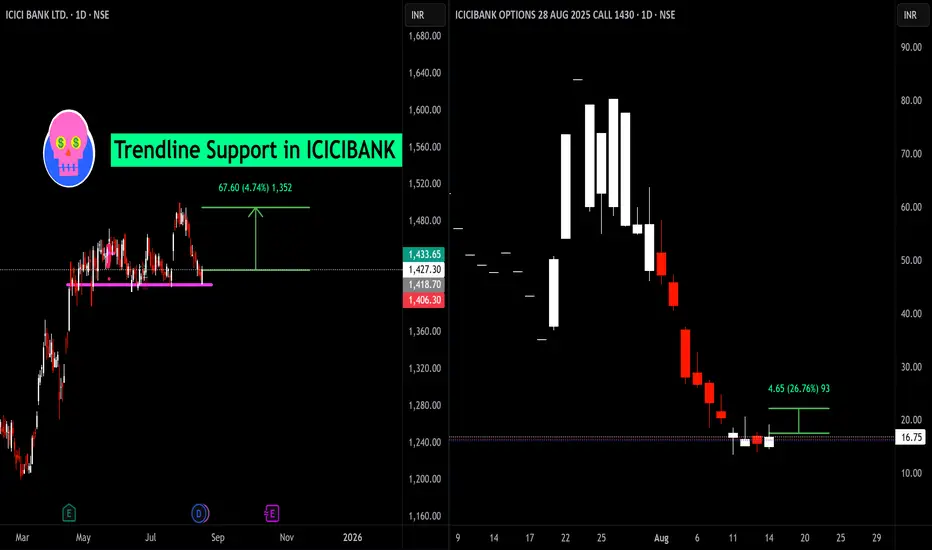
Trendline Support and Options Reaction in ICICI Bank📈 ICICI Bank at Major Support!
ICICI Bank is testing a crucial trendline support zone around ₹1,418–₹1,427 after a lengthy pullback. Historically, this level has held strong, showing multiple bounces — making it a key area for traders to watch.
Support Level: ₹1,418–₹1,427
Potential Upside: The chart highlights a recovery zone towards ₹1,433 and beyond, with a bounce of ₹67.6 (approx. 4.74%) possible if support holds firm.
🟢 Options Perspective: 1430 CE (August Expiry)
The ICICI Bank 1,430 August call option has shown significant volatility:
Current Premium: ₹16.75
Recent Change: +₹4.65 (+26.76%) on a single session!
MARUTI OPTIONS TRADE SETUP📊 MARUTI OPTIONS TRADE SETUP – 12 Aug 2025
MARUTI is currently trading near ₹12,840, and the overall market mood looks bullish. We are seeing strong buying interest in call options from the 12,800 strike all the way up to 13,500, which means traders are expecting higher prices ahead. On the other hand, put option writers are active between 12,500 and 12,900, which suggests that they believe MARUTI will not fall below these levels anytime soon. The recent short covering at 12,700 CE (call option) along with fresh long positions above the spot price is adding fuel to the upside momentum. Volatility is in a low to moderate range (IV 13–17%), making it a good environment for debit strategies where you pay a premium for a defined-risk trade. For this setup, a combination of bullish directional positions (for momentum) and limited-risk spreads (to control risk) can work well, especially for traders who want to capture upside without taking unlimited exposure.
Bullish Directional Trade –13,000 CE
This trade idea is based on a clear sign of bullish momentum in the market. The 13,000 Call Option has shown a strong long build-up, with open interest (OI) increasing by 39% – meaning more traders are taking fresh long positions, expecting prices to move higher. We also see active call buying not just at 13,000 but also at the 12,900 and 13,200 strike prices, which suggests strong optimism in this price zone. The Delta value of 0.44 means the option moves moderately with the underlying index – giving good upside potential without taking extreme risk. Plus, with Implied Volatility (IV) at just 14.18%, the option is relatively cheap considering the strong upward momentum. In simple terms – the data supports a bullish view, the cost is reasonable, and the trade offers a balanced mix of profit potential and risk control.
Bullish Spread Trade
This Bull Call Spread is a smart bullish strategy that helps you participate in an upward move while keeping your cost and risk under control. In this trade, we buy the 13,000 CE at ₹98.50 and sell the 13,200 CE at ₹50.95. By selling the higher strike call, we reduce our upfront cost, bringing the net investment (net debit) down to just ₹47.55 per share, or ₹2,377.50 total for 50 lots. The maximum profit is capped at ₹7,122.50, which happens if the market closes at or above ₹13,200 on expiry. The maximum loss is limited to ₹2,377.50 — the amount we paid for the spread — making it much safer than buying a naked call. Our break-even level is ₹13,047.55, meaning we start making profits if the price goes above this level. The reason for choosing this structure is that the 13,200 CE also shows strong buying interest (long build-up), which increases the probability of the stock moving into our profitable zone. In short, it’s a low-cost, limited-risk, and favorable risk-reward setup for traders expecting a steady move upwards, without taking the full risk of outright call buying.
Aggressive Bullish Momentum
This trade is designed for situations where we expect strong upward momentum in MARUTI. We are using a Bull Call Spread, which means we buy a lower strike call option (₹12,900 CE @ ₹137) and simultaneously sell a higher strike call option (₹13,300 CE @ ₹37.60). This combination reduces the overall cost compared to buying a call outright, making the trade more affordable while still giving us good profit potential. Here, the total cost (net debit) comes to ₹99.40 per share, or ₹4,970 for 50 shares. If MARUTI moves up strongly toward the ₹13,300 level, our spread reaches its maximum profit potential of ₹15,030. The maximum we can lose is the initial ₹4,970 we invested, which is our fixed risk. The beauty of this setup is that we have a risk-to-reward ratio of about 1:3, meaning we’re risking ₹1 to potentially make ₹3. This is a strategic way to benefit from a strong bullish view while keeping risk capped — perfect for traders who want to balance aggressiveness with controlled exposure.
💡 Open Interest Insights:
From the current data, we can see that almost every At-The-Money (ATM) and Out-of-The-Money (OTM) Call Option up to the 13,500 strike is showing a Long Build-Up. This means traders are actively buying calls, which generally signals that they expect the market to move higher. At the 12,700 CE, we notice Short Covering — here, traders who had earlier sold calls are now buying them back, which usually happens when they believe the level will hold and the market may move up from there. This suggests that 12,700, which may have been a resistance earlier, could now act as a strong support. On the Put Option side, strikes between 12,500 and 12,900 are showing Short Build-Up, meaning traders are selling puts — a sign they expect these levels to hold and the market not to fall below them. Additionally, the fact that Implied Volatility (IV) is low while we are seeing a Long Build-Up means the market is showing steady bullish confidence without panic buying, which can support a sustained upward trend.
⚠️ Disclaimer – Please Read Carefully
The information shared here is meant purely for learning and awareness. It is not a buy or sell recommendation and should not be taken as investment advice. I am not a SEBI-registered investment advisor, and all views expressed are based on personal study, chart patterns, and publicly available market data.
Trading — whether in stocks or options — carries risk. Markets can move unexpectedly, and losses can sometimes be larger than the money you have invested. Past performance or past setups do not guarantee future results.
If you are a beginner, treat this as a guide to understand how the market works — practice on paper trades before risking real money. If you are an experienced trader, remember to assess your own risk, position sizing, and strategy suitability before entering any trade.
Data, prices, and analysis are based on information available as of 12 August 2025, and market conditions can change at any time. Always verify with reliable sources and consult a SEBI-registered financial advisor before making any real trading decision.
By reading, watching, or engaging with this content, you acknowledge that you take full responsibility for your own trades and investments.
💬 Found this useful?
Drop your thoughts, questions, or setups in the comments — let’s grow together!
🔁 Share this post with fellow traders and beginners to spread clean, structure-based learning.
✅ Follow simpletradewithpatience for beginner-friendly setups, price action insights, and disciplined trading content.
🚀 Stay Calm. Stay Clean. Trade With Patience.
Trade Smart | Learn Zones | Be Self-Reliant 📊

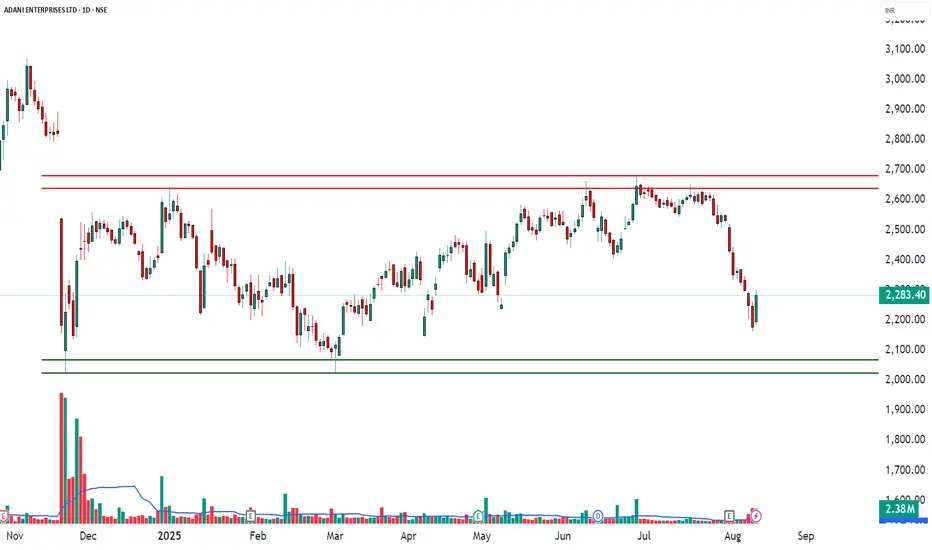
ADANIENT – Options Trade Snapshot📄 ADANIENT – Options Trade Snapshot (Educational Analysis)
Date: 12 Aug 2025
Spot Price: ₹2,283.40
Market View: Bullish bias based on option data & price structure
Overall Sentiment: Positive – multiple Call short coverings and fresh Put short build-ups
Volatility (IV): 34.5% – 51.4% (moderate–high, suggesting option premiums are relatively elevated)
Analysis Purpose: For market study & understanding of option chain signals
1️⃣ Observed Bullish Setup – 2300 Call Option
LTP: ₹64.05
Breakeven (for understanding): ₹2,364.05
Notable Data Points:
Volume spike: 22,099 contracts (166% higher than usual)
IV decreased while price increased → generally indicates aggressive buying
Delta ~0.5 → option price moves about ₹0.50 for every ₹1 in underlying
2️⃣ Observed Neutral-to-Bullish Setup – 2250 Put Option
LTP: ₹51.55
Breakeven (for understanding): ₹2,198.45
Notable Data Points:
Large open interest addition (+105,600 contracts / +47.5%)
Many traders appear to be expecting price to remain above 2250
Theta ~ -2.84/day → higher time decay benefits sellers in such positions
3️⃣ Observed Bullish Spread Structure – 2300 CE + 2400 CE
Leg 1: 2300 CE @ ₹64.05
Leg 2: 2400 CE @ ₹28.40 (short)
Net Cost (for study): ₹35.65
Maximum Risk: ₹6,238.75 (per lot)
Maximum Reward: ₹11,261.25 (per lot)
Breakeven Level: ₹2,335.65
Why:
Limits risk vs naked CE buy while keeping upside potential until 2400.
OI data supports bullish trend above 2300, resistance near 2400.
Lower IV on CE side helps spread entry.
Suitable for moderate upside with controlled risk.
📘 My Trading Setup Rules
Avoid Gap Plays
→ Check pre-open price action to avoid trades influenced by gap-ups/gap-downs.
Breakout Entry Only
→ Enter trades only if price breaks previous day’s High (for bullish trades) or Low (for bearish trades).
Watch Volume for Confirmation
→ Monitor volume closely. No volume = No trade.
Enter on Strong Candle + Volume
→ Execute the trade only if a strong candle appears with increasing volume in the direction of the trade.
Defined Risk:Reward Only
→ Take trades only if R:R is favorable (ideally ≥ 1:2).
Premium Disclaimer
→ Option premiums shown are based on EOD prices — real-time premiums may vary during execution.
Time Frame Preference
→ Trade with your preferred time frame — this strategy works across intraday or positional setups.
Disclaimer:
This analysis is for educational and informational purposes only and is not investment advice. The data presented is based on publicly available market information and represents a study of price action and option chain behaviour. Trading in securities/derivatives involves substantial risk, and past performance is not indicative of future results. Please consult your SEBI-registered investment advisor before making any investment or trading decisions.
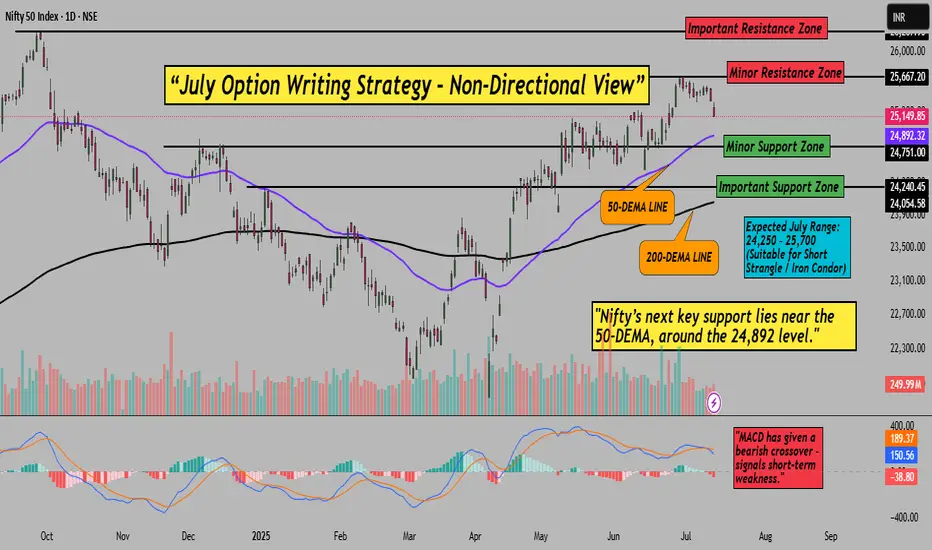
Nifty July Iron Condor Strategy – Premiums are Still Attractive!Hello Traders!
After a strong April, May and June where all three our option writing strategies gave full profits, we are back again with the July edition. Market is respecting the range beautifully, and we are again going with a non-directional Iron Condor setup.
Let’s walk through the logic and setup, based on the recent chart and market behaviour.
Why This Strategy Now? (Based on Chart Analysis)
Resistance Zone: 25,667–26,267 (two-layer zone, minor and major resistance)
Support Zone: 24,240–24,892 (50-DEMA tested, strong support)
Nifty is hovering inside the range – no clear trend, perfect for sideways strategy
MACD has given bearish crossover – adds pressure on upside
Strategy Setup (Iron Condor – 31st July Monthly Expiry)
Sell 24900 PE (2 lots)
Buy 24500 PE (2 lots)
Sell 25500 CE (2 lots)
Buy 25800 CE (2 lots)
Payoff Graph for Strategy:
Why This Works (Logic + Technical View)
Strategy revolves around the 24,750–25,650 zone where Nifty is stuck
Support well aligned to 50-DEMA at 24,892 and 24,240 (intermediate support)
Volatility is neutral, data is range-bound – ideal environment for iron condor writers
No major events or newsflow – market likely to stay inside band
Risk Management & Exit Points
Exit if Nifty gives a clean breakout above 25,700 or breakdown below 24,250
If strategy gives 40–50% max profit early, consider booking
Always keep an eye on VIX and OI buildup for major trend shifts
Rahul's Tip
This strategy has worked beautifully for last 3 months. If you’ve been with me, you know how well Iron Condors can work when market ranges. So we ride the same logic again, until the breakout comes.
Once again – this is a low risk, range-bound iron condor setup with good risk-to-reward.
Have you ever tried a short iron condor on NIFTY? What was your experience? Drop your thoughts below!
If you liked this post, don’t forget to LIKE and FOLLOW!
Regular updates coming with chart tracking, P&L changes and smart exits.
Disclaimer: This analysis is for educational purposes only. Please consult a financial advisor before making investment decisions.
Learn Advanced Institutional Trading🏛️ Learn Advanced Institutional Trading
Step into the world of professional-level trading and master how institutions control the markets.
This advanced level dives deep into:
Market Structure Mastery – Spot trends, breakouts & manipulation zones
Smart Money Tactics – Learn how big players accumulate & distribute silently
Volume & Liquidity Zones – Trade where institutions trade
Precision-Based Entries – No noise, just logic
Risk Management Systems – Protect capital like a pro
Avoid Retail Traps – Outsmart fakeouts, stop hunts & emotional trades
Whether you're trading options, futures, or intraday levels—this training gives you the edge to follow the real money and make consistent, calculated moves.
📌 Upgrade your strategy. Trade with purpose. Win like institutions.

Master Institutional Trading🎯 Master Institutional Trading
Master Institutional Trading means learning to trade like the top financial institutions – with precision, strategy, and data-driven decisions. It’s the highest level of trading where you think and act like banks 🏦, hedge funds 📊, and investment firms 💼.
This mastery involves:
🔍 Understanding how smart money moves
📈 Analyzing volume, liquidity zones, and order flow
💹 Executing large trades without impacting the market
🛡️ Applying risk-controlled option & futures strategies
🧠 Using advanced tools, indicators, and market depth
🔄 Adapting to news, events, and institutional triggers
To master this skill, traders must develop:
📊 Strong technical + fundamental analysis
🧘 Discipline and emotion control
🧾 A solid, backtested trading system
💬 Knowledge of macroeconomic impacts
🧮 Command over greeks, derivatives, and hedging
📌 In simple words:
Mastering Institutional Trading means stepping into the shoes of the pros – learning how the big money operates, and trading with structure, edge, and confidence.

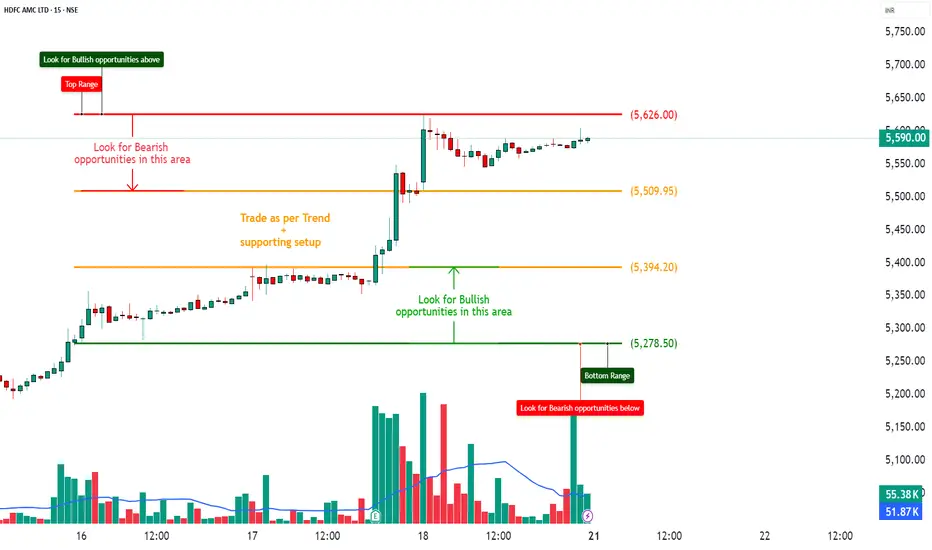
HDFCAMC – Bullish Momentum with Short Covering Base________________________________________________________________________________📈 HDFCAMC – Bullish Momentum with Short Covering Base
📅 Setup Date: 18.07.2025 | ⏱ Timeframe: Daily
📍 Strategy: Momentum Trade Setup with Defined Risk
________________________________________________________________________________
🔍 Overall View
Spot Price: ₹5590
Trend: Bullish Bias – Price sustaining above 5500 with momentum
Volatility: IV ~26–29%, relatively stable with mild contraction
Ideal Strategy Mix: Directional long with partial risk spreads
________________________________________________________________________________
1️⃣ Bullish Trade (Naked options as per trend)
Best CE: Buy 5700 CE @ ₹60.75
Why:
• Long Build-Up (+11.91% OI) with price ↑6.49% = bullish conviction
• Strike just ₹110 above spot → good balance of delta (0.41) and premium
• High TTV (₹89.9 Cr) and stable IV (~26.6%) → institutional activity
• CE 5600 also active, but 5700 is cleaner structure due to fresh longs
________________________________________________________________________________
2️⃣ Bearish Trade (Contrarian Trade – if present)
Best PE: Sell 5500 PE @ ₹59.5
Why:
• Short Build-Up on 5500 PE (+118.7% OI), but price ↓45.84% → strong put writing
• Spot comfortably above strike (₹5590), adding margin of safety
• IV stable → theta decay benefits seller
• Acts as support-level hold strategy in case of mild retracement
________________________________________________________________________________
3️⃣ Strategy Trade (As per trend + OI data)
Strategy: Bull Call Spread → Buy 5700 CE / Sell 5800 CE
→ ₹60.75 / ₹34.15
Net Debit: ₹26.60
Max Profit: ₹100 (spread width) – ₹26.60 = ₹73.40
Max Loss: ₹26.60
Risk:Reward ≈ 1 : 2.75 ✅
Lot Size: 150
Total Risk: ₹3,990
Max Profit: ₹11,010
📊 Breakeven Point: ₹5726.60
📉 Reversal Exit Level: Exit if Spot < ₹5550 (invalidates breakout + weakens CE 5700)
________________________________________________________________________________
Why:
• Strong Long Build-Up at 5700 CE, resistance only mild at 5800
• High IVs make selling 5800 CE favourable → lowers net debit
• Defined risk with RR ≈ 1:2.75 fits your trade rule
• Market supports bullish continuation over 5600-5650 levels
________________________________________________________________________________
📘 My Trading Setup Rules
Avoid Gap Plays
→ Check pre-open price action to avoid trades influenced by gap-ups/gap-downs.
Breakout Entry Only
→ Enter trades only if price breaks previous day’s High (for bullish trades) or Low (for bearish trades).
Watch Volume for Confirmation
→ Monitor volume closely. No volume = No trade.
Enter on Strong Candle + Volume
→ Execute the trade only if a strong candle appears with increasing volume in the direction of the trade.
Defined Risk:Reward Only
→ Take trades only if R:R is favourable (ideally ≥ 1:2)(safe = 1:1).
Premium Disclaimer
→ Option premiums shown are based on EOD prices — real-time premiums may vary during execution.
Time Frame Preference
→ Trade with your preferred time frame — this strategy works across intraday or positional setups.
________________________________________________________________________________
⚠ Disclaimer (Please Read):
• These Trades are shared for educational purposes only and is not investment advice.
• I am not a SEBI-registered advisor.
• The information provided here is based on personal market observation.
• No buy/sell recommendations are being made.
• Please do your own research or consult a registered financial advisor before making any trading decisions.
• Trading involves risk. Always use proper risk management.
I am not responsible for trading decisions based on this post.
________________________________________________________________________________
Option Trading✅ What is an Option?
An Option is a financial contract between a buyer and seller based on an underlying asset (stock, index, commodity).
Call Option = You have the right to Buy.
Put Option = You have the right to Sell.
You pay a premium to buy this right. You are not obligated, but you have the option to buy/sell.
✅ Example (Simple):
You buy a Call Option on Reliance at ₹2500 strike price, paying ₹50 premium.
If Reliance goes to ₹2600, you profit (your option value increases).
If Reliance stays below ₹2500, you lose only ₹50 (the premium)
Types of Options
Call Option – Profit when the market goes up.
Put Option – Profit when the market goes down.
ITM (In the Money) – Strike price already profitable.
ATM (At the Money) – Strike price close to current market price.
OTM (Out of the Money) – Strike price away from market price
✅ Advantages of Option Trading
✅ Less Capital Needed
✅ Limited Risk (when buying)
✅ High Profit Potential
✅ Profit in All Market Types (up, down, sideways)
✅ Risks in Option Trading
❗ Premium can expire worthless (buyer loses money)
❗ Selling options carries unlimited risk (if done without strategy)
❗ Time Decay – value of options reduces as expiry nears
✅ Option Trading is Best for:
✅ Traders with small capital
✅ Stock market learners
✅ Part-time traders
✅ People who want to hedge portfolios
✅ Final Summary:
Option Trading is a smart way to participate in the market using strategies, risk control, and leverage. Start with Call and Put basics, then learn strategies like covered calls, spreads, and hedging to master the gam

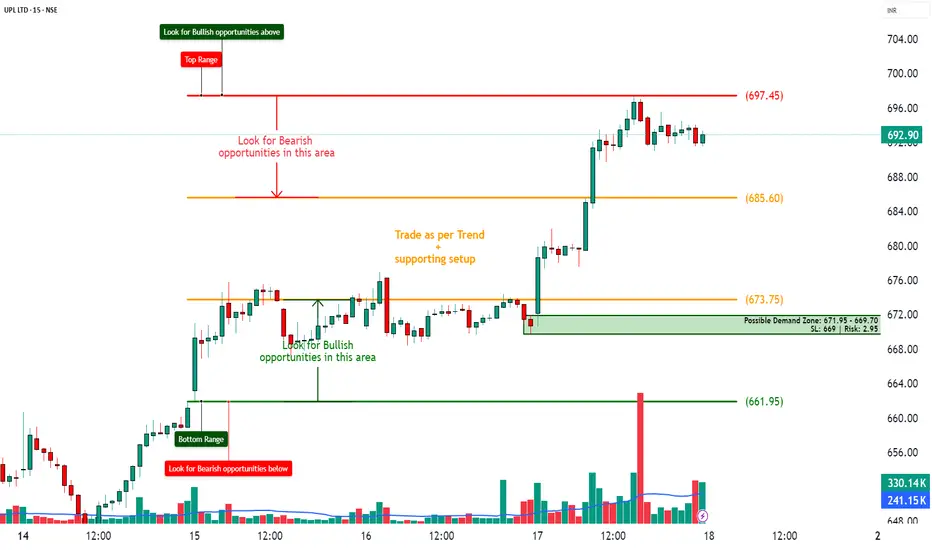
UPL – Demand Zone Based Trade Setup________________________________________________________________________________📈 UPL – Demand Zone Based Trade Setup
🕒 Chart Type: 15-Min | 🗓 Date: 17th July 2025
🔍 Simple and Structured Setup for New Traders
________________________________________________________________________________
🚦 Key Zones to Watch
🔴 Top Range (Resistance) – 697.45
🟠 Mid-Level Zones – 685.60 | 673.75
🟢 Bottom Range (Support) – 661.95
📦 Possible Demand Zone – 671.95 to 669.70 (SL: 669 | Risk: 2.95)
________________________________________________________________________________
💡 What’s Happening on the Chart?
✅ Strong price rally from the demand area 📈
✅ Price is now consolidating just below major resistance (697.45)
✅ Volume spikes indicate strong participation
✅ Market respecting zones cleanly — ideal for zone learners 📚
________________________________________________________________________________
🎯 How to Plan Trades (For Educational Use Only):
🔼 Best Buy Setup:
• Entry: Near 671.95–669.70 (Demand Zone)
• Stoploss: 669
• Target: 685 / 697
• Why: Tested demand zone + strong uptrend + low-risk trade
🔽 Best Sell Setup:
• Entry: Near 697.45 (Resistance Zone)
• Stoploss: 699
• Target: 685.60 / 673.75
• Why: Top zone tested + price may reverse with exhaustion
________________________________________________________________________________
🧠 Learning Points for New Traders:
• ✅ Always trade with trend until you hit opposite zone
• 🧱 Focus on buying near support and selling near resistance
• 📊 Use volume and structure for entry confirmation
• 🧠 Risk should always be smaller than reward
________________________________________________________________________________
📦 Zone Summary for Quick Reference:
• 🔴 Resistance Zone: 697.45
• 🟢 Demand Zone: 671.95 – 669.70 (Risk only ₹2.95!)
⚠ Disclaimer (Please Read):
• These Trades are shared for educational purposes only and is not investment advice.
• I am not a SEBI-registered advisor.
• The information provided here is based on personal market observation.
• No buy/sell recommendations are being made.
• Please do your own research or consult a registered financial advisor before making any trading decisions.
• Trading involves risk. Always use proper risk management.
I am not responsible for trading decisions based on this post.
________________________________________________________________________________
💬 Found this helpful?
Drop your thoughts or questions in the comments below ⬇️
🔁 Share this post with your trading community – let them benefit from clean charts, structured setups, and zone-based learning.
✅ Follow simpletradewithpatience for charts, clean setups, and educational content based on price action, zones, and risk-managed trades.
🚀 Trade with patience, trust your charts, and stay clear-headed!
Be Self-Reliant | Trade with Patience | Learn with Charts & Zones 📊
________________________________________________________________________________