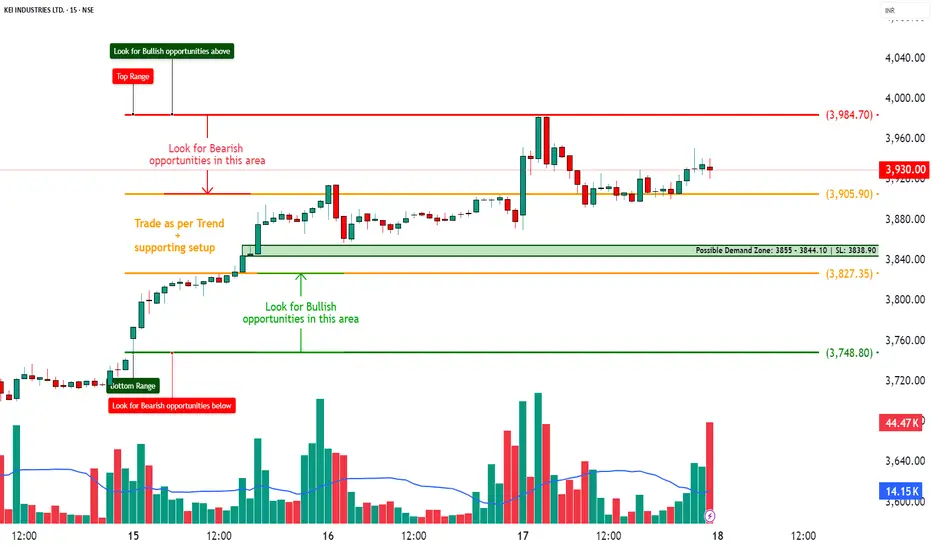
KEI – Bullish Continuation Setup with Breakout Potential________________________________________________________________________________
🚀 KEI – Bullish Continuation Setup with Breakout Potential
📅 Setup Date: 18.07.2025 | ⏱ Timeframe: Daily
📍 Strategy: Defined-Risk Bullish Spread (Short-Term Swing with OI Confirmation)
________________________________________________________________________________
🔍 Overview
Overall Bias: Bullish with supportive Put buildup
Spot Price: ₹3933.3
Trend: Sustained uptrend with OI buildup on CE/PE sides
Volatility (IV): 40–42%, stable with light compression
Ideal Strategy Mix: Defined-risk bullish strategy like vertical call spread
________________________________________________________________________________
1️⃣ Bullish Trade (Naked options as per trend)
Best CE: Buy 3900 CE @ ₹145.05
Why:
• Highest OI among CEs (7.05L) with strong Long Buildup
• Good volume and premium correction (▼16.32%) = cheaper entry
• Spot just above strike → early breakout zone
• Stable IV (40.34) gives clean delta tracking
________________________________________________________________________________
2️⃣ Bearish Trade (Naked options as per trend)
Best PE: Sell 3850 PE @ ₹82.65
Why:
• Long Buildup (OI ↑10.3%) on PE shows bullish support
• Strike sits just below spot → safety buffer
• IV stable and theta erosion beneficial
• Rich premium for selling with bullish bias intact
________________________________________________________________________________
⚙️ 3️⃣ Strategy Trade (As per trend + OI data)
Strategy: Bull Call Spread → Buy 3900 CE / Sell 4100 CE
Net Debit: ₹145.05 - ₹62.35 = ₹82.70
Max Profit: ₹200 - ₹82.70 = ₹117.30
Max Loss: ₹82.70
Risk:Reward ≈ 1 : 1.42 ✅ Within range
Lot Size: 175
Total Risk: ₹14,472.50
Max Profit: ₹20,527.50
Breakeven Point: ₹3982.70
Reversal Exit Level: Exit if Spot < ₹3879.32 (bullish spread invalidation below support)
________________________________________________________________________________
Why:
• Strong Long Buildup on 3900 CE and 4100 PE creates clean structure
• Risk:Reward = 1:1.42 fits strategy filters
• IV cooling supports call spread entry
• Breakout continuation likely with defined risk
________________________________________________________________________________
📘 My Trading Setup Rules
Avoid Gap Plays
→ Check pre-open price action to avoid trades influenced by gap-ups/gap-downs.
Breakout Entry Only
→ Enter trades only if price breaks previous day’s High (for bullish trades) or Low (for bearish trades).
Watch Volume for Confirmation
→ Monitor volume closely. No volume = No trade.
Enter on Strong Candle + Volume
→ Execute the trade only if a strong candle appears with increasing volume in the direction of the trade.
Defined Risk:Reward Only
→ Take trades only if R:R is favorable (ideally ≥ 1:2).(Safe R:R – 1:1)
Premium Disclaimer
→ Option premiums shown are based on EOD prices — real-time premiums may vary during execution.
Time Frame Preference
→ Trade with your preferred time frame — this strategy works across intraday or positional setups.
________________________________________________________________________________
⚠ Disclaimer (Please Read):
• These Trades are shared for educational purposes only and is not investment advice.
• I am not a SEBI-registered advisor.
• The information provided here is based on personal market observation.
• No buy/sell recommendations are being made.
• Please do your own research or consult a registered financial advisor before making any trading decisions.
• Trading involves risk. Always use proper risk management.
I am not responsible for trading decisions based on this post.
________________________________________________________________________________
💬 Found this helpful?
Drop your thoughts or questions in the comments below ⬇️
🔁 Share this post with your trading community – let them benefit from clean charts, structured setups, and zone-based learning.
✅ Follow simpletradewithpatience for charts, clean setups, and educational content based on price action, zones, and risk-managed trades.
🚀 Trade with patience, trust your charts, and stay clear-headed!
Be Self-Reliant | Trade with Patience | Learn with Charts & Zones 📊________________________________________________________________________________
Optionstrading
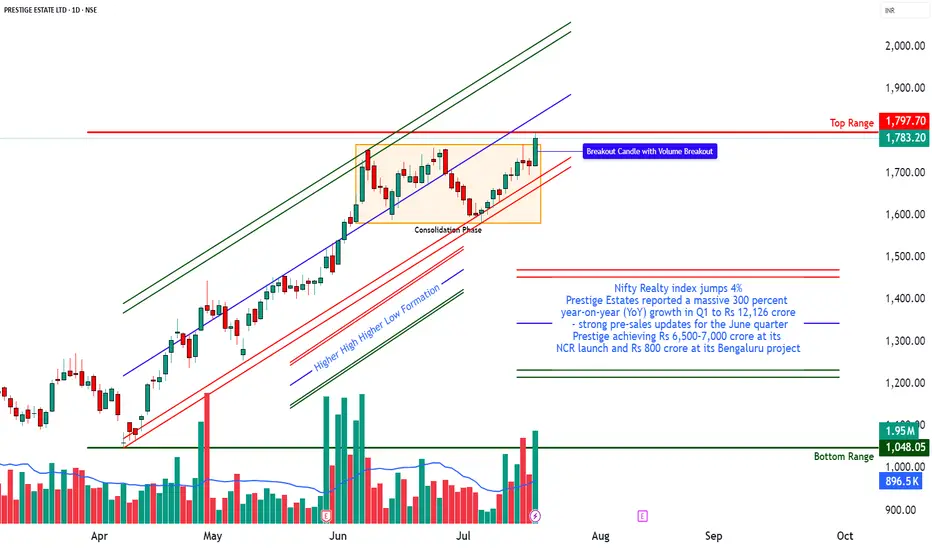
PRESTIGE – Bullish Continuation with Aggressive Call Build-Up________________________________________________________________________________📈 PRESTIGE – Bullish Continuation with Aggressive Call Build-Up
📅 Setup Date: 18.07.2025 | ⏱ Timeframe: Daily
📍 Strategy: Options Trade Setup
________________________________________________________________________________
Overall Bias: Bullish
Spot Price: ₹1,783.2
Trend: Uptrend resumption with aggressive Call OI build-up
Volatility: IV slightly falling in puts, rising in calls → good for defined risk bullish setups
Ideal Strategy Mix: Bullish with defined reward → Bull Call Spread or Naked CE
________________________________________________________________________________
1. 🔼 Bullish Trade (Naked options as per trend)
Best CE: Buy 1800 CE @ ₹49.10
Why:
• Strong Long Build Up with OI up 225%
• Massive volume (1.78L contracts) and ₹33.2 Cr TTV → clear interest
• Decent delta (approx. 0.5–0.55) → good sensitivity to price movement
• Strike closest to spot + high liquidity = ideal for directional trade
________________________________________________________________________________
2. 🔽 Bearish Trade (Naked options as per trend)
Best PE: Sell 1740 PE @ ₹28.6
Why:
• Price down 46% with high volume (4.2L) = put writing
• OI dropped 6.94% → likely unwinding from short bias
• Deep OTM with stable delta (-0.25 approx)
• Favorable if bullish view sustains and price stays above ₹1,740
________________________________________________________________________________
3. ⚙️ Strategy Trade (As per trend + OI data)
Strategy: Call Debit Spread → Buy 1780 CE + Sell 1820 CE
Net Debit: ₹57.3 - ₹41.1 = ₹16.2
Max Profit: ₹40 (spread) - ₹16.2 = ₹23.8
Max Loss: ₹16.2
Risk:Reward ≈ 1 : 1.47
Lot Size: 450
Total Risk: ₹7,290
Max Profit: ₹10,710
Why:
• 1780 CE shows explosive Long Build Up (OI ↑1031%) → active strike for bulls
• 1820 CE also shows strong Long Build Up (OI ↑1000%) → defined bullish target
• Much better R:R than 1800–1840 while staying aligned with trend
• Defined risk with improved capital efficiency and lower theta burn
________________________________________________________________________________
📘 My Trading Setup Rules
Avoid Gap Plays
→ Check pre-open price action to avoid trades influenced by gap-ups/gap-downs.
Breakout Entry Only
→ Enter trades only if price breaks previous day’s High (for bullish trades) or Low (for bearish trades).
Watch Volume for Confirmation
→ Monitor volume closely. No volume = No trade.
Enter on Strong Candle + Volume
→ Execute the trade only if a strong candle appears with increasing volume in the direction of the trade.
Defined Risk:Reward Only
→ Take trades only if R:R is favorable (ideally ≥ 1:2).(Safe R:R – 1:1)
Premium Disclaimer
→ Option premiums shown are based on EOD prices — real-time premiums may vary during execution.
Time Frame Preference
→ Trade with your preferred time frame — this strategy works across intraday or positional setups.
________________________________________________________________________________
⚠ Disclaimer (Please Read):
• These Trades are shared for educational purposes only and is not investment advice.
• I am not a SEBI-registered advisor.
• The information provided here is based on personal market observation.
• No buy/sell recommendations are being made.
• Please do your own research or consult a registered financial advisor before making any trading decisions.
• Trading involves risk. Always use proper risk management.
I am not responsible for trading decisions based on this post.
________________________________________________________________________________
💬 Found this helpful?
Drop your thoughts or questions in the comments below ⬇️
🔁 Share this post with your trading community – let them benefit from clean charts, structured setups, and zone-based learning.
✅ Follow simpletradewithpatience for charts, clean setups, and educational content based on price action, zones, and risk-managed trades.
🚀 Trade with patience, trust your charts, and stay clear-headed!
Be Self-Reliant | Trade with Patience | Learn with Charts & Zones 📊________________________________________________________________________________
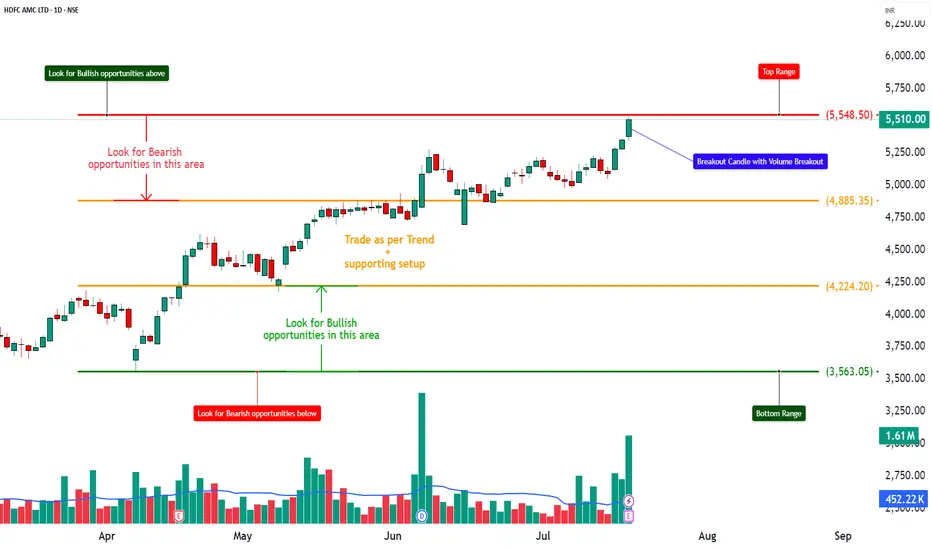
HDFCAMC – Strong Bullish Breakout on High Volume📈 HDFCAMC – Strong Bullish Breakout on High Volume
📅 Setup Date: 18.07.2025 | ⏱ Timeframe: Daily
📍 Strategy: Short-Term HNI Swing Setup
__________________________________________________________________________________
📝 Price Action Summary – HDFCAMC
HDFCAMC has delivered a textbook price action breakout, marked by a wide-range bullish candle on 3x average volume — confirming strong institutional participation. After weeks of tight consolidation and multiple failed attempts near the ₹5,385 resistance zone, the price finally broke out with a clean close near day’s high, indicating minimal selling pressure and clear buyer dominance. The breakout follows a classic compression-before-expansion setup, with the previous range acting as a base for momentum. Importantly, the absence of upper wick, strong follow-through, and volume-backed surge signal genuine strength — not a false breakout. Price has now entered a discovery phase with open space toward ₹5,673–₹5,800. As long as ₹5,385 holds as support, the bulls remain in control, and dip buying remains a high-probability setup. This is a classic case of price action speaking louder than indicators — structure, strength, and story all aligned.
__________________________________________________________________________________Trade Logic – Why This Setup:
Strong Price Structure: The stock has formed a bullish candle backed by a 20-day volume breakout, closing near the highs—indicating strong, sustained demand.
Breakout Confirmation: Price has cleanly broken out from a short-term base formed by multiple candle congestion. It's also trading above the prior resistance level of ₹5,385, confirming breakout strength.
__________________________________________________________________________________ Indicator Confluence: The RSI stands strong at 72, signaling bullish momentum. Additionally, the stock is breaking out of a Bollinger Band squeeze—an early sign of a potential momentum ignition. MACD, CCI, and Stochastic indicators are all aligned in bullish zones across daily, weekly, and monthly timeframes.
EMA Alignment: The stock is trading above all major exponential moving averages (9, 20, 50, 100, and 200 EMA), suggesting healthy trend harmony and support at every timeframe.
VWAP Positioning: Current price action remains well above the daily VWAP, indicating buying interest from institutional players and strong demand zones building underneath.
Volume Spike: Today's volume was 1.61 million, compared to the 10-day average of 452,000—more than a 3x surge, confirming strong buyer conviction and institutional participation.
Open Upside Potential: There are no significant supply zones visible until ₹5,800–₹6,000, offering a clear path for price expansion and swing targets.
Sector Tailwinds: The financial services and AMC sector is witnessing renewed traction after positive earnings and improved fund flow trends, supporting broader strength in related counters.
__________________________________________________________________________________ Would I Enter Now?
YES – Enter Now or on Dip
Reason: Price has just cleared a major volume cluster with strong momentum. Waiting too long might mean missing the breakout. The best approach would be:
• Enter 50% now
• Add 50% near ₹5,495–₹5,485 if there’s an intraday dip
__________________________________________________________________________________ 📈 Resistance Zones
• 🔴 R1: 5,591.5 (possibly weak)
• 🔴 R2: 5,673
• 🔴 R3: 5,797
📉 Support Zones
• 🟢 S1: 5,385
• 🟢 S2: 5,261
• 🟢 S3: 5,179
__________________________________________________________________________________ Direction: Buy (Bullish Bias)
Entry Price: ₹5,510 (Current Market Price)
Alternate Entry: On slight dips to ₹5,485–₹5,495 (ideal risk-managed zone)
Stop Loss: ₹5,385
Reason: This is Support 1 and a key VWAP-based level from the recent volume structure. A breach here invalidates the bullish strength.
Risk–Reward Ratio: 1:1 | 1:2 | +
__________________________________________________________________________________ Overall Bias: Bullish
Spot Price: ₹5,510
Trend: Strong upward momentum
Volatility: Slightly cooling IV (esp. in puts), but still elevated → good for defined-risk strategies
Ideal Strategy Mix: Naked CE or Call Debit Spread (defined-risk bullish strategy)
1. 🔼 Bullish Trade (Naked options as per trend)
Best CE: Buy 5400 CE @ ₹197.95
Why: Strong long buildup with rising OI, high volume, and solid delta — indicating institutional interest and momentum-backed directional strength.
__________________________________________________________________________________ 2. 🔽 Bearish Trade (Naked options as per trend)
Best PE: Sell 5200 PE @ ₹26.5
Why: Strong put writing seen with rising OI and price drop, suggesting low downside risk and income potential if bullish trend holds.
__________________________________________________________________________________
3. ⚙️ Strategy Trade (As per trend + OI data)
Strategy: Call Debit Spread → Buy 5400 CE + Sell 5600 CE
Net Debit: ₹197.95 - ₹92.6 = ₹105.35
Max Profit: ₹200 (spread) - ₹105.35 = ₹94.65
Max Loss: ₹105.35
Risk:Reward ≈ 1 : 0.9
Lot Size: 150
Total Risk: ₹15,802.5
Max Profit: ₹14,197.5
Why: This call spread is ideal because both the 5400 CE and 5600 CE are showing strong long build-up, indicating that traders expect the price to move higher. The 5600 CE has a sharp 168% jump in open interest with high volume, suggesting it’s a realistic target zone. By using a spread (buying 5400 CE and selling 5600 CE), we reduce the upfront cost and limit losses while still capturing upside. It also protects against time decay if the stock consolidates before moving up.
__________________________________________________________________________________ ⚠ Disclaimer (Please Read):
• These Trades are shared for educational purposes only and is not investment advice.
• I am not a SEBI-registered advisor.
• The information provided here is based on personal market observation.
• No buy/sell recommendations are being made.
• Please do your own research or consult a registered financial advisor before making any trading decisions.
• Trading involves risk. Always use proper risk management.
STWP is not responsible for trading decisions based on this post.
__________________________________________________________________________________ 💬 Found this helpful?
Drop your thoughts or questions in the comments below ⬇️
🔁 Share this post with your trading community – let them benefit from clean charts, structured setups, and zone-based learning.
✅ Follow simpletradewithpatience for charts, clean setups, and educational content based on price action, zones, and risk-managed trades.
🚀 Trade with patience, trust your charts, and stay clear-headed!
Be Self-Reliant | Trade with Patience | Learn with Charts & Zones 📊
__________________________________________________________________________________
*********************************************************************************************************************
Caution: This is a result based stock
*********************************************************************************************************************
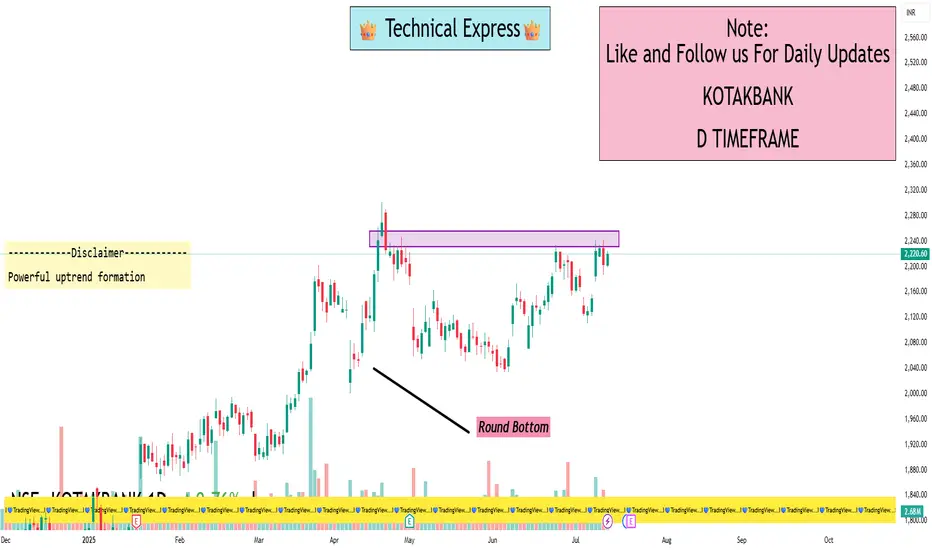
KOTAKBANK 1D TimeframeWhy KOTAKBANK?
Kotak Mahindra Bank is one of India’s most reputed private banks. It’s known for its conservative lending practices, healthy balance sheet, and strong retail plus corporate banking mix. Over the past few quarters, the bank has focused on digital transformation, stable asset quality, and maintaining margins despite rising interest rate pressures. Because of this, it’s always on the radar of long-term investors.
Now in 2025, with the financial sector showing resilience, KotakBank is gaining attention again—especially among those looking to buy on dips or add during consolidation phases.
✅ Current Price Range
As of mid-July 2025, KotakBank is trading near ₹2,185–₹2,190.
On the 1-day chart, it is showing signs of sideways consolidation with support at lower levels and limited upside pressure—this is perfect for long-term accumulation.
🔍 Key Investment Levels (Support & Resistance)
Let’s break it down into zones:
🟩 Support Zones (Ideal Buy Areas)
These are the levels where buyers often enter and prices tend to bounce back.
₹2,160 – ₹2,175
→ This is your first buy zone. It’s a cushion where the price may fall and stabilize before heading back up. Great for small quantity entry.
₹2,140 – ₹2,154
→ A stronger support zone. If the stock dips further, this is where serious long-term buyers often start accumulating. This level has held up multiple times in the past few months.
₹2,125 – ₹2,130
→ This is the last major support level on the daily timeframe. If the price falls below this zone, it might signal short-term weakness, and one should be cautious or wait for stability.
🟥 Resistance Zones (Profit Booking Areas)
These are levels where the stock might face selling pressure, especially short-term traders looking to book profits.
₹2,194 – ₹2,196
→ This is the first resistance area. If you’re already holding from lower levels, consider partial profit booking here.
₹2,209 – ₹2,228
→ A stronger resistance zone. This has acted as a ceiling for the stock recently. If KotakBank closes above this with strong volume, it may break out for fresh highs.
Above ₹2,228
→ If the stock closes above this level on the daily chart, it could start a new rally towards ₹2,260–₹2,300 zone. This level becomes a breakout confirmation point.
🧠 How to Use These Levels (Simple Plan)
🟢 If You’re a Long-Term Investor:
Start buying small quantities if KotakBank dips to ₹2,160–₹2,175.
Add more at ₹2,140–₹2,154 only if market sentiment remains stable.
Stop-loss: If price goes below ₹2,125 and stays there, pause further buying. It may need time to consolidate.
🔵 If You Already Hold the Stock:
Watch for price to approach ₹2,194–₹2,228.
Book partial profits if you’re short-term focused.
If it breaks above ₹2,228, consider holding more or adding for the breakout rally.
Keep trailing your stop-loss upward as the price moves.
📈 Price Behavior (Technical Summary)
Trend: Currently neutral to slightly bullish.
Volume: Not too aggressive, but steady—shows strong hands are holding.
Momentum: RSI (Relative Strength Index) near 50–55 zone on daily timeframe; neither overbought nor oversold.
Volatility: Controlled; perfect for accumulation, not short-term speculation.
📝 Final Thoughts – Human Summary
KotakBank is not in a breakout mode right now, but it’s forming a base.
If you’re a long-term investor, this is the kind of setup you wait for: clear supports, low volatility, and no hype.
The ₹2,140–₹2,175 area is your opportunity zone.
Just make sure to manage your risk below ₹2,125 and don’t go all-in at once. Gradual accumulation works best in these setups.
If it breaks ₹2,228, get ready for action. That’s your green signal for the next rally

BANKNIFTY 1D TimeframeCurrent Context
The index is trading near 56,900 – 57,000. Overbought signals have appeared but the overall trend remains bullish to neutral
🔄 Classic Pivot Points for Bank Nifty (Today)
Level Value Description
R1 57,323.5 First resistance—sell/reduce on strength
Pivot 57,180.7 Central bias: above = bullish, below = cautious
S1 57,070.75 First support—gentle dip-buy zone
S2 56,927.95 Deeper support—stronger buy zone
S3 56,818 Last buffer before bearish risk increases
🛡️ Support Zones (Where Buyers Typically Step In)
₹57,070 – ₹57,080 (S1): Good for light entries on dips
₹56,930 – ₹56,940 (S2): Solid zone to add more
₹56,818 (S3): Final defense—watch carefully for breakdown risk
🚧 Resistance Levels (Where Profit Booking May Kick In)
₹57,323 (R1): Near-term ceiling—consider booking profit
Above ₹57,323 with follow-through: Momentum may push toward R2 (~57,600–57,700)
🎯 Simple Strategy Guide
✅ If You’re Holding:
Stay invested while above 57,070.
Consider trimming near 57,320–57,400, especially if signs of overbought persist.
🟢 Looking to Buy the Dip?
Start buying at dips to 57,070–57,080 (S1).
Add more near 56,930–56,940 (S2) if momentum stays healthy.
🔵 Breakout Play:
A clean close above 57,323 with volume could open momentum to 57,600–57,700.
You can add post-breakout with confidence.
🛑 Risk Control:
If Bank Nifty closes below 56,818 (S3), reel in exposure—market direction may turn uncertain.
🧭 Quick Snapshot
Support: 57,070 → 56,930 → 56,818
Resistance: 57,323 → 57,600+ on breakout
Action Zones:
Buy zones: 57,070 / 56,930
Book profits: ~57,323
Add on breakout: above 57,323
🧠 Why Use These Levels?
Pivot-based zones are widely used by traders and algos, acting as natural turning points in daily price action
. Combining them with observed overbought conditions gives you a structured approach: buy smart, book gains, and manage risk effectively.

Technical Class📘 What is Technical Analysis?
Technical analysis is the study of past market data — mainly price and volume — to forecast future price movement. Unlike fundamental analysis (which looks at company financials), technical analysis focuses entirely on what is happening on the chart right now.
It’s based on three core principles:
Price Discounts Everything
Price Moves in Trends
History Repeats Itself
By mastering this, you can trade like a professional — with logic, structure, and discipline.
🔧 What You’ll Learn in the Technical Class
This class covers all the essential tools, techniques, and strategies used by full-time traders and institutions. Key topics include:
🔹 1. Charting Basics
Types of charts: Candlestick, Line, Bar
Timeframes: 1-min to monthly charts
How to set up charts for analysis
🔹 2. Candlestick Patterns
Bullish and bearish candlesticks
Reversal vs. continuation patterns
Psychology behind candlestick formations (e.g., Doji, Engulfing, Hammer)
🔹 3. Support & Resistance
How to identify key price levels
Role of horizontal zones and trendlines
Breakout and retest strategies
🔹 4. Chart Patterns
Double Top & Bottom
Head and Shoulders
Flags, Pennants, Triangles
Price action and pattern recognition techniques
🔹 5. Technical Indicators
Moving Averages (SMA, EMA)
RSI, MACD, Bollinger Bands
Volume Profile, VWAP
When to use and when to avoid indicators
🔹 6. Trend Analysis
Identifying uptrends, downtrends, sideways movement
Using higher timeframes for confirmation
Entry and exit based on trend strength
🔹 7. Volume Analysis
Importance of volume in confirming moves
Volume spikes and trap zones
Institutional activity detection
🧠 Why Technical Analysis Matters
Most professional traders rely heavily on technicals for:
Short-term and intraday trading
Identifying breakout and breakdown zones
Predicting reversals and continuation setups
Aligning with smart money and institutional behavior
It is one of the most practical skillsets you can learn in trading.
🎯 Who Should Join This Class?
Beginners in the stock market
Aspiring intraday/swing traders
Investors who want better timing
Crypto, forex, or index traders
📈 Conclusion: Read the Market Like a Pro
The Technical Class will give you the confidence to read charts, spot opportunities, and manage trades with structure — no more relying on tips or guesswork.
You’ll walk away with real, practical skills that you can apply in any market, any timeframe, any strategy

Options Strategy Breakdown – For Educational Purpose Only________________________________________
📈 Options Strategy Breakdown – For Educational Purpose Only
🧠 Learn to Structure a Bull Call Spread Strategically
________________________________________
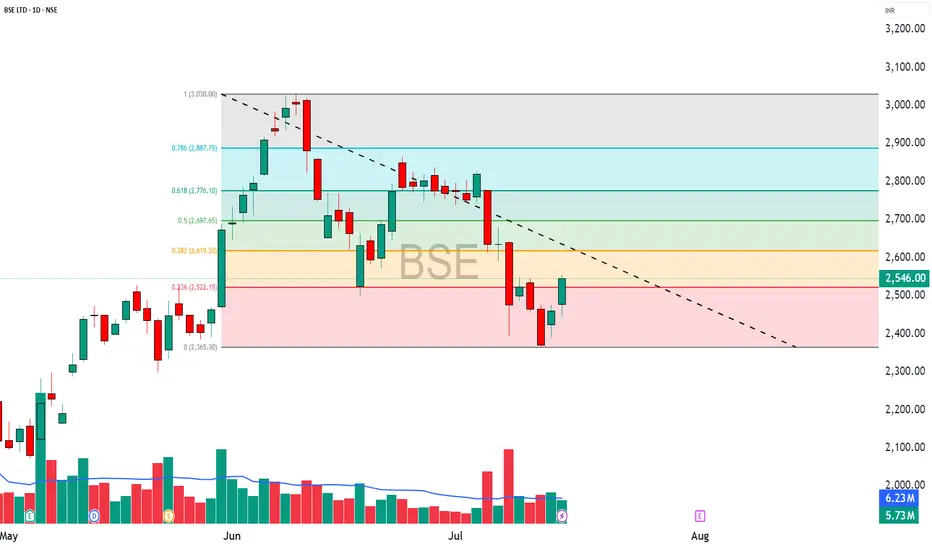
🔹 Stock Name: BSE
🔹 Spot Price: ₹2546
🔹 Lot Size: 375
🔹 Number of Lots: 1
🔹 Expiry Date: 31-July-2025
🕒 DTE (Days to Expiry): 16 Days
💡 Strategy Type: Bull Call Spread – Limited Risk | Limited Reward Option Structure
________________________________________
📘 Strategy Construction (Illustrative Example):
1️⃣ Buy Call Option – Strike: ₹2500 | Premium Paid: ₹125
2️⃣ Sell Call Option – Strike: ₹2600 | Premium Received: ₹76
🧮 Net Premium Outflow: ₹49
(₹125 - ₹76 = ₹49 * 375 = ₹18,375)
________________________________________
📊 Payoff Metrics (Illustrative & Hypothetical):
• 🔹 Breakeven Point: ₹2549.00
• 📈 Maximum Profit: ₹19,125 (When Spot ≥ ₹2600)
• ⚠️ Maximum Loss (Capital Deployed): ₹18,375 (if Spot ≤ ₹2500)
• 🔄 Real-Time PnL: Subject to market movement
• 🎯 Suggested Profit Booking Threshold: ₹18,375 (illustrative target)
• 🛑 Reversal Exit Point (Invalidation): Spot < ₹2487.75 (Support Violation)
________________________________________
📌 Why Learn This Strategy?
The Bull Call Spread is a risk-defined options strategy designed for moderately bullish views. It reduces premium cost compared to naked options and has a clearly capped loss and reward, making it suitable for learning proper risk management in derivatives trading.
________________________________________
🔍 Key Educational Takeaways:
• Helps manage premium exposure in trending markets
• Builds awareness of breakeven levels and invalidation points
• Encourages use of defined-risk structures over naked positions
• Promotes discipline and technical level-based exits
________________________________________
⚠️ Educational Disclaimer:
📢 This post is intended purely for educational and informational purposes only and does not constitute investment advice, recommendation, or solicitation to trade.
I am not a SEBI-registered investment advisor. All data shared above is illustrative and should not be considered as buy/sell advice.
Trading in derivatives involves risk. Please consult a SEBI-registered advisor before taking any financial decisions.
📘 Past performance or setup structure does not guarantee future results.
Always do your own research and use strict risk management.
________________________________________
💬 Want more educational breakdowns like this?
Drop a comment or message!
🔁 Share this with fellow learners to help them build structured option strategies.
✅ Follow @simpletradewithpatience for charts, clean setups, and educational content based on price action, zones, and risk-managed trades.
________________________________________
HEROMOTOCO – Option Chain + Price Action Intraday Setup________________________________________
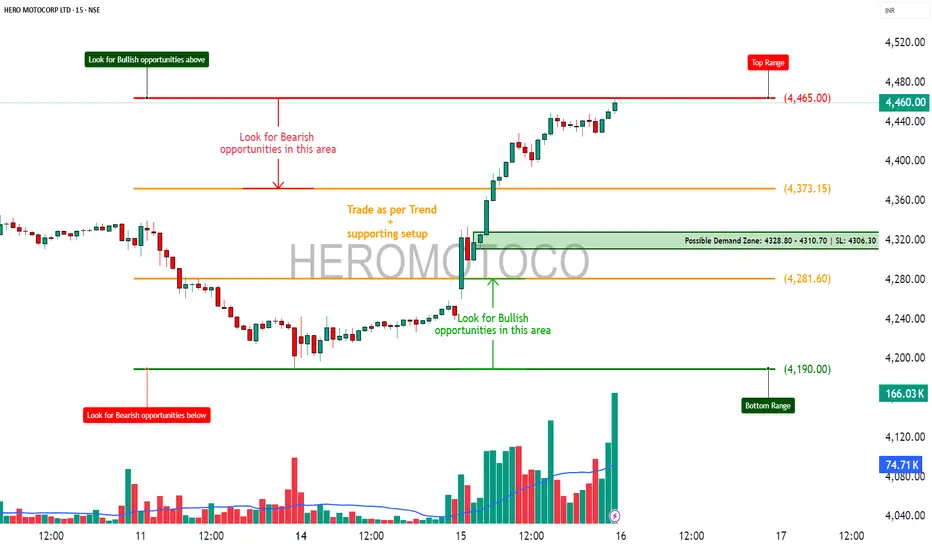
📊 HEROMOTOCO – Option Chain + Price Action Intraday Setup
🕒 Chart Type: 15-Min Timeframe
📅 Date: July 15, 2025
🎯 For Educational Purpose Only
________________________________________
🔍 Chart Observations:
• Clean rally supported by increasing volume.
• Price nearing the Top Range / Resistance at ₹4465.
• A visible Demand Zone formed between ₹4328.80–₹4310.70 with a strong bounce.
• Volume spike confirms strong buying interest near demand levels.
________________________________________
🔢 Option Chain Insights:
🔼 Call Side Activity:
• 4500 CE: Massive Long Build Up — OI +111.76%, premium ₹52.3 → Suggests strength.
• 4450 CE: Also saw strong Long Build Up with rising premium.
• 4400 CE: Witnessed aggressive Short Covering, adding fuel to bullish momentum.
📈 Interpretation: Option writers are unwinding shorts on 4400, and 4500 is seeing heavy buildup — bullish sentiment.
🔽 Put Side Activity:
• 4400 PE: Sharp Short Build Up, IV at 34.5 → Puts being sold aggressively = Bullish bias.
• 4300 PE: Also saw strong Short Build Up, with OI rising despite falling premiums.
📉 Interpretation: Put writers are confident on downside support holding.
________________________________________
✅ Trade Plan Breakdown:
🔼 1. Best Buy – "Buy on Dip to Demand"
• Entry: ₹4328 – ₹4310 (Demand Zone)
• SL: ₹4306
• Risk Reward: 1:1 | 1:2 +
• Logic: Re-entry near demand zone + strong put writing + bullish volume = trend continuation
________________________________________
🔽 2. Best Sell – "Fade the Supply"
• Entry: ₹4460 – ₹4465 (Supply Zone)
• SL: ₹4475
• Risk Reward: 1:1 | 1:2 +
• Logic: Price near resistance with possible exhaustion. CE premiums elevated → good short-risk area
________________________________________
🟢 3. Best CE – "Momentum Play Above ₹4465"
• Strike: 4500 CE
• Trigger: If price breaks above ₹4465 with volume
• Logic: LTP ₹52.3 with Long Build Up, high delta (0.47) → Ready for breakout rally
________________________________________
🔴 4. Best PE – "Rejection Trade Below ₹4430"
• Strike: 4400 PE
• Trigger: If spot breaks below ₹4430
• Logic: LTP ₹95.75, Short Build Up suggests hedge-unwinding or trap possibility on failure
________________________________________
📦 5. Applicable Demand and Supply Zones
• Demand Zone: ₹4328.80 – ₹4310.70 (SL: ₹4306.30)
• Supply Zone: ₹4460 – ₹4465
• Mid-level Zones:
o Watch for support at ₹4373.15
o Breakdown area at ₹4281.60
• Bottom Range Support: ₹4190.00
________________________________________
💬 STWP Summary View:
The sentiment is strongly bullish, backed by long buildup in calls and short buildup in puts. If price breaks above ₹4465, momentum CE trades can fly. But supply pressure could give quick fade setups for scalpers too.
________________________________________
⚠️ Disclaimer (Read Before Trading):
• This setup is shared for educational purposes only.
• No investment advice or trade recommendation is being made.
• Always use proper risk management.
• STWP is not a SEBI-registered advisor.
• Markets involve risk. Trade with a plan, not with emotions.
________________________________________
💬 Found this helpful?
Drop your thoughts or questions below ⬇️
🔁 Share with your trading circle to help them navigate zone-based trades.
✅ Follow @simpletradewithpatience for smart charts, clean setups & demand-supply backed analysis.
📊 Let the price guide you — trade with patience, charts, and clarity!
________________________________________
Banking & Financial Sector Near All-Time High in 2025 What Is the BFSI Sector?
BFSI stands for Banking, Financial Services, and Insurance. It includes:
Private and public sector banks (HDFC Bank, ICICI Bank, SBI, etc.)
NBFCs (Non-Banking Financial Companies) like Bajaj Finance, M&M Finance
Insurance companies like LIC, HDFC Life
Financial service firms like HDFC Ltd (pre-merger), IIFL, and brokers
Together, these companies form the backbone of India’s economy, handling everything from loans, credit cards, mutual funds, and insurance to rural financing and digital banking.
Current Market Position (July 2025)
Bank Nifty is trading above 54,000 – just below its all-time high of around 54,500+
Nifty Financial Services index is also hovering near its peak, led by strong performances from key stocks.
This means:
Banking stocks are leading the overall market rally.
Big money — from FIIs, mutual funds, and even retail — is flowing into BFSI.
Investors believe the sector will outperform in the upcoming quarters.
Why Is the Banking Sector So Strong Right Now?
1. Strong Earnings Growth
Most banks reported record profits in Q1 FY26
Examples:
HDFC Bank and ICICI Bank: Strong credit growth and low NPAs
SBI: Continued momentum in retail and agri-loans
Banks are making more money from both lending and investment services.
2. Improved Asset Quality (Low NPAs)
NPA = Non-Performing Asset (a loan that’s not being repaid)
In 2020–21, NPAs were a huge issue due to COVID.
Now in 2025, NPAs are at multi-year lows.
Better risk management + tech-based collections = fewer defaults.
This has improved investor confidence in banks.
3. Credit Demand Is Booming
India’s economy is growing at 7%+ GDP.
People are borrowing more:
For homes, education, business, and consumption
Corporates are also taking loans for:
Expansion, capex, and mergers
More loans = more interest income = better profits for banks and NBFCs.
4. Digital Banking Explosion
UPI, online lending, digital onboarding = huge cost savings
Banks like Kotak, ICICI, and SBI have aggressively expanded digital operations
NBFCs like Bajaj Finance and Paytm (financial arm) are leveraging tech to reach small towns
This is creating massive scale and reach with low overhead costs.
5. FII & DII Buying in Banking
Foreign Institutional Investors (FIIs) have returned in 2025
They prefer BFSI because it offers:
Liquidity
Consistent profits
Strong management
Domestic funds (DIIs and mutual funds) are also overweight on banking because it remains a core component of India’s growth engine.
Key Stocks Driving the Rally
🏛️ Private Banks
Stock Strength Points
HDFC Bank Post-merger synergy, retail + wholesale growth
ICICI Bank Best-in-class digital, strong balance sheet
Axis Bank Loan growth, improving CASA, strong NIM
Kotak Bank Conservative but profitable, strong capital base
IndusInd Bank Retail comeback, strong rural reach
🏦 Public Sector Banks (PSBs)
Stock Strength Points
SBI India’s biggest bank, strong rural and retail
Bank of Baroda Re-rating play, improved asset quality
Canara Bank PSU momentum + rising profitability
💳 NBFCs & Financial Services
Stock Focus Area
Bajaj Finance Consumer lending, digital
M&M Financial Rural auto + tractor finance
IIFL Finance Gold loan, home loan
🛡️ Insurance & AMC Stocks
Stock Focus
HDFC Life Long-term savings + insurance
SBI Life Market-linked insurance growth
LIC Recovery play post-IPO
Technical Picture: Bank Nifty (as of July 2025)
Resistance: 54,500 (All-time high zone)
Support levels: 53,300 and 52,700
Trend: Bullish (price above 20, 50, 200 EMA)
Volume: Rising, especially in HDFC, Axis, and SBI
Technical traders expect:
A breakout above 54,500 could take Bank Nifty to 56,000–57,000
A rejection might lead to healthy pullbacks before the next leg
What Traders Should Do
Intraday/Options Traders:
Focus on Bank Nifty index options on weekly expiry days (especially Thursdays)
Watch for breakout levels and OI build-up
Popular strategies:
Straddle at key resistance
Bull call spreads after breakout
Momentum scalping on ICICI, Axis, SBI
📆 Swing Traders:
Look for range breakouts on daily/weekly charts
Example: Entry on Axis Bank above ₹1,200 with SL at ₹1,160
Hold for 5–10% swing moves
🧾 What Long-Term Investors Should Do
✅ Continue SIPs in BFSI Mutual Funds
Most mutual funds (like SBI Bluechip, Axis Banking ETF) have high exposure to HDFC, ICICI, SBI, etc.
These are long-term wealth builders.
✅ Buy on Dips
If stocks fall 5–10% due to market-wide correction — it's often a buying opportunity, not panic time
Example: HDFC Bank falling from ₹1,800 to ₹1,650 is often bought by institutions
✅ Diversify within BFSI
Mix large-cap banks, PSU turnaround stories, and NBFCs for better returns with less risk
❌ Risks to Be Aware Of
Even though things look great, no rally comes without risks:
Risk Impact
Global Recession Could reduce FII flow
Rate Hikes (Globally) May reduce credit demand
Political Uncertainty 2026 elections might cause volatility
Asset Quality Shock If any hidden NPAs come up
Overvaluation in Mid NBFCs Some stocks may be overheated
💬 Expert Views
Most brokerage houses like ICICI Direct, Kotak Securities, and Motilal Oswal have bullish ratings on top banks.
They expect 10–15% upside in BFSI stocks over the next 6–12 months.
Morgan Stanley and Goldman Sachs are overweight on India’s banking sector in their Asia portfolio.
✍️ Final Thoughts
The Banking and Financial sector in India is booming for all the right reasons:
Strong economy
Clean books
Digital transformation
Massive credit demand
If you’re a trader — this sector offers great volatility and opportunity.
If you’re a long-term investor — this is where India’s structural growth is most visible.

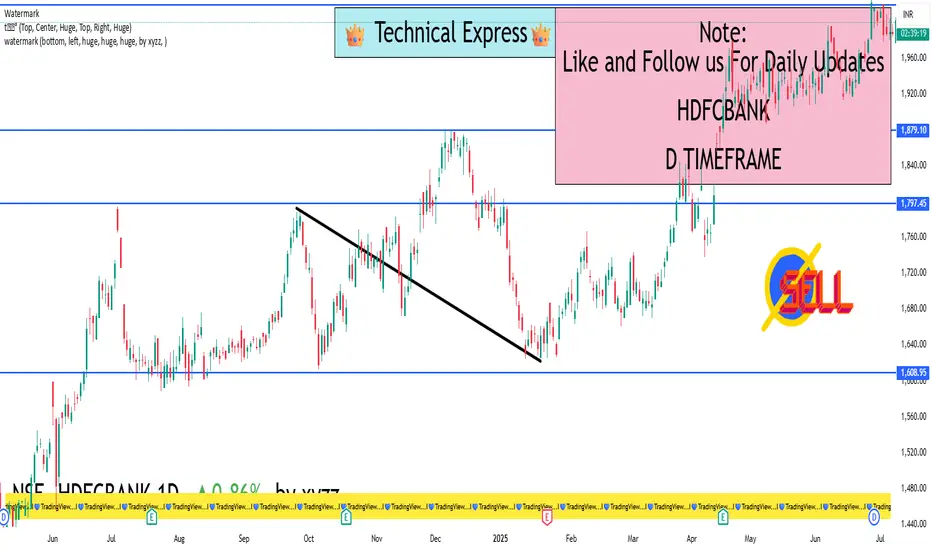
HDFCBANK 1D Timeframe📊 Current Snapshot
Price: Around ₹1,995 (~₹1,990–₹2,000 range)
52-week range: ₹1,588 – ₹2,027 — just below the recent high
✅ Technical Momentum
Overview: Daily technical summary is a "Strong Buy", with moving averages and indicators like RSI (55.3), Stoch, ADX, and CCI all in buy territory
Pivot Level Support: Standard pivots are around ₹1,995
RS Rating (ADR): Strong (83) — above the 80 mark, but extended — suggesting good trend; watch pullbacks
🛡️ Key Price Zones
Support / Buy-on-Dip Areas
₹1,995–₹1,998 – Daily pivot zone
₹1,982–₹1,990 – Standard S1 support
₹1,960–₹1,970 – Deeper Fibonacci/S2 pivot zone
₹1,932–₹1,940 – Strong long-term support (S3–S4 levels)
Resistance / Profit Exit Zones
₹2,007–₹2,015 – Immediate upside pivot resistance (R1–R2)
₹2,024–₹2,025 – R2 zone
₹2,030+ – R3/R4 zone — breakout territory
🧭 Action Plan
1. Currently Holding?
Stay invested — indicators are still bullish.
Think about taking partial profits in the ₹2,015–₹2,025 range, especially if the market overall gets choppy.
2. Planning to Buy?
Best entry: around ₹1,982–₹1,990 (safe zone).
If broader markets dip more, ideal accumulation range is ₹1,960–₹1,970.
Aggressive buying can start near ₹1,995 but keep stop-loss close.
3. Breakout Strategy
A clean, daily close above ₹2,025–₹2,030 on good volume opens up fresh upside toward all-time highs (~₹2,027+).
Can add more after breakout with confidence.
4. Risk Management
Entry around ₹1,982–₹1,990 → set stop-loss below ₹1,960.
If buying near ₹1,960–₹1,970 → stop-loss could be ₹1,930.
SENSEX 1D Timeframe📊 Current Snapshot (As of July 15, 2025)
Recent Close: ~₹82,250
Downside Trend: Sensex has fallen ~1,459 points over the past four trading days, dragging along Nifty—mainly driven by global trade fears, foreign fund outflows, and weakness in IT stocks
Chart Context: The index is approaching its key support area, making now a crucial moment for decision-making
🛡️ Key Support Levels (Buy-on-Dips Zones)
₹82,000 – ₹82,100
A recent intraday low and a likely pivot for the index.
Buying dips here can be a conservative entry for risk-averse investors.
₹81,200 – ₹81,400
Deeper support zone: acts as a cushion in case of broader market drops.
₹80,000 – ₹80,500
Major psychological and technical floor.
Ideal for strong, long-term buying if global headwinds intensify.
🚧 Resistance Levels (Where Pressure May Build)
₹82,450 – ₹82,500
Immediate resistance zone.
A daily close above here could indicate a relief rally.
₹83,000 – ₹83,100
A significant hurdle.
Clearing this, with volume, could trigger a larger bounce.
₹83,400 – ₹83,500
Heavy resistance.
Crossing this opens potential moves toward previous highs (~₹84,000+).
✅ What You, the Investor, Should Do
1. Already Holding?
Stay invested. Trend remains broadly positive unless Sensex closes below ₹81,200.
Consider partial profit-taking near ₹83,000–₹83,100 if you're risk-conscious.
2. Thinking of Buying?
Best zone: ₹82,000–₹82,100 — go slow and buy in tranches.
If deeper pullback: accumulate more near ₹81,200–₹81,400.
3. Playing a Bounce?
If Sensex closes firmly above ₹82,500, that’s a sign of relief.
You could add exposure aiming for ₹83,000+, with a stop-loss below ₹82,000.
4. Protecting Your Position
Stop-loss: consider exiting if Sensex closes below ₹81,200, which would suggest deeper weakness.
🧭 Your Daily ABCs for Sensex
A (Add): Buy near ₹82k and ₹81.2k – ₹81.4k
B (Breakout): Watch for close above ₹82.5k → opens path to ₹83k
C (Cut-loss): Exit below ₹81.2k to avoid deeper downside

KOTAKBANKKotak Bank has been weak for a while but now it's trying to form a bottom. The stock is not yet in a strong uptrend, but it's showing early signs of a possible recovery.
Good Price to Invest
If you're looking to invest, a good range to start buying is around:
Here are the current daily price levels for Kotak Mahindra Bank (KOTAKBANK) on NSE:
Last traded price: ₹ 2,220.60, up
Today's range: ₹ 2,198.60 – ₹ 2,225.00
52‑week range: ₹ 1,679.05 – ₹ 2,301.90
Intraday Pivot Levels (Approximate)
According to Equity Pandit, today's pivot-based support and resistance likely fall at:
Immediate Supports:
• S1 ≈ ₹ 2,204
• S2 ≈ ₹ 2,188
• S3 ≈ ₹ 2,178
Resistances:
• R1 ≈ ₹ 2,231
• R2 ≈ ₹ 2,241
• R3 ≈ ₹ 2,257
Drilling deeper, a key intraday level is ₹ 2,184:
If the stock closes below ₹ 2,184, the short-term trend could weaken—potential signal to lighten downside risk.
As long as it stays above ₹ 2,184, the positive momentum may hold.
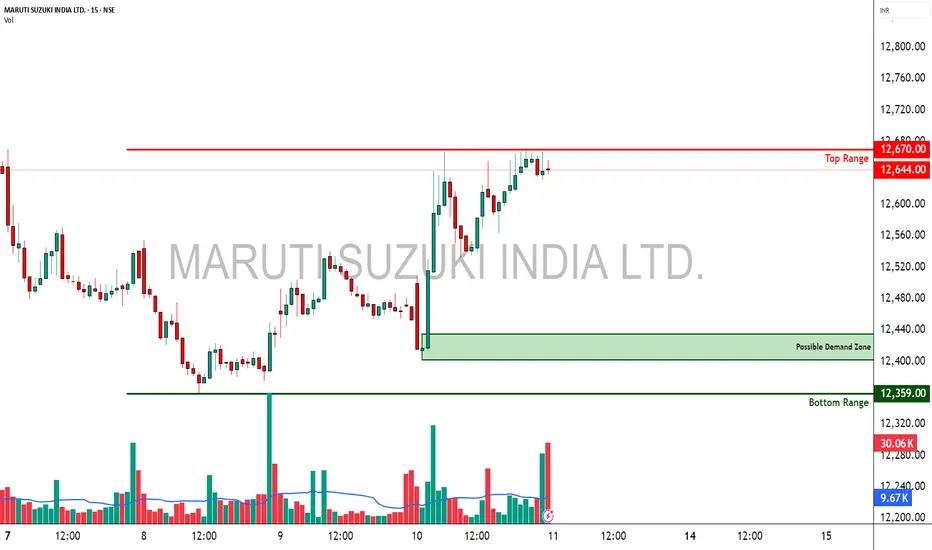
Maruti - Strong Option Chain Signals for Potential Trade Setups________________________________________________________________________________
MARUTI
Bias: Bullish Bias
Strong Long Build-Up across Call strikes (12700–13500)
Simultaneous Short Build-Up on Puts — classic bullish confirmation
________________________________________________________________________________
Best CE:
Strike: 12800
LTP: ₹138.3
OI: 5,14,100 (+78,350 | +17.98%)
Volume: 17,570
Build-Up: Long Build-Up
Interpretation: High OI addition + price rise = active bullish bets at 12800
________________________________________________________________________________
Best PE:
Strike: 12600
LTP: ₹159
OI: 1,05,700 (+76,600 | +263.23%)
Volume: 10,114
Build-Up: Short Build-Up
Interpretation: Strong put writing at 12600 suggests immediate support here
________________________________________________________________________________
Best Strategy:
Bull Call Spread or Naked Call Buy
(Buy 12800 CE, Sell 13200 or 13500 CE for risk-defined play)
- Directional bullish play
- Room to run till 13200–13500 zone based on fresh CE buildup
- Ideal if Spot sustains above 12600
________________________________________________________________________________
Why:
- Long Build-Up seen from 12700 CE to 13500 CE
- Spot = ₹12650, and 12600 PE has heavy Put writing → firm base
- Call Short Covering seen at 12500, 12600 → unwinding resistance
- IVs are rising on PEs, falling on CEs → supports bullish sentiment
- 12800 CE has highest Long Build-Up + Volume → key upside breakout strike
- Above 12800, next resistance zones visible around 13200–13500 based on CE action
________________________________________________________________________________
⚠️ Disclaimer (Please Read):
• This chart is shared for educational purposes only and is not investment advice.
• I am not a SEBI-registered advisor.
• The information provided here is based on personal market observation.
• No buy/sell recommendations are being made.
• Please do your own research or consult a registered financial advisor before making any trading decisions.
• Trading involves risk. Always use proper risk management.
________________________________________________________________________________
💬 Found this helpful?
Drop your thoughts or questions in the comments below ⬇️
🔁 Share this post with your trading community.
✅ Follow simpletradewithpatience for price-action backed technical setups.
🚀 Let’s trade with patience, logic, and clarity!
Be Self-Reliant | Trade with Patience | Learn with Logic
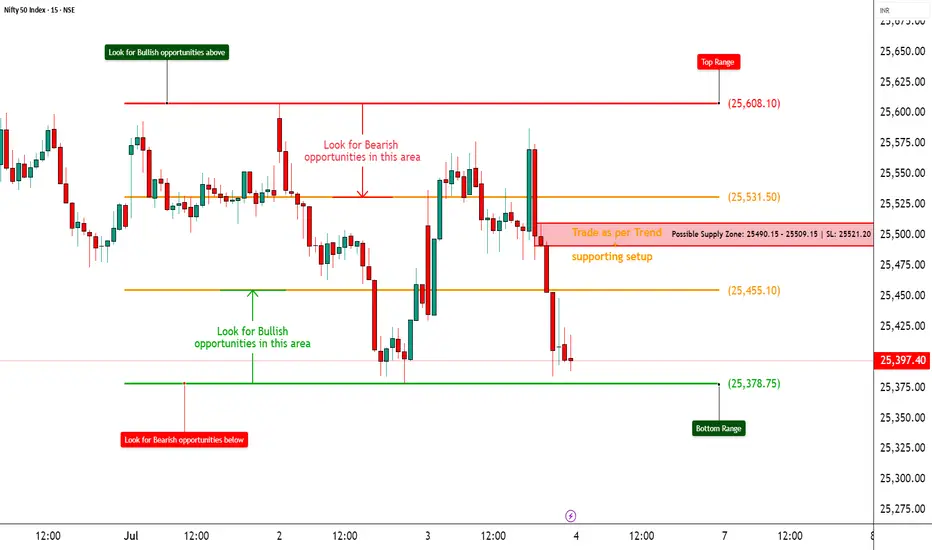
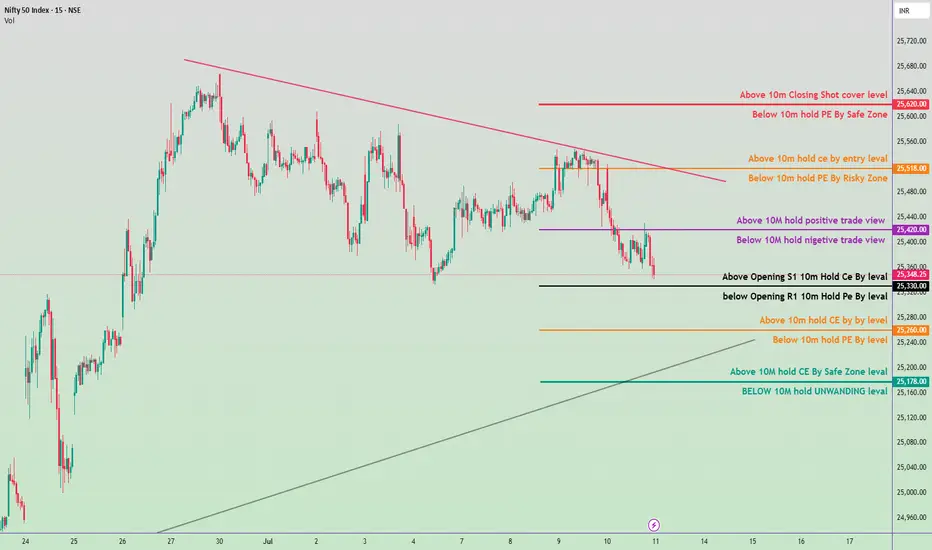
Nifty 50 Intraday Trade Plan 11 july 2025🔴 Resistance & Shorting Zones:
25,620.00
🔹 Above 10m Closing = Short Cover level
🔹 Below 10m = PE by Safe Zone
25,518.00
🔹 Above 10m = Hold CE by Entry level
🔹 Below 10m = PE by Risky Zone
25,420.00
🔹 Above 10m = Hold Positive Trade View
🔹 Below 10m = Negative Trade View
⚖️ Neutral / Opening Zone:
25,348.25 (CMP)
🔸 Above Opening S1 = Hold CE by Level
🔸 Below Opening R1 = Hold PE by Level
🟠 Intermediate Support/Resistance:
25,260.00
🔸 Above 10m = Hold CE by Level
🔸 Below 10m = Hold PE by Level
🟢 Support & Unwinding Zones:
25,178.00
🔹 Above 10m = CE by Safe Zone
🔹 Below 10m = Unwinding Level
📌 Summary:
A move above 25,420 may shift view to bullish/intraday CE hold.
Below 25,260 suggests weakness, possible PE play.
Major support at 25,178, breakdown below this might trigger heavy unwinding.
KOTAKBANK – Strong Call Long Build-Up________________________________________________________________________________
📈 KOTAKBANK – Strong Call Long Build-Up Signals Possible Upside Attempt
🕒 Chart: 15-Min | 📆 July 8, 2025
________________________________________________________________________________
🔍 What’s Catching Our Eye:
Buyers are aggressively building positions in multiple Call strikes from ₹2200 to ₹2320, hinting at bullish sentiment returning.
________________________________________________________________________________📌 What We’re Watching For:
If price sustains above ₹2240–₹2241.5, we may see a move toward ₹2300+ in the short term.
________________________________________________________________________________📌 OI Inference:
Call side is witnessing Long Build-Up (2240–2320, even 2400 CE), while Put side is under Short Build-Up, showing Put sellers are confident the downside is limited.
________________________________________________________________________________🔁 Trend Bias:
🟢 Bullish to Range-Bound – as long as price holds above ₹2200 with rising Call OI and falling PE premiums.
________________________________________________________________________________🧠 Trade Logic / Reasoning:
• Major Call strikes like 2240, 2260, 2300 under Long Build-Up
• 2200 CE shows Short Covering – a sign of prior bearish positions being exited
• Puts are mostly under Short Build-Up = downside cushion building
• Volatility is low = option buyers betting on directional breakout
________________________________________________________________________________📍 Important Levels to Mark:
🔺 Top Range (Resistance): ₹2241.5
🔻 Bottom Range (Support): ₹2111
🟢 Demand Zone: NA
🔴 Supply Zone: NA
________________________________________________________________________________🎯 Trade Plan (Educational Purpose Only):
✅ Buy (Equity): Above ₹2241.5 with strength and follow-through
✅ Sell (Equity): Only below ₹2200 if fresh PE Long Build-Up appears
✅ Best CE to Buy: ₹2240 CE or ₹2260 CE if price sustains above ₹2240
❌ Avoid Put Buying: Most Put options are under Short Build-Up (bearish bets getting closed)
📌 Strategy Idea (Low Risk):
Bull Call Spread – Buy ₹2240 CE, Sell ₹2300 CE
→ Works well if stock rises, and risk stays limited
________________________________________________________________________________⚠️ Invalidation Levels:
🔻 Below ₹2200 = Long view weakens
🔺 Above ₹2241.5 = bullish breakout confirmed
________________________________________________________________________________
⚠️ Disclaimer:
This is only for educational purposes.
STWP is not a SEBI-registered advisor.
Please consult a financial advisor before making trades.
STWP is not responsible for any trading decisions based on this content.
________________________________________________________________________________
💬 Will KOTAKBANK break out above ₹2240 or stay stuck?
⬇️ Share your view in the comments!
🔁 Repost this if you’re tracking the zone
✅ Follow STWP for clean Options + Price Action setups
🚀 Let’s trade with clarity and confidence!
________________________________________________________________________________

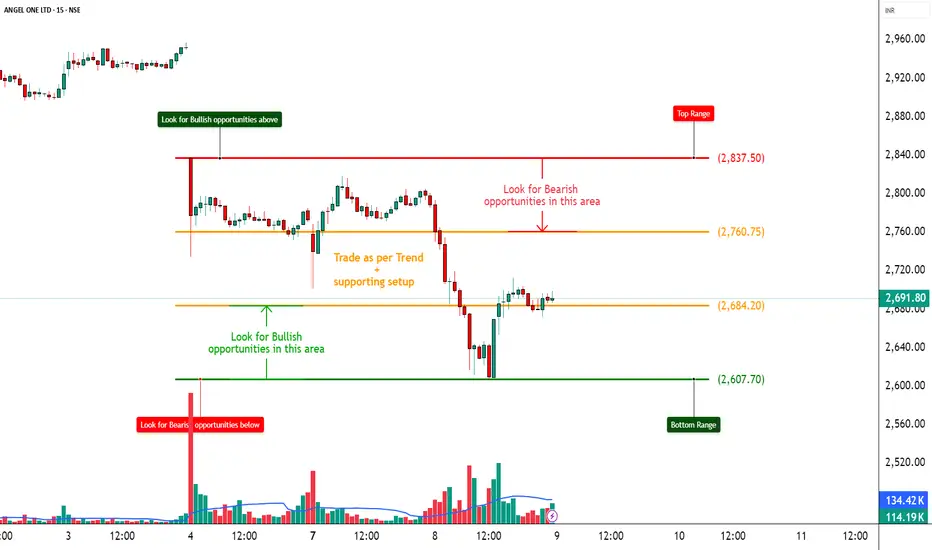
ANGELONE – Heavy CE Writing Signals Bearish Bias________________________________________________________________________________📈 ANGELONE – Heavy CE Writing Signals Bearish Bias Below 2800
🕒 Chart: 15-Min
📆 July 8, 2025
________________________________________________________________________________
🔍 What’s Catching Our Eye:
Call writers aggressively building positions from ₹2700 to ₹3000, capping upside.
________________________________________________________________________________
📌 What We’re Watching For:
If price fails to cross ₹2750–₹2800, there’s a chance it can fall back toward ₹2600 or lower.
________________________________________________________________________________
📌 OI Inference:
CEs are heavily written across the board – from 2700 to 3000 – while PEs are being accumulated.
This is bearish skew with strong support building up around ₹2500–2600.
________________________________________________________________________________
🔁 Trend Bias:
🔴 Bearish to Range-Bound – unless price breaks above ₹2837.5 with volume and Call unwinding
________________________________________________________________________________
🧠 Trade Logic / Reasoning:
• Multiple Call Strikes are under Short Build-Up
• Strong Put writing from 2700 down to 2400 = hedging for downside
• Price is below most of the heavy Call strikes → smart money may be expecting weakness
• Implied Volatility (IV) on PEs rising → indicates fear of volatility spike on downside
________________________________________________________________________________
📍 Important Levels to Mark:
🔺 Top Range (Resistance): ₹2837.5
🔻 Bottom Range (Support): ₹2607.7
🟢 Demand Zone: NA
🔴 Supply Zone: NA
________________________________________________________________________________🎯 Trade Plan (Educational Purpose Only):
✅ Sell (Equity): Near ₹2750–₹2800 if price gets rejected
✅ Buy (Equity): Only above ₹2837.5 with good volume
✅ Best Put to Buy: ₹2700 PE or ₹2600 PE if price starts falling again
❌ Avoid Call Buying: Most Calls are under selling pressure(Look for reversal confirmation)
📌 Strategy Idea (Low Risk):
• Bear Put Spread – Buy 2700 PE, Sell 2600 PE
→ You gain if price falls, but risk is limited
________________________________________________________________________________⚠️ Invalidation Levels:
🔺 If price moves above ₹2837.5, bearish setup may fail
🔻 If price breaks below ₹2607.7, more downside likely
________________________________________________________________________________⚠️ Disclaimer:
This analysis is for educational purposes only.
STWP is not a SEBI-registered advisor.
No buy/sell recommendations are made.
Please consult your financial advisor before trading.
STWP is not responsible for trading decisions based on this post.
________________________________________________________________________________
💬 Will ANGELONE bounce or fall more?
What’s your view on ANGELONE? Comment below ⬇️
🔁 Share this if you're tracking the zone
✅ Follow STWP for clean Price Action + OI Trades
🚀 Let’s trade with clarity and confidence!
________________________________________________________________________________
HDFCBANK – Heavy Call Writing Near 2000 Zone________________________________________
📈 HDFCBANK – Heavy Call Writing Near 2000 Zone | OI + Price Action Analysis
🕒 Chart Type: 15-Minute
📆 Date: July 7, 2025
________________________________________
🔍 What’s Catching Our Eye:
HDFCBANK closed at ₹1987.4, and the entire Call side from ₹1980 to ₹2100 is showing strong Short Build-Up, clearly suggesting resistance building up ahead, especially around ₹2000–₹2040 levels.
Meanwhile, Put side shows Long Unwinding at ₹2000 PE, suggesting lack of bullish confidence at current levels.
________________________________________
📌 What We’re Watching For:
Watch the zone between ₹2004.70 – ₹2007.90 very closely – it’s a visible Supply Zone based on price rejection + heavy CE OI.
If HDFCBANK fails to break and sustain above ₹2009.30 (SL), bears may take control again and drive it back to ₹1980 or below.
________________________________________
📊 Volume Footprint:
Heavy CE volumes hint at active resistance:
• ₹2000 CE – 9.3k+ contracts
• ₹2060 CE – 7.8k+ contracts
• ₹2020 CE & ₹2040 CE – ~5.6k contracts each
→ Strong presence of Call writers near current levels, pressuring the upside.
________________________________________
📈 Option Chain Highlights:
Calls (Short Build-Up):
• ₹2000 CE: +1,93,600 OI | Price ↓ 8.87%
• ₹2060 CE: +10,04,300 OI | Price ↓ 16.67% ✅ Major resistance buildup
• ₹2020 CE: +6,90,800 OI | Price ↓ 11.42%
• ₹2040 CE: +5,83,550 OI | Price ↓ 15.13%
• ₹1980 CE: +2,17,800 OI | Price ↓ 6.44%
• ₹2100 CE: +2,00,200 OI | Price ↓ 17.76%
Puts:
• ₹2000 PE: -84,150 OI | Price ↓ 0.87% → Long Unwinding = Bullish weakness
• ₹1980 PE: +6,050 OI | Price ↓ 2.33% → Weak Short Build-Up
📌 Inference:
Call writers are dominating the entire upper side. There’s no strong Put writing, and PE writers are exiting positions at ATM — this confirms limited bullish conviction.
________________________________________
🔁 Trend Bias:
🔴 Bearish to Range-Bound – unless ₹2009.30 gets taken out on closing basis
________________________________________
🧠 Trade Logic / Reasoning:
• Heavy Short Build-Up in all major CE strikes
• Lack of Put writing near spot
• Supply Zone aligning perfectly with Option Chain resistance
→ Expect rejection or pause unless strong buyers break ₹2009.30 with volume.
________________________________________
📍 Important Levels to Mark:
🔺 Top Range (Resistance): ₹2008
🔻 Bottom Range (Support): ₹1980
________________________________________
🎯 Trade Plan (Educational Purpose Only):
✅ Best Buy (Equity): Above ₹2009.30 with a bullish candle and volume
✅ Best Sell (Equity): Below ₹2004.70 for quick move to ₹1980
✅ Best CE to Long: None – CE side is under Short Build-Up
✅ Best PE to Long: ₹1980 PE if price starts rejecting ₹2000 zone again
🟢 Demand Zone: ₹1965 – ₹1980 (Intraday Bounce Possible)
🔴 Supply Zone: ₹2004.70 – ₹2007.90 (SL: ₹2009.30)
⚠️ Invalidation Levels (With Logic):
🔻 Bullish View Invalid Below: ₹1980 – breaks structure and confirms weakness
🔺 Bearish View Invalid Above: ₹2009.30 – a breakout above this level with volume + PE Short Build-Up will invalidate bearish trades
________________________________________
⚠️ Disclaimer:
This analysis is for educational purposes only.
STWP is not a SEBI-registered advisor.
No buy/sell recommendations are made.
Please consult your financial advisor before trading.
STWP is not responsible for trading decisions based on this post.
________________________________________
💬 Rejection from ₹2000 or breakout above ₹2009?
What’s your view on HDFCBANK? Comment below ⬇️
🔁 Share this if you're tracking the zone
✅ Follow STWP for clean Price Action + OI Trades
🚀 Let’s trade with clarity and confidence!
________________________________________

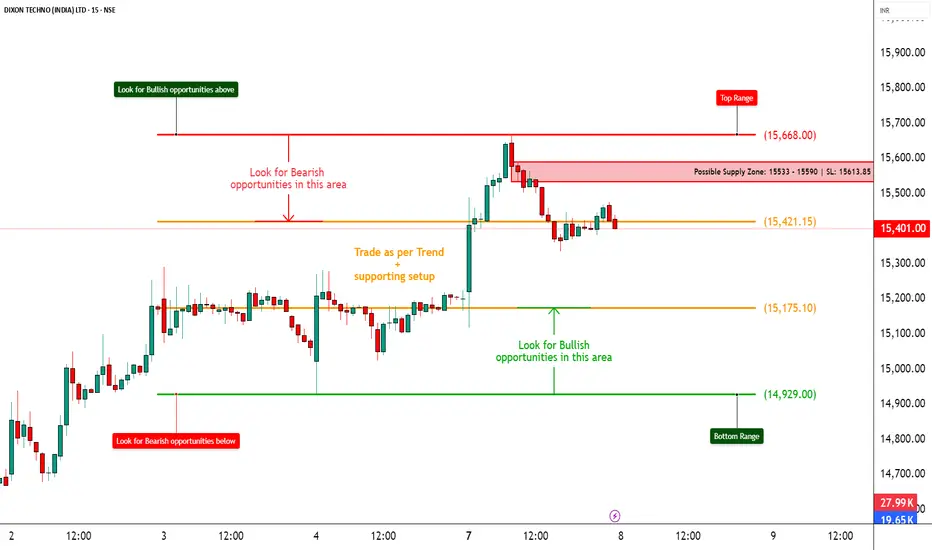
DIXON – Strong Bullish Sentiment with Heavy Long Build-Up in CE________________________________________
📈 DIXON – Strong Bullish Sentiment with Heavy Long Build-Up in Calls | OI + Price Action Analysis
🕒 Chart Type: 15-Minute
📆 Date: July 7, 2025
________________________________________
🔍 What’s Catching Our Eye:
DIXON closed around ₹15,433, and the Option Chain is reflecting dominant bullish momentum. Multiple strikes from 15500 to 18000 CE are seeing strong Long Build-Up, with aggressive participation even in far OTM calls. Simultaneously, Put writers are either unwinding or short building, which shows that traders expect price to rise further and downside is limited.
________________________________________
📌 What We’re Watching For:
If DIXON sustains above ₹15,500, expect continuation toward ₹16,000–₹16,250–₹16,500 and possibly ₹17,000+ if momentum persists. However, any slip below ₹15,250 may slow down the rally.
________________________________________
📊 Volume Footprint:
Options activity is backed by very high bullish volume —
• Over 20.7k contracts at ₹15,500 CE
• Over 18.1k contracts at ₹16,000 CE
• Over 14.5k contracts at ₹16,500 CE
→ Traders are clearly positioning for an upside breakout with strong intent.
________________________________________
📈 Option Chain Highlights:
Calls (Long Build-Up):
• ₹15,500 CE: +16,450 OI | Price ↑ 20.33%
• ₹16,500 CE: +6,650 OI | Price ↑ 21.91%
• ₹17,000 CE: +8,600 OI | Price ↑ 22.40%
• ₹18,000 CE: +11,350 OI | Price ↑ 17.51%
• ₹15,750 CE: +21,900 OI | Price ↑ 21.12%
• ₹16,250 CE: +8,950 OI | Price ↑ 22.07%
• ₹16,750 CE: +6,950 OI | Price ↑ 22.73%
Calls (Short Covering):
• ₹15,000 CE: -20,250 OI | Price ↑ 18%
• ₹15,250 CE: -16,950 OI | Price ↑ 18.58%
• ₹16,000 CE: -10,200 OI | Price ↑ 21.26%
Puts:
• ₹15,000 PE: +1,800 OI | Price ↓ 23.07% → Short Build-Up
• ₹15,500 PE: +15,750 OI | Price ↓ 19.74% → Short Build-Up
• ₹14,000 PE: +13,750 OI | Price ↓ 30.12% → Short Build-Up
• ₹14,500 PE: -2,300 OI | Price ↓ 26.24% → Long Unwinding
🧠 Inference:
Call buyers are aggressively taking positions across the board. Even deep OTM strikes like ₹17,000 & ₹18,000 CE are active. Put writers are backing off or adding shorts. This is a clear momentum breakout setup.
________________________________________
🔁 Trend Bias:
🟢 Bullish – Strong confirmation from both price & derivative action
________________________________________
🧠 Trade Logic / Reasoning:
Massive Long Build-Up from 15,500 to 18,000 CE confirms traders are betting on continued upside. Short covering at ATM strikes + short build-up at far PEs shows bears are backing off and bulls are in full control.
________________________________________
📍 Important Levels to Mark:
🔺 Top Range (Resistance): ₹15668
🔻 Bottom Range (Support): ₹14929
________________________________________
🎯 Trade Plan (Educational Purpose Only):
✅ Best Buy (Equity): Above ₹15,500 with volume confirmation
❌ Best Sell (Equity): Avoid – sentiment is too bullish
✅ Best CE to Long: ₹15,500 CE or ₹16,000 CE – both showing volume + fresh long build-up
❌ Best PE to Long: Avoid – no bearish signs from the Option Chain
🟢 Demand Zone: NA
🔴 Supply Zone: 15533 – 15590 | SL: 15613.85
⚠️ Invalidation Below:
If DIXON closes below ₹15,250 with heavy volume, the bullish momentum stands invalidated, and price may retrace toward ₹15,000–14,750 zones.
If DIXON closes above ₹15,500 with strong bullish candles and volume, any bearish anticipation becomes invalid. Price may then aim for ₹16,000–16,250 or higher.
________________________________________
⚠️ Disclaimer:
This analysis is for educational purposes only.
STWP is not a SEBI-registered advisor.
No buy/sell recommendations are made.
Please consult your financial advisor before trading.
STWP is not responsible for trading decisions based on this post.
________________________________________
💬 Did this help you ride DIXON’s bullish wave?
Let me know your views below ⬇️
🔁 Share this with traders watching DIXON
✅ Follow STWP for clean zone + OI + momentum trades
🚀 Be Self-Reliant | Trade with Patience | Learn with Logic
________________________________________
BSE – Heavy Call Writing Indicates Resistance Ahead________________________________________
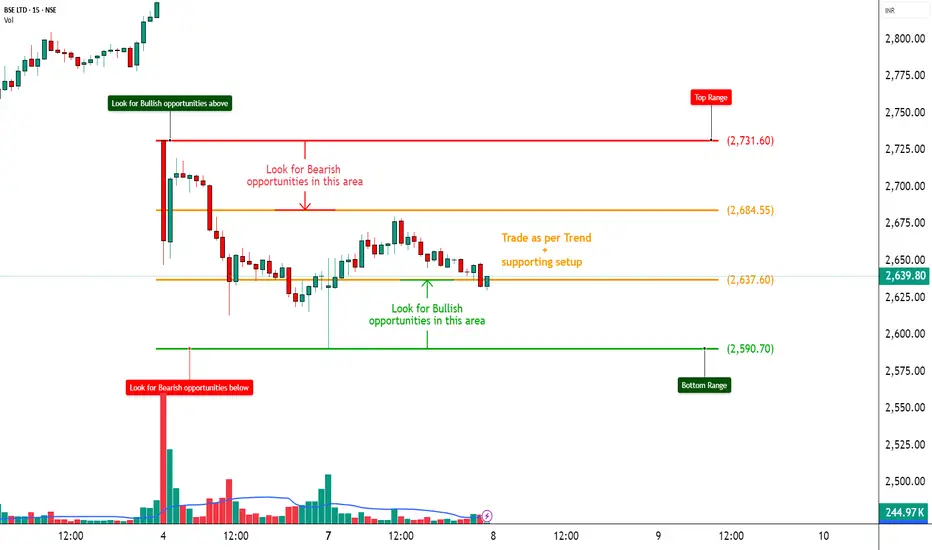
📈 BSE – Heavy Call Writing Indicates Resistance Ahead | OI + Price Action Analysis
🕒 Chart Type: 15-Minute
📆 Date: July 7, 2025
________________________________________
🔍 What’s Catching Our Eye:
BSE is trading near ₹2636, and the Option Chain is showing aggressive Short Build-Up on Calls from 2650 to 3000, clearly highlighting a resistance zone above current price. Meanwhile, Put writers are unwinding, especially at ₹2600 PE, confirming weak bullish conviction. Traders are playing defensively with bearish bias dominating.
________________________________________
📌 What We’re Watching For:
If BSE breaks below ₹2600, we may see a quick slide toward ₹2550–2500. However, a sharp breakout above ₹2700 with strong volume may trigger a round of short-covering. Until then, upside looks capped due to excessive Call writing.
________________________________________
📊 Volume Footprint:
Options activity is backed by strong volume —
• Over 8.9k contracts at ₹2700 CE
• Over 8.1k contracts at ₹2800 CE
• Over 7k contracts at ₹3000 CE
→ Traders are betting on price staying below 2700–2800 levels, creating a strong supply wall.
________________________________________
📈 Option Chain Highlights:
• Calls (Short Build-Up):
o ₹2700 CE: +81,375 OI | Price ↓ 8.82%
o ₹2800 CE: +18,375 OI | Price ↓ 11.07%
o ₹3000 CE: +77,250 OI | Price ↓ 16.60%
o ₹2650 CE: +38,250 OI | Price ↓ 8.01%
• Puts:
o ₹2600 PE: -42,375 OI | Price ↓ 10.94% → Long Unwinding
o ₹2500 PE: +102,375 OI | Price ↓ 16.55% → Short Build-Up
📌 Inference:
Bulls are on the back foot. CE writers are dominating across all key strikes, and only the 2500 PE is showing fresh interest — which is far from spot, indicating potential room for further downside.
________________________________________
🔁 Trend Bias:
🔴 Bearish to Neutral – Unless 2700 breaks cleanly
________________________________________
🧠 Trade Logic / Reasoning:
Every CE strike from ATM to OTM is under short build-up — that's a clear ceiling forming. With no visible strength in Put writing near spot, the path of least resistance appears to be on the downside. Keep a close eye on ₹2600.
________________________________________
📍 Important Levels to Mark:
🔺 Top Range (Resistance): ₹2731.60
🔻 Bottom Range (Support): ₹2590.70
________________________________________
🎯 Trade Plan (Educational Purpose Only):
✅ Best Buy (Equity): Only if BSE crosses ₹2700 with volume
✅ Best Sell (Equity): Below ₹2600 for target ₹2550–2500
✅ Best CE to Long: ❌ None – All major Calls under Short Build-Up
✅ Best PE to Long: ₹2500 PE – Showing fresh bearish positioning
🟢 Demand Zone: NA
🔴 Supply Zone: NA
⚠️ Invalidation Below:
Bullish view invalidated if price sustains below ₹2600
________________________________________
⚠️ Disclaimer:
This analysis is for educational purposes only.
STWP is not a SEBI-registered advisor.
No buy/sell recommendations are made.
Please consult your financial advisor before trading.
STWP is not responsible for trading decisions based on this post.
________________________________________
💬 Spotting the weakness early helps plan smarter.
What’s your view on BSE – comment below ⬇️
🔁 Share this if you're tracking BSE this week
✅ Follow STWP for clean price + OI based setups
🚀 Be Self-Reliant | Trade with Patience | Learn with Logic
________________________________________
MARUTI – Strong Call Long Build-Up Dominance________________________________________
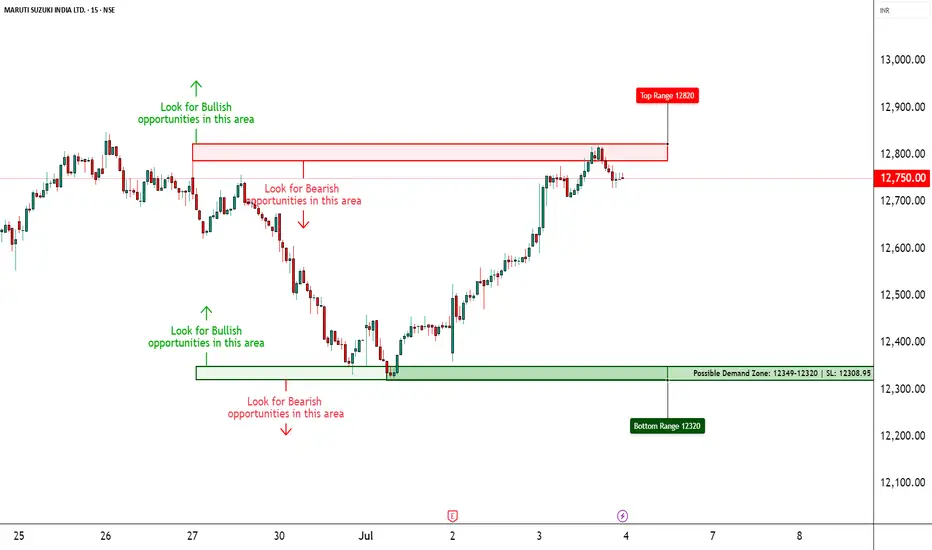
📈 MARUTI – Strong Call Long Build-Up Dominance | OI + Price Action Analysis
🕒 Chart Type: 15-Minute
📆 Date: July 3, 2025
________________________________________
🔍 What’s Catching Our Eye:
MARUTI closed around ₹12,752, and the entire Call side up to 13,500 is showing strong Long Build-Up, indicating aggressive bullish sentiment from option buyers. Meanwhile, the Put side is displaying Short Build-Up, further confirming bullish undertones. The price is steadily climbing, supported by strong institutional participation.
________________________________________
📌 What We’re Watching For:
If MARUTI sustains above ₹12,800, bullish continuation looks likely. Watch for follow-through toward ₹13,000 and 13,200+ if momentum persists. However, a drop below ₹12,500 could temporarily halt this upward bias.
________________________________________
📊 Volume Footprint:
Options activity is backed by strong volume — over 17k+ contracts at ₹13,000 CE and 15k+ at ₹12,800 CE — showing traders are betting big on further upside.
________________________________________
📈 Option Chain Highlights:
The OI data is highly supportive of the bulls:
• Calls (Long Build-Up):
o ₹13,000 CE: +104,450 OI | Price ↑ 8.6%
o ₹12,800 CE: +101,800 OI | Price ↑ 12.04%
o ₹12,900 CE: +95,650 OI | Price ↑ 10.07%
o Even OTM CE like ₹13,500 is active → trend belief is strong
• Puts:
o ₹12,800 PE & ₹12,700 PE both showing Short Build-Up, i.e., buyers believe downside is limited
Inference: Bulls are clearly in control, with both Call buyers active and Put sellers stepping in. This aligns with the broader bullish trend seen in the stock.
________________________________________
🔁 Trend Bias:
🟢 Bullish – Confirmed via price action and derivative sentiment
________________________________________
🧠 Trade Logic / Reasoning:
Strong accumulation is seen at every major Call level, from ATM to slightly OTM strikes. Short covering at ₹12,500 CE and long build-up in higher CE strikes confirms that the bulls are expecting a continuation rally. PE writers are unwinding or adding shorts – classic sign of strength.
________________________________________
📍 Important Levels to Mark:
🔺 Top Range (Resistance): ₹13,200 – ₹13,500
🔻 Bottom Range (Support): ₹12,500
________________________________________
🎯 Trade Plan (Educational Purpose Only):
✅ Best Buy (Equity): Above ₹12,800 with strong bullish candle
✅ Best Sell (Equity): Avoid unless ₹12,500 is broken
✅ Best CE to Long: ₹13,000 CE – Strongest long build-up with momentum
✅ Best PE to Long: Avoid PE long – sentiment doesn’t support bearish bets
🟢 Demand Zone: NA
🔴 Supply Zone: NA
⚠️ Invalidation Below:
Bullish bias is invalidated below ₹12,500 with high volume selling
________________________________________
⚠️ Disclaimer:
This analysis is for educational purposes only.
STWP is not a SEBI-registered advisor.
No buy/sell recommendations are made.
Please consult your financial advisor before trading.
STWP is not responsible for trading decisions based on this post.
________________________________________
💬 Did this help you spot the momentum early?
Drop your views in the comments ⬇️
🔁 Share this with traders watching MARUTI
✅ Follow STWP for clean price + option chain trades
🚀 Let’s educate more traders with patience and clarity!
________________________________________
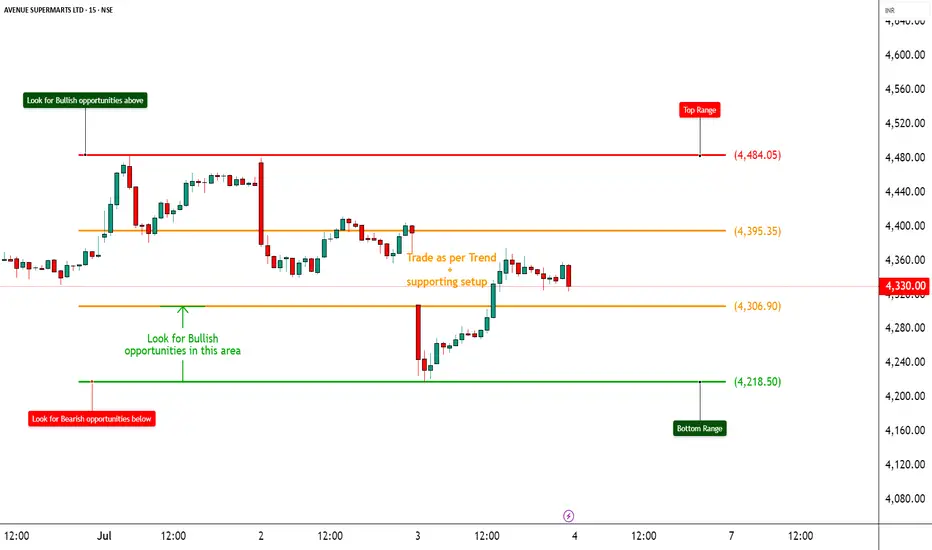
DMART – Mixed Signals with Option Chain Clues________________________________________________________________________________📈 DMART – Mixed Signals with Option Chain Clues | Option Chain + Price Action Analysis
🕒 Chart Type: 15-Minute
📆 Date: July 3, 2025
________________________________________________________________________________
🔍 What’s Catching Our Eye:
DMART is displaying notable volatility near its technical range. While the option chain reveals contrasting setups across strikes—with several Calls showing short build-ups and some Puts indicating long build-ups—the overall price action remains undecided. The current equity price (spot at 4348.70) is being carefully watched in relation to its normalized chart range.
________________________________________________________________________________
📌 What We’re Watching For:
We’re monitoring for a decisive move beyond the established range. A sustained move above the Top Range of 2464.4 (normalized chart level) could validate a bullish reversal; conversely, a breakdown below the Bottom Range of 2326.1 might trigger a bearish slide. Given the option chain dynamics, any clear directional breakout—supported by volume—will be key to shaping our view.
________________________________________________________________________________
📊 Volume Footprint:
Today’s volume is recorded at 1.83M, significantly higher than the previous 836.47k, indicating an active session. A continued high volume reading on a breakout or breakdown from our range will be critical for confirmation.
________________________________________________________________________________
📈 Option Chain Highlights:
• On the Call side, the 4,500 CE and 4,300 CE are showing strong short build-ups, while the 4,400 CE stands out with a long build-up—hinting at an emerging bullish bias if the price rallies. Additionally, the 4,600 CE continues to exhibit short build-up pressure.
• On the Put side, the 4,200 PE displays a strong long build-up, suggesting downside protection, and the 4,000 PE also shows long build-up. A notable short covering is observed in the 4,300 PE and the 4,250 PE shows additional long build-up.
These option-chain cues—combined with the volatility in the underlying—highlight the market’s mixed expectations.
________________________________________________________________________________
🔁 Trend Bias:
The bias remains directionally dependent—bullish if a reversal above the top range is confirmed, or bearish if the price falls below the bottom range.
________________________________________________________________________________
🧠 Trade Logic / Reasoning:
DMART’s price action is teetering near its critical range. The normalized technical levels (Top Range: 2464.4, Bottom Range: 2326.1) serve as key decision zones. On the options side, the presence of long build-up in the 4,400 CE suggests that, if the price reverses, buyers could step in. In contrast, the strong long build-up on the 4,200 PE underlines the protective positions if the price breaks lower. With a higher session volume amplifying the move’s significance, caution is warranted until a clear breakout or breakdown occurs.
________________________________________________________________________________
📍 Important Levels to Mark:
🔺 Top Range: 2464.4 – Look for a breakout or a reversal candlestick pattern with confirmatory volume
🔻 Bottom Range: 2326.1 – Watch for a breakdown or a bullish reversal pattern with volume support
________________________________________________________________________________
🎯 Trade Plan (Educational Purpose Only):
✅ Best Buy (Equity): Enter long on DMART if a robust bullish reversal is confirmed—ideally when the price reclaims above the top range (2464.4) with strong volume and supportive candlestick action.
✅ Best Sell (Equity): Take short positions if the price decisively breaks and holds below the bottom range (2326.1) on high volume.
✅ Best CE to Long: Opt for the 4,400 CE when the reversal is underway; its long build-up in the option chain signals the initiation of bullish interest.
✅ Best PE to Long: In a bearish scenario, consider the 4,200 PE—its long build-up indicates traders are positioning for a downside move.
🟢 Demand Zone: NA
🔴 Supply Zone: NA
⚠️ Invalidation Below:
Any bullish setup becomes invalid if DMART breaks and holds below the bottom range of 2326.1 (normalized level) with strong volume.
________________________________________________________________________________
⚠️ Disclaimer:
This post is for educational purposes only.
STWP is not a SEBI-registered advisor.
This is not a buy/sell recommendation.
Please consult your financial advisor before trading.
STWP is not responsible for any trading outcomes.
________________________________________________________________________________
💬 Found this helpful?
Drop your thoughts in the comments ⬇️
🔁 Share with fellow traders
✅ Follow STWP for zone-based price action & option chain insights
🚀 Let’s boost awareness of smart & patient trading!
________________________________________________________________________________
ASIANPAINT – Strong Bounce from Demand Zone________________________________________________________________________________📈 ASIANPAINT – Strong Bounce from Demand Zone | Option Chain + Price Action Breakdown
🕒 Chart Type: 15-Minute
📆 Date: July 3, 2025
________________________________________________________________________________
🔍 What’s Catching Our Eye:
ASIANPAINT saw a sharp intraday rebound from its marked demand zone at ₹2405–₹2397.50, with price closing near ₹2,430.90. The reversal occurred on higher volume and in the presence of long build-ups across multiple Call strikes. This suggests institutional interest and a potential shift in short-term sentiment.
________________________________________________________________________________
📌 What We’re Watching For:
The key observation is that ASIANPAINT respected its demand zone and bounced with strength. If the price sustains above ₹2,440, it could trigger continuation toward the top range of ₹2,464.40. On the downside, any failure to hold the demand zone may bring back pressure toward ₹2,400. Option chain data supports the bullish bias, with fresh long positions across ATM and OTM calls.
________________________________________________________________________________
📊 Volume Footprint:
Today’s volume was 1.55M, higher than the previous 1.36M, signaling strong participation during the bounce. A continuation move with volume > 1.5M may validate breakout setups.
________________________________________________________________________________
📈 Option Chain Highlights:
The 2,500 CE, 2,460 CE, and 2,440 CE all witnessed strong long build-ups, confirming bullish positioning. Even the deep OTM 2,600 CE showed healthy open interest increase. Meanwhile, 2,400 PE showed short build-up, suggesting put writers are confident that the ₹2,400 level will hold. Notably, 2,400 CE also saw short covering, adding further weight to the bullish narrative.
________________________________________________________________________________
🔁 Trend Bias:
🟢 Bullish above ₹2,440, especially if volume confirms a clean move
________________________________________
🧠 Trade Logic / Reasoning:
The bounce from demand was technical and backed by derivatives activity. The presence of long build-ups across multiple Calls and the short covering at 2400 CE suggests strength. Since price closed above key EMA zones and respected the lower boundary, it builds a solid case for an upward move, unless volume suddenly drops or a fresh supply emerges.
________________________________________________________________________________
📍 Important Levels to Mark:
🔺 Top Range Resistance: ₹2,464.40 – Watch for bullish breakout or reversal candlestick
🔻 Bottom Range Support: ₹2,326.10 – Deeper support; unlikely to come into play unless 2400 breaks
________________________________________________________________________________
🎯 Trade Plan (Educational Purpose Only):
✅ Best Buy (Cash/Futures):
Buy above ₹2,440 with bullish price action and volume confirmation. Reversal from the demand zone is valid as long as price holds above ₹2,405.
✅ Best Sell (Cash/Futures):
Sell only below ₹2,405 if the price breaks the demand zone with high volume and bearish structure. Downside may open toward ₹2,380–₹2,360.
💼 Best CE to Long:
2,440 CE or 2,460 CE – Both strikes show strong Long Build-Up; ideal for directional continuation above ₹2,440.
📉 Best PE to Long:
2,400 PE – Consider only if price breaks and sustains below ₹2,405 with heavy volume and weak candle close. Risk-reward turns favourable for downside hedging.
🟢 Demand Zone: ₹2405.10 – ₹2397.50 | SL: ₹2395.50
🔴 Supply Zone: Not clearly visible yet (watch ₹2464+ for fresh seller emergence)
⚠️ Invalidation Below:
Bullish bias invalid if price closes below ₹2,395 with strong volume and momentum.
________________________________________________________________________________
⚠️ Disclaimer:
This post is for educational purposes only.
STWP is not a SEBI-registered advisor.
This is not a buy/sell recommendation.
Please consult your financial advisor before trading.
STWP is not responsible for any trading outcomes.
________________________________________________________________________________
💬 Found this helpful?
Drop your thoughts in the comments ⬇️
🔁 Share this with fellow traders
✅ Follow STWP for zone-based price action & option chain insights
🚀 Let’s grow awareness for structured & patient trading!
________________________________________________________________________________
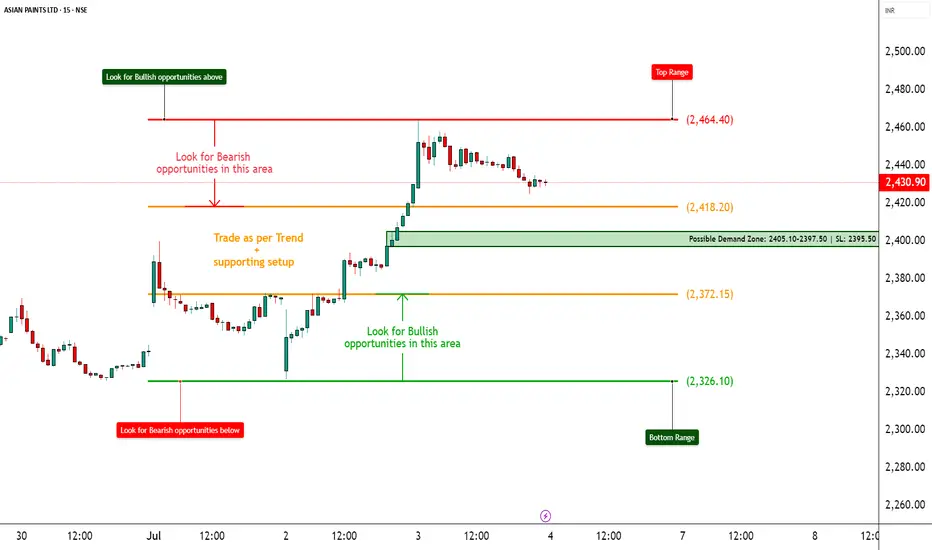
NIFTY – Range-Bound but Bearish Tilt Emerging📈 NIFTY – Range-Bound but Bearish Tilt Emerging | Option Chain + Price Action Analysis
🕒 Chart Type: 15-Minute
📆 Date: July 3, 2025
________________________________________
🔍 What’s Catching Our Eye:
NIFTY closed at ₹25,397.40, hugging the key support zone at ₹25,378. The index remains inside a well-defined range, but the sharp rejection from the ₹25,490–₹25,509 supply zone highlights sustained selling pressure. The failure to reclaim ₹25,455 signals caution from buyers.
________________________________________
📌 What We’re Watching For:
The ₹25,378 level is crucial. A breakdown below it with volume could ignite fast momentum towards ₹25,300–₹25,250. On the other side, a bullish reversal setup is only valid if NIFTY reclaims ₹25,455 with a strong candle and high volume. Option data tilts clearly bearish, showing confidence from institutions—not speculation.
________________________________________
📊 Volume Footprint:
Current volume stands at 293.43M, lower than the previous session’s 330.09M, indicating reduced participation and indecision. Watch for a volume spike below ₹25,378 (for breakdown confirmation) or above ₹25,455 (to validate reversal strength).
________________________________________
📈 Option Chain Highlights:
The 25,500 CE shows heavy short build-up, with OI sharply higher—clear sign of strong resistance. The 25,600 CE adds to that pressure with additional short positions. Meanwhile, 25,400 PE is witnessing long build-up, and strong OI in 25,000 PE shows downside anticipation. Overall, OI positioning strongly supports a bearish view.
________________________________________
🔁 Trend Bias:
🔴 Bearish unless NIFTY reclaims and sustains above ₹25,455
________________________________________
🧠 Trade Logic / Reasoning:
Price remains in a supply-driven setup, with a sharp rejection seen from ₹25,490–₹25,509. Support at ₹25,378 has held so far but looks increasingly fragile. Option chain behaviour reinforces this bearish bias—Call writers dominating higher levels and Put buyers building exposure at lower strikes.
________________________________________
📍 Important Levels to Mark:
🔺 Top Range: ₹25,608 – Look for breakout or reversal candlestick pattern + volume
🔻 Bottom Range: ₹25,378 – Watch for breakdown or bullish reversal pattern + volume
________________________________________
🎯 Trade Plan (Educational Purpose Only):
✅ Best Sell: Long - 25,400 PE – If breakdown below ₹25,378 confirms with volume
✅ Best Buy: Long 25,300 CE if price reclaims ₹25,455 + ₹25,490 zone with a strong bullish candle + volume
🟢 Demand Zone: NA
🔴 Supply Zone: ₹25,490–₹25,509 (Confirmed rejection area)
⚠️ Invalidation Below:
Bullish view becomes invalid if NIFTY breaks and holds below ₹25,378 with strong volume
Bearish view loses strength if NIFTY reclaims ₹25,455 with follow-through
________________________________________
⚠️ Disclaimer:
This post is for educational purposes only.
STWP is not a SEBI-registered advisor.
This is not a buy/sell recommendation.
Please consult your financial advisor before trading.
STWP is not responsible for any trading outcomes.
________________________________________
💬 Found this helpful?
Drop your thoughts in the comments ⬇️
🔁 Share with fellow traders
✅ Follow STWP for zone-based price action & option chain insights
🚀 Let’s boost awareness of smart & patient trading!