“Nifty 50 Intraday Key Levels | Buy & Sell Zones 31th Oct 2025”Want to learn more? Like this post and follow me!”
26240🔴 Above 10m closing Shot Cover Level
Strong resistance — short covering likely above this.
26080🟠 Below 10m hold PE By level /
Above 10m hold CE by level
25980🟣 Above 10M hold positive trade view
Below 10M hold negative trade view
Sentiment deciding level — crucial for trend direction.
25818⚫ Above Opening S1 10m Hold CE By level
Bullish entry level — CE hold area.
25690🟠 Below Opening R1 10m Hold PE By level
Below 10m hold PE By Risky Zone Weak zone — PE may strengthen below this.
25490🟢 Above 10M hold CE By Safe Zone level
Safe bullish zone — CE can be held confidently above.
25470🔵 BELOW 10M hold UNWINDING level
Breakdown zone — unwinding or heavy selling possible below.
Optionstrategies

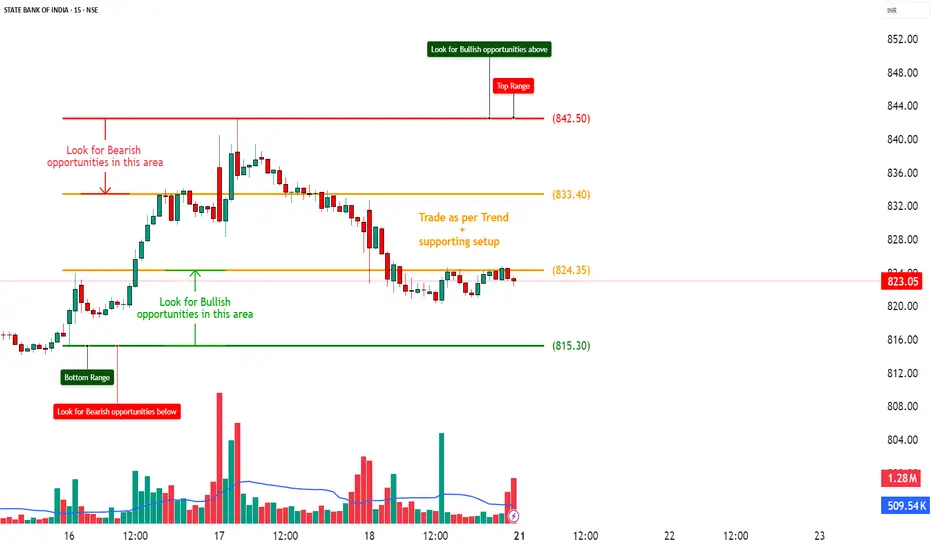
SBIN – Bearish Bias with Heavy CE Shorts and Weak Call Structure________________________________________________________________________________📈 SBIN – Bearish Bias with Heavy CE Shorts and Weak Call Structure
📅 Setup Date: 17.07.2025 | ⏱ Timeframe: Daily
📍 Strategy: Short-Term Bearish Momentum Setup with Defined Risk
________________________________________________________________________________
🔍 Overall View
Spot Price: ₹823.35
Trend: Mildly Bearish – Spot facing resistance at 830–840 with weak CE premiums
Volatility: IV ~18%–22% (stable to slightly elevated)
Ideal Strategy Mix: Bearish directional trades or credit spreads near resistance
________________________________________________________________________________
1️⃣ Bullish Trade (Contrarian Setup)
Best CE: Buy 820 CE @ ₹12.65
Why:
• ATM strike with highest delta (0.56) among CEs
• Smallest short build-up in CE chain (OI ↑0.73%, vs ~+4%–12% on other CEs)
• If spot reclaims 830+, this option will respond fastest
• IV is lowest (17.73%) = cheapest in premium vs other strikes
Contrarian Setup – Not ideal unless spot crosses 830 with strong volume
________________________________________________________________________________
2️⃣ Bearish Trade
Best PE: Buy 820 PE @ ₹8.65
Why:
• Strong Long Build-Up (+29.5% OI), volume-led spike (+46.6%)
• Solid delta (-0.44) with decent Vega → responds well to downside
• IV is relatively low (19.6%), allowing room for expansion
• Ideal strike as spot sits slightly above – quick delta pickup expected
________________________________________________________________________________
3️⃣ Strategy Trade (As per trend + OI data)
Strategy: Bear Put Spread → Buy 820 PE / Sell 800 PE
→ ₹8.65 / ₹3.00
Net Debit: ₹5.65
Max Profit: ₹20 – ₹5.65 = ₹14.35
Max Loss: ₹5.65
Risk:Reward: ≈ 1 : 2.54 ✅
Lot Size: 750
Total Risk: ₹4,237.50
Max Profit: ₹10,762.50
📊 Breakeven Point: ₹814.35
📉 Exit If: Spot closes above ₹832 (invalidates PE strength and bearish structure)
________________________________________________________________________________
Why:
• Heavy CE short build-up across 820–850 strikes (Bearish Call Ladder)
• 820 PE has strong long buildup + clean delta = momentum PE
• 800 PE still holding OI, good strike to sell for defined risk
• IVs are still in mid-range = spread cost low, R:R > 1:2.5
________________________________________________________________________________
📘 My Trading Setup Rules
Avoid Gap Plays
→ Check pre-open price action to avoid trades influenced by gap-ups/gap-downs.
Breakout Entry Only
→ Enter trades only if price breaks previous day’s High (for bullish trades) or Low (for bearish trades).
Watch Volume for Confirmation
→ Monitor volume closely. No volume = No trade.
Enter on Strong Candle + Volume
→ Execute the trade only if a strong candle appears with increasing volume in the direction of the trade.
Defined Risk:Reward Only
→ Take trades only if R:R is favourable (ideally ≥ 1:2).
Premium Disclaimer
→ Option premiums shown are based on EOD prices — real-time premiums may vary during execution.
Time Frame Preference
→ Trade with your preferred time frame — this strategy works across intraday or positional setups.
________________________________________________________________________________
⚠ Disclaimer (Please Read):
• These Trades are shared for educational purposes only and is not investment advice.
• I am not a SEBI-registered advisor.
• The information provided here is based on personal market observation.
• No buy/sell recommendations are being made.
• Please do your own research or consult a registered financial advisor before making any trading decisions.
• Trading involves risk. Always use proper risk management.
I am not responsible for trading decisions based on this post.
________________________________________________________________________________
Delta Neutral Strategy – How Pros Make Money Without Direction!Hello Traders!
Most traders believe profits only come from predicting market direction. But professionals know a secret: you don’t always need to predict — you can neutralise! Today’s post is about the powerful Delta Neutral Strategy , a technique used by institutions and smart option writers to earn consistently even in sideways or uncertain markets.
What is a Delta Neutral Strategy?
It’s a position where the overall delta (directional exposure) of your trades is zero . That means, whether the market goes slightly up or down, your position stays unaffected — and you focus on time decay (theta) or volatility crush (vega) to generate profits.
Why Pros Love Delta Neutral Trades
No Need to Predict Direction: You’re not betting on bullish or bearish trends — you profit from time and volatility.
Ideal for Range-Bound Markets: When markets are consolidating, delta neutral setups thrive.
Lower Risk, Higher Consistency: With proper hedging, these setups offer smoother equity curves and capital protection.
Scalable Strategy: Institutions run massive delta-neutral books — it’s a proven method for large funds.
Popular Delta Neutral Setups
Short Straddles & Strangles: Collect premium from both Call and Put options — best for low volatility or strong resistance/support zones.
Iron Condor: A defined-risk variation that profits in a narrow range, great for weekly expiry strategies.
Calendar Spreads: Benefit from time decay differences between near and far expiry options.
Risk Management is Key!
Delta neutral doesn’t mean zero risk. Use proper stop-loss, position sizing, and adjustment techniques to control loss during trending moves or volatility spikes.
Rahul’s Tip
“Neutral is powerful — when used right.” Mastering delta-neutral trading can unlock consistent profits without playing guessing games on direction. Just let the premiums work in your favour!
Conclusion
The Delta Neutral Strategy is not just for pros — even retail traders can learn it and build a consistent, low-stress income model. If you’re tired of predicting every move, maybe it’s time to shift to a strategy where direction doesn’t matter — risk management does .
Have you tried delta-neutral trades before? Please share your experience below and let’s grow together!
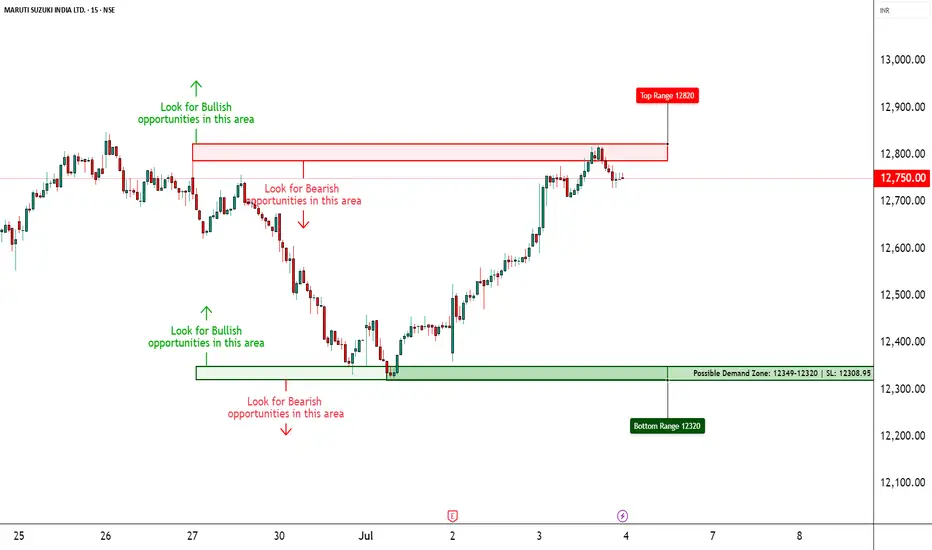
MARUTI – Strong Call Long Build-Up Dominance________________________________________
📈 MARUTI – Strong Call Long Build-Up Dominance | OI + Price Action Analysis
🕒 Chart Type: 15-Minute
📆 Date: July 3, 2025
________________________________________
🔍 What’s Catching Our Eye:
MARUTI closed around ₹12,752, and the entire Call side up to 13,500 is showing strong Long Build-Up, indicating aggressive bullish sentiment from option buyers. Meanwhile, the Put side is displaying Short Build-Up, further confirming bullish undertones. The price is steadily climbing, supported by strong institutional participation.
________________________________________
📌 What We’re Watching For:
If MARUTI sustains above ₹12,800, bullish continuation looks likely. Watch for follow-through toward ₹13,000 and 13,200+ if momentum persists. However, a drop below ₹12,500 could temporarily halt this upward bias.
________________________________________
📊 Volume Footprint:
Options activity is backed by strong volume — over 17k+ contracts at ₹13,000 CE and 15k+ at ₹12,800 CE — showing traders are betting big on further upside.
________________________________________
📈 Option Chain Highlights:
The OI data is highly supportive of the bulls:
• Calls (Long Build-Up):
o ₹13,000 CE: +104,450 OI | Price ↑ 8.6%
o ₹12,800 CE: +101,800 OI | Price ↑ 12.04%
o ₹12,900 CE: +95,650 OI | Price ↑ 10.07%
o Even OTM CE like ₹13,500 is active → trend belief is strong
• Puts:
o ₹12,800 PE & ₹12,700 PE both showing Short Build-Up, i.e., buyers believe downside is limited
Inference: Bulls are clearly in control, with both Call buyers active and Put sellers stepping in. This aligns with the broader bullish trend seen in the stock.
________________________________________
🔁 Trend Bias:
🟢 Bullish – Confirmed via price action and derivative sentiment
________________________________________
🧠 Trade Logic / Reasoning:
Strong accumulation is seen at every major Call level, from ATM to slightly OTM strikes. Short covering at ₹12,500 CE and long build-up in higher CE strikes confirms that the bulls are expecting a continuation rally. PE writers are unwinding or adding shorts – classic sign of strength.
________________________________________
📍 Important Levels to Mark:
🔺 Top Range (Resistance): ₹13,200 – ₹13,500
🔻 Bottom Range (Support): ₹12,500
________________________________________
🎯 Trade Plan (Educational Purpose Only):
✅ Best Buy (Equity): Above ₹12,800 with strong bullish candle
✅ Best Sell (Equity): Avoid unless ₹12,500 is broken
✅ Best CE to Long: ₹13,000 CE – Strongest long build-up with momentum
✅ Best PE to Long: Avoid PE long – sentiment doesn’t support bearish bets
🟢 Demand Zone: NA
🔴 Supply Zone: NA
⚠️ Invalidation Below:
Bullish bias is invalidated below ₹12,500 with high volume selling
________________________________________
⚠️ Disclaimer:
This analysis is for educational purposes only.
STWP is not a SEBI-registered advisor.
No buy/sell recommendations are made.
Please consult your financial advisor before trading.
STWP is not responsible for trading decisions based on this post.
________________________________________
💬 Did this help you spot the momentum early?
Drop your views in the comments ⬇️
🔁 Share this with traders watching MARUTI
✅ Follow STWP for clean price + option chain trades
🚀 Let’s educate more traders with patience and clarity!
________________________________________
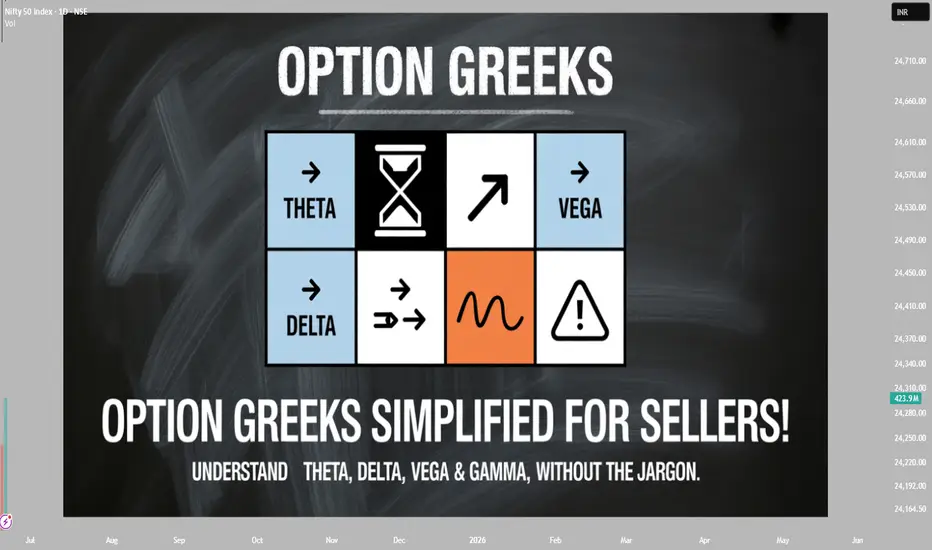
Know all about Greeks - I have Simplified for Option Writers!Hello Traders!
If you're into option writing, understanding Option Greeks is non-negotiable. But don’t worry — you don’t need to be a math genius. You just need to know how each Greek affects your premium, risk, and time decay . So, let’s simplify the Greeks in a way that every option seller can use — practically.
Key Option Greeks Every Writer Must Know
Theta – The Time Decay King:
This is your best friend. Theta tells you how much premium the option loses each day. As an option seller, you profit when time erodes the premium. The closer to expiry, the faster Theta works for you.
Delta – Directional Risk Manager:
Delta shows how sensitive the option is to price movement. For sellers, a low delta means less directional risk. Always monitor Delta when selling near-the-money options.
Vega – Volatility Impact:
Vega tells you how much the option price will change with volatility. High Vega means more premium — but also more risk. Avoid writing options when IV is very low, and be cautious when IV is about to rise (like before events).
Gamma – The Risk Multiplier:
Gamma increases your Delta exposure rapidly when the price nears the strike. For option writers, high Gamma = high risk, especially near expiry. Always track Gamma if you're selling options close to the money.
Rahul’s Tip
You don’t need to memorize formulas — just feel how each Greek impacts your trade. That’s how professional option writers stay ahead of retail noise.
Conclusion
Mastering the Option Greeks helps you sell smarter, avoid traps, and adjust your trades with confidence. Use Theta to earn , Delta to hedge , Vega to time entries , and Gamma to manage risk near expiry . Keep it simple, and you’ll stay profitable over time.
Do you track Greeks while writing options? Which one helps you the most? Drop your thoughts below!
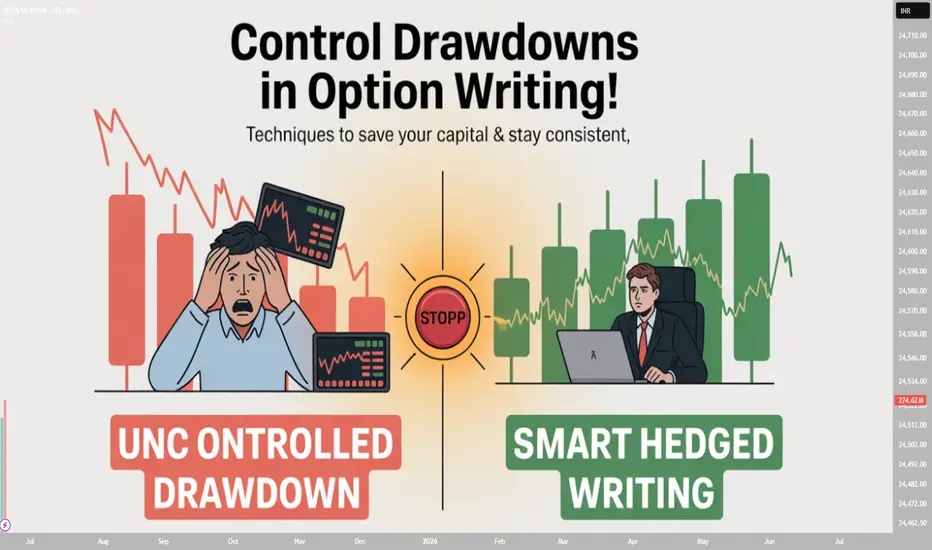
Max Drawdown Control Techniques in Option Writing!Hello Traders!
Option writing can generate consistent income, but only if risk is managed well. The biggest threat? Max drawdown . Even one bad expiry or a trending move against your position can wipe out weeks of profit. That’s why today’s post is all about drawdown control techniques — so you stay profitable, consistent, and emotionally stable.
Top Techniques to Control Drawdowns in Option Writing
Position Sizing is Your First Shield: Never write options with your full capital. Risk only 1–2% of your capital per trade. Smaller lots = smaller damage.
Avoid High IV Events: Skip writing options during major events like RBI, Fed meetings, elections, etc. Volatility can crush your position in seconds.
Use Hedged Strategies: Use spreads (e.g., Iron Condor, Credit Spreads) instead of naked writing. It limits the max loss while capping profits moderately.
Track Max Loss in Advance: Before taking a position, use payoff diagrams to see your worst-case loss — and stay below it. Never write blind.
Follow OI + Price Structure: Combine Open Interest shifts with price action to avoid writing near breakout zones or momentum candles.
Adjust & Roll Smartly: Don’t freeze when market moves fast. Learn to adjust strikes or roll positions to next expiry to limit the damage.
Have a Weekly Stop Limit: Define a max weekly drawdown (e.g., 3%) — if hit, stop trading for the week. It keeps your head cool.
Rahul’s Tip
Drawdown is the real game in option writing. Not profit – but protecting capital is your edge. You don’t win by earning more — you win by losing less.
Conclusion
Option writing rewards discipline, not aggression. If you want to make a career out of it, controlling drawdowns is the #1 priority . Focus on risk-adjusted returns , not just premium collected. Write smart, hedge well, and walk away when the odds are not in your favor.
Have you ever faced a big drawdown in option selling? What did you learn from it? Share your thoughts below!
Bank Nifty Strong move!!
As per trend analysis Bank nifty has seen bounce earlier in March'23 and November'23 it works as powerfull support given big moves in longer time.
Also trend also comfirms that buyers are still intact to make bounce in addtion to that we can see a wick reversal pattern is also seen on daily time frame.
Which also confirms buyer strength and also bank nifty has hold tightly on 25th Jan'24. which can lead a goods movement day keeps eyes on opening of Bank Nifty.
On Smaller time frame buyer have tried to make movement in last hour which also give hint for trend day.
Still beware of traps & avoid false breakouts enter on restest only And also keep note it can also fall from support as more the retest at support zone makes it weaker.
Note : Do your own analysis before making any trade or investment decesion all post are for study purpose.

Options: Buying vs. Selling - A Comprehensive GuideExploring the realm of options trading unveils two key players: Buyers and Sellers.
Each wields unique strategies with its mix of risks and rewards.
Let's break it down in simple terms.
# Option Buyers: Riding on Possibilities
Chances of Making Money (PoP):
Buyers aim for good market moves, counting on accurate predictions within a specific time.
Risk:
For buyers, risks are limited. Losses only go as far as the premium paid.
Time Pressure:
Buyers fight against time. Being right means aligning predictions with a set timeframe.
Volatility Impact:
Buyers gain when things get more uncertain, making their options potentially more valuable.
Market Moves Matter:
Buyers thrive when the market goes up or down; they bet on a specific direction.
Skill Needed:
While simpler than selling, buyers need a good sense of market trends.
# Option Sellers: Crafting Strategies with Care
Chances of Making Money (PoP):
Sellers prefer stable or slightly tricky markets, benefitting from time passing by.
Risk Check:
Sellers face unlimited risks if the market moves too much against them.
Time on Their Side:
Sellers like time passing; it works in their favor.
Volatility Impact:
Less drama is better for sellers; it makes their options lose less value.
Direction Doesn’t Matter Much:
Sellers can make money in quieter markets; they have more room to move.
Skill Level:
Selling needs more skill, involving clever strategies and calculations.
# What Decides Success: A Mix of Factors
Winning in the options game is about reading the market, knowing your risk appetite, and being smart with strategies.
- Chances of Making Money: Buyers look for clear market trends, while sellers like it stable.
- Risk Game: Buyers have limits on losses; sellers need to watch out for big market moves.
- Time’s Effect: Buyers fight against time; sellers make time work for them.
- Cost and Volatility: Buyers pay more, and gain from more drama. Sellers earn from premiums and like calm markets.
Succeeding in options trading is about thinking smart, adapting to what the market gives, and keeping your skills sharp.
Grateful for Your Support! 🌟
To our amazing 150+ followers, your enthusiasm fuels our journey! 🚀 Thank you for being part of our community, and decoding financial mysteries together. Here's to more insights and learning ahead.

13th Dec ’23 - BankNifty does a W pattern on the ascending trendBankNifty Today’s Analysis
The opening candle in Banknifty had a swing range of 189pts ~ 0.4%. That candle looked dangerous and I really thought we would have a deep RED day today. Quite interestingly, BN made a W pattern right at the top band of the ascending channel (see the 63mts chart link also).
4mts chart link - click here
Once BN got caught in that channel envelope, it was blindly following that path. The final close is at -0.01% - it cannot get more flat than this. The W pattern may change the dynamics for tomorrow - usually, it favors the bulls. So we need to wait and watch for the first hour or so tomorrow and then decide.
From an expiry trading perspective, the OTM options really did not have any premium to start with. The opening moves gave some rush and then the reversal by 12.31 also gave some boost to the strikes.
63mts chart link - click here
BankNifty has entered the ascending channel and from a medium-term perspective, it all looks bullish to me. For tomorrow, I wish to start with the neutral stance and then change course as the price action develops. Falling below 46565 is bearish to me.

21 Sep ’23 Post Mortem on BankNifty - will 44429 get broken ?BankNifty Analysis
One thing that really gave me confidence in the bearish move was the build up of momentum in banknifty. I did not get this feedback from Nifty, but Banknifty’s pulse gave me hope that further down moves are highly possible.
Since I rely on options flow also to gauge the sentiment - the intensity of CE shorts were too good today especially in the last 1 hour of trade.
Nifty had a flattish day after the 1st hourly candle - but take a look at banknifty. The 3rd candle onwards everything was in RED. 567pts out of 760 came in this period - and the rest points actually came in gap-down. When the market falls in normal trading hours - it gives a boost of confidence vs fall via gap-downs. That is because traders prefer to see the sentiment changing hands.
For tomorrow I am continuing the bearish stance with the first target being 44429 and then 44236. If 44068 gets taken out in next 2 sessions - it is going to be a game changer

13 Jul '23 Post Mortem on Nifty + Weekly expiry analysisNifty Weekly Analysis
Between the last expiry & today, Nifty50 is actually down 40pts ~ 0.21%. That seems quite hard to believe especially when we had an ATH break today right?
The fact is N50 broke out from the 19500 levels today & that would have created the perception that nifty had a gaining week. Also on 7th July we had a red day and almost touched the 19300 levels. So credit goes to N50 since it recovered all its losses & hit a new ATH of 19567 today!
---
Nifty Daily Analysis
We had 2 strong moves today
A gap up open and then a race to take out the ATH, a total swing of 182pts ~ 0.94%
A similar fall of 180pts ~ 0.92% to touch the prev. close value
Both the directional move would have given ample opportunity for options traders to mint money today.
Final close was 0.15% higher mainly supported by the NiftyIT index. The dramatic inverted U shape price action was due to RELIANCE which fell from 2799 to 2743. HDFCBK, KOTAKBK & SBIN also dragged the index.
Trades Taken
Other than the regular expiry trades, I reopened a bullish PE credit spread between 10 to 10.30 AM. 19500/19400 PE for 67.45/40.65. This was taken when Nifty was at the ATH and due to the reversal this position is currently in loss.
Will take a decision tomorrow to hold on to bullish bias or exit at a loss.

11 Jul '23 Post Mortem on Nifty + Long call continues...Today we had a perfect inverted V formation. The high of the day at exact 12.00 noon. A rally of 82pts from opening level and then a fall of 66pts. Even though nifty fell today, it was showing so much of positive energy and a general reluctance to fall. We will bring up the comparison with banknifty shortly & it will make sense.
Today's peak formation ensured we are getting a double top at the ATH levels ~ 19508. The profit booking may be attributed to that. If we continue to fall in the coming days - its better to change the bias from long to neutral.
---
Trades Taken
Yesterday I had reversed my short position to long position & had carried the 19400/19300 PE bullish credit spread overnight. Luckily it worked out alright today. By 10.43 I exited at a price of 29.6/12.9. I exited because more than 50% of premiums had decayed & not because I was bearish.
At the same time I entered into 19400/19300 PE bullish credit spread of the 20th July series for a price of 74.7/48.4. We then had the classic reversal, almost back to the open levels.
Somehow I felt the risk:reward was not matching & then exited the new position at a loss by 14.46 @ 79.7/49.4 and got back to the 19400/19300 PE spread in the 13th Jul series for 32.7/12.3.
The 15.00 candle really scared me and if you calculate the risk:reward was 3980:1020. So I exited the credit spread & went ahead with the call debit spread of 19300/19400 CE @ 176.15/95.15 by 15.03. The rationale being 19300 was still in the money & might offer some cushion as expiry is in 2 days. Whereas 19400 PE could go in the money if the move is 50pts or more.

When to adjust Options - 5 Guidelines to stop your lossesIn this video, I discuss 5 Options selling guidelines which you can use to exit your option trades when they go wrong.
Selling options come with the risk of unlimited losses . That's why, the main aim of adjusting options is to put a cap to the losses , reassess the situation and increase profitability.
Follow @piyushrawtani for more!
Cheers =)

PostMortem on BankNifty Today & Analysis of 19 APR 2023NSE:BANKNIFTY had a narrow range based trade today with a minor negative bias. Yesterday's swing low was breached by 13.40, but it does not pose a major scare yet!
The pattern may look bearish on the 5mts TF, but it actually isnt. Banknifty is comparatively outperforming the Nifty50 and NiftyIT index for the last 3 days.
NSE:BANKNIFTY did not have enough momentum to take out the swing high or breach the 42576 levels. This along with the weak sentiment in Nifty50 would have prompted the bulls to take a small break today. There was no violent price moves or support/resistance breaks - this again ensured that the option prices remain low on the penultimate day of weekly expiry.
---
The unusual low options premium in bank nifty options are nudging traders like me to switch back to Nifty50 options. I am hoping that this decoupling of banknifty with nifty50 may not last long and the volatility will normalize in the days ahead.
---
The 15mts chart has not turned bearish yet. What we see could just be a consolidation. If banknifty is planning to reverse direction at this level - the the first support of 41624 has to be taken out in the next 2 days. Only if the support is taken out quickly, the momentum will favor the dip.
---
1hr chart is still looking strong, the 2 prominent gap-ups standing out boldly.
It might be interesting to watch out how the global markets react to the EURO, UK CPI data today. If there are more rate hikes in pipeline - then we may have a weak global sentiment again!

GLENMARK levelsNSE:GLENMARK
#NSE:GLENMARK 360 CE given today and it worked really well and bagged 14k/lot.
Further levels marked can be work as resistance.
Happy LEarning !!

NIFTY | Cup & Handle formation (Hedged + Positional please)NIFTY | Cup & Handle formation (Good only for hedged / spread position - it can take 3-5 days)
CMP : 15770
SL : 15670
Target : 16100
Almost 1:3 risk reward setup.
Reference : Bull Call Spread
Buy 15800 CE
Sell 16000 CE
July 8th Expiry or July monthly expiry

Bullish candle after two narrow range candles.Higher low formation with a double bottom formation on RSI. Bullish candle after two narrow range candles. First level of resistance 269 thereafter targets are big. 195 should be protected.
