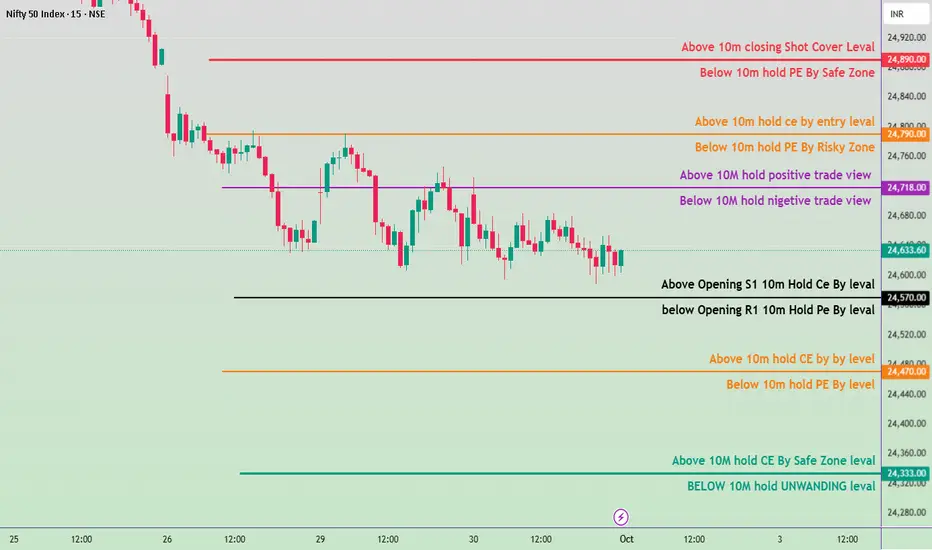
“Nifty 50 Key Levels & Trade Zones 1st Oct 2025”
“Follow me and like this post for more learning tips!”
24890 → Above 10m closing → Short Cover Level (CE Safe Zone)
24790 → Above 10m hold CE (Entry Level)
Below 10m hold PE (Risky Zone)
24718 → Above 10m hold → Positive Trade View
Below 10m hold → Negative Trade View
24570 → Above Opening S1 hold CE (Buy Level)
Below Opening R1 hold PE (Sell Level)
24470 → Above 10m hold CE (Buy Level)
Below 10m hold PE (Sell Level)
24333 → Above 10m hold CE (Safe Zone)
Below 10m hold UNWINDING Level
Optionstrategy
Big Move? No Problem – Sell CE and Let Theta Work!Hello Traders!
We’ve all seen those days when the market opens with a big gap-up or gives a strong rally – and most traders start panicking. But if you’ve been into option writing, you know that’s exactly when opportunity shows up.
High IV + inflated premiums = perfect setup to sell Calls (CE) and let Theta (time decay) do all the work for you.
Why this works so well after a big move:
CEs become expensive:
After a sharp rally, call options are overpriced. That’s your edge as a seller.
Theta kicks in fast:
If price starts to cool off or even just go sideways, the time decay starts eating the premium quickly.
Price usually settles down:
Markets don’t rally forever. After a big move, some pause or pullback is very common.
You don’t need to be 100% right:
Even if the price doesn’t fall, you still make money as long as it doesn’t fly through your strike.
Some ground rules for this strategy:
Sell Out-of-the-Money (OTM) Calls:
Pick a strike that’s at least 1–2% away from current price with decent premium.
Find nearby resistance:
Sell near technical resistance zones where price usually slows down.
Don’t sell into crashing IV:
Make sure IV is still high. If it's already falling, your edge is gone.
Always use a stop loss:
Set a level where you'll exit if the trade goes against you. Never hold naked without a plan.
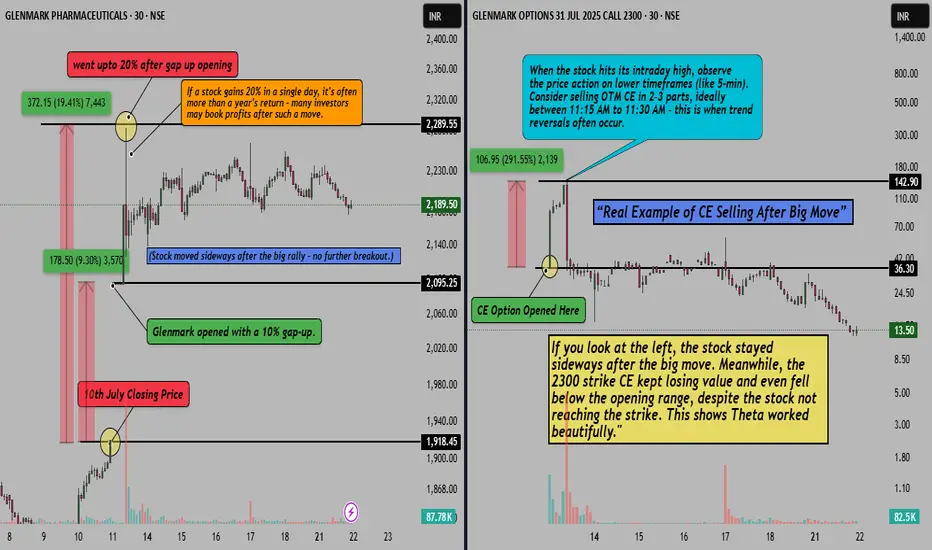
Let’s Talk Real Example – Glenmark 2300 CE Sell
Check the chart above 👆
Glenmark gave a huge 10% gap-up and rallied up to 20% intraday . That’s a crazy move – and we know what that means: CEs were loaded with premium .
So around 11:15 AM (when the stock hit the top), we started selling the 2300 strike OTM CE .
What happened next?
Price went sideways. No breakout. But the premium kept falling hard. Even though price didn’t hit 2300, CE collapsed – pure Theta magic!
Rahul’s Tip
When premiums are juicy after a big move, you don’t need to do much. Just sell smart, manage your risk, and let Theta take care of the rest.
Final Thoughts:
CE selling isn’t about catching reversals. It’s about taking advantage of overpriced options and letting time work for you.
So next time the market gives a big rally, don’t chase it. Just chill, sell smart, and let Theta kill the premium!
Do you sell options after big moves too? Share your views or setups in comments!
Why Option Writers Win Even if They're Wrong About Direction?Hello Traders!
Have you ever noticed that option sellers often make money even when their market direction isn’t perfect? That’s because option writing is not just about predicting direction — it’s about predicting behavior : time, range, and volatility. Let’s understand why this strategy works and how you can use it smartly.
Why Option Writers Have the Edge
Time Decay (Theta) Works for Them:
Every passing minute eats away option value — and option sellers profit from that decay . Even in sideways or slightly wrong trades, they gain as time works in their favor.
Range-Based Strategies:
Writers often use strangles, straddles, or iron condors to bet on the market staying within a range. If the price doesn’t move wildly, they win — even if the direction isn’t exact.
Volatility Crush After Events:
After big events (like budget, earnings, Fed meetings), IV drops sharply , causing option premiums to collapse — again benefiting writers.
High Probability of Profit:
Most out-of-the-money options expire worthless. Statistically, writers win more often , even with a lower reward compared to risk.
Rahul’s Tip
If you don’t want to always predict direction, learn non-directional option writing setups based on support/resistance, OI data, and VIX levels. Always hedge your positions and respect risk.
Conclusion
Option writing is not about being right — it's about being smart. When done with discipline and proper risk management, it can generate consistent income, even if the market doesn’t move as expected.
Are you an option buyer or writer? Share your favorite strategy in the comments below!
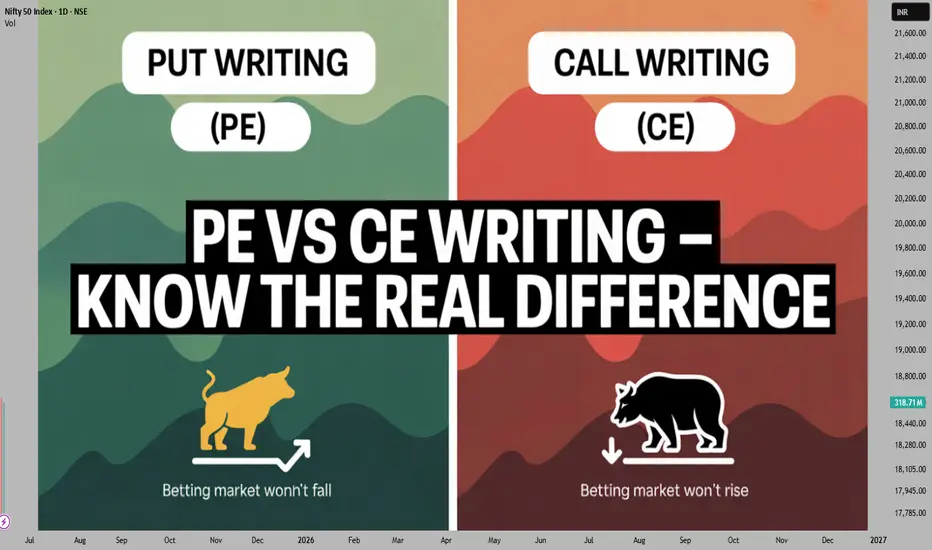
PE Writing vs CE Writing – Core Difference Explained!Hello Traders!
When it comes to Option Writing , many beginners jump into selling Calls (CE) and Puts (PE) without understanding the key differences. But PE Writing and CE Writing are not just two sides of the same coin — each comes with its own psychology, risk profile, and best-use scenario. Let’s break it down so you can write options like a pro.
What is CE Writing (Call Writing)?
Definition: Selling a Call Option (CE) means you're betting that the market will not go above a certain level by expiry.
Bias: It’s a bearish to neutral strategy. You profit if the market falls or stays flat.
Common Use Case: Ideal when the market is at resistance or when data shows strong supply zones or heavy CE OI buildup.
Risk Profile: Unlimited loss if market rallies sharply — hence better when combined with hedging.
What is PE Writing (Put Writing)?
Definition: Selling a Put Option (PE) means you're betting that the market will not go below a certain level.
Bias: It’s a bullish to neutral strategy. You profit if the market rises or remains sideways above the strike.
Common Use Case: Works best when market is near support or when strong Put OI build-up suggests buyers are defending levels.
Risk Profile: Unlimited loss if market crashes — especially dangerous during high-volatility or news-driven sessions.
PE Writing vs CE Writing – Key Differences
Sentiment: PE writing is bullish-biased, CE writing is bearish-biased.
Market Structure: PE writers want market to stay above their strike, CE writers want market to stay below theirs.
Risk Exposure: Both carry unlimited loss potential — proper SL and hedging are essential.
Expiry Day Behavior: CE premiums fall faster in strong downtrends; PE premiums decay faster in rising markets.
Rahul’s Tip
Don’t blindly sell PE or CE just because premiums are high. Use data like OI shifts, support/resistance, VIX, and structure to choose the right side.
Conclusion
Both PE Writing and CE Writing are powerful tools — if you know when and how to use them. Writing without context is gambling; writing with structure is strategy. Always trade with risk defined, bias clear, and exit planned.
Do you prefer PE or CE writing? Let me know your favorite setup in the comments!
What is Option Writing? Why 90% Traders Get It Wrong!Hello Traders!
Today, let’s break down one of the most misunderstood strategies in the options market — Option Writing . While it’s known for generating consistent income, the truth is that most retail traders get it wrong . Why? Because they don’t respect the risk, structure, and psychology behind it. Let’s understand what option writing really is — and how to do it the right way.
What is Option Writing?
Option Writing = Selling Options: You sell a Call or Put and receive a premium. If the option expires worthless, you keep the entire premium as profit.
Time Decay Advantage: Option writers benefit from Theta — the value of the option decays with time.
Range-Bound Bias: Works best in sideways or non-trending markets, especially on expiry days or low-volatility phases.
Why 90% of Traders Get It Wrong
No Risk Management: Most sellers don’t hedge or define SL. One sharp move can wipe out weeks of profits.
Overleveraging: Selling options without understanding margin, exposure, and volatility leads to quick blowups.
No Data-Based Strategy: Randomly selling options without understanding OI, IV, VIX, or market structure is a recipe for disaster.
Wrong Market Conditions: Option writing during trending or breakout phases leads to big losses — especially for naked writers.
Rahul’s Tip
Sell options only when the odds are in your favor — backed by data, structure, and proper hedging. And always treat this like a business, not a shortcut to income.
Conclusion
Option writing is a powerful income strategy, but only when done with the right mindset and discipline. Most traders lose because they sell with greed and no system. If you want to win, study the Greeks, respect the risk, and manage your capital wisely.
Are you an option writer or planning to learn? Drop your experience in the comments! Let's build this together.

Nifty Iron Condor – Range-Bound Strategy for May Expiry!Hello Traders!
This post is for those who want to generate passive monthly income by leveraging the power of non-directional option selling . Based on current Nifty structure and OI data, I have spotted a range-bound opportunity — perfect for executing a safe, hedged Iron Condor Strategy .
Why This Strategy Now? (Based on Chart Analysis)
Resistance Zone: 25000–25200 (Heavy supply, multiple rejections visible)
Support Zone: 23400–23250 (Major bounce levels, strong OI support)
Nifty is currently trading near 24325, well inside this range — perfect for deploying a neutral premium-eating setup.
Strategy Setup (Iron Condor – 29 May 2025 Monthly Expiry)
Sell 25200 CE @ ₹124.25
(Resistance-based upper strike)
Buy 25800 CE @ ₹38.60
(Hedge to protect against breakout)
Sell 23400 PE @ ₹157.05
(Support-based lower strike)
Buy 22800 PE @ ₹91.40
(Hedge to protect against breakdown)
Strategy Highlights
Why This Works? (OI Logic + Technical View)
Strong resistance visible at 25000–25200 zone with increasing call OI
Solid put writing seen at 23400 & 23500 strike — confirming downside support
Volatility is stable, time decay is in our favor — making this ideal for Iron Condor sellers.
Risk Management & Exit Plan
Exit early if either side breaks with volume
Don’t hold till expiry — aim to exit around 70–80% of max profit
Always keep SL alert at breakeven range breakouts
Rahul’s Tip
“Option writing is not for thrill, it’s for discipline. Iron Condor is a weapon when range is visible — use it like a sniper, not a gambler.”
Conclusion
If you believe Nifty is likely to stay between 23400–25200 for the next few weeks, this Iron Condor setup offers great risk-managed income potential. Use proper lot sizing and risk control — and let theta do the work for you!
Have you ever deployed an Iron Condor on Nifty? What was your experience? Drop your thoughts in the comments!
If you found this post valuable, don't forget to LIKE and FOLLOW !
I regularly share high-quality trading setups based on real analysis, OI data, and smart risk management strategies.
Disclaimer: This analysis is for educational purposes only. Please consult a financial advisor before making investment decisions.

Gamma Zone Reversal Strategy – Real Data Based Intraday Setup!Hello Traders!
In today’s post, we’ll explore the Gamma Zone Reversal Strategy — a high-accuracy intraday setup that uses option data to identify powerful reversal zones. This strategy is especially effective on expiry days and is based on real-time behavior of market makers.
What is a Gamma Zone?
A Gamma Zone is a strike where option sellers have heavy Open Interest (OI) and high Gamma exposure.
These zones are often defended strongly by market makers to avoid delta risk, causing sharp intraday reversals.
Ideal Gamma Zones are identified by high Gamma + high OI + high volume near current spot price.
Real Market Example: Nifty 24900 PE (29 MAY 2025 Expiry)
Let’s take a real-time example from Option chain data and assume tomorrow is expiry day:
Gamma: 0.08 (High)
OI Change: +37624
Volume: 1156817
LTP: 194.05
Spot Price: 24845
This means that 24900 PE is a strong Gamma zone, where put writers have built huge positions. Market makers are likely to defend this zone to avoid rapid changes in Delta exposure — leading to a high chance of price bouncing from here. I am posting this educational idea today because there will be another 3 days to analyse this before 29th May expiry.
How to Trade Gamma Zone Reversal Strategy
Identify High Gamma Strikes: Look for strikes with high Gamma, strong OI addition, and heavy volume near spot.
Observe Price Reaction: Watch if price approaches these zones and forms rejection candles (e.g., Pin Bar, Hammer, Engulfing) on 5–15 min charts.
Entry Point: Enter when price gives confirmation — candle + VWAP support or volume spike.
Stop Loss: Place SL slightly beyond the Gamma zone (e.g., below 24900 if buying CE).
Target: Nearest resistance level (e.g., 25050 or 25100).
Why It Works So Well
Market Maker Hedging: They aggressively hedge around Gamma zones, creating powerful intraday moves.
Expiry Day Power: Gamma sensitivity is highest near expiry — ideal for scalpers and option buyers.
Data-Driven: This is based on real-time OI shifts, not assumptions or indicators.
Rahul’s Tip
Use Gamma zones in confluence with VWAP, OI change, and candle confirmation . Never trade blindly at a Gamma level — wait for price action to confirm the setup.
Conclusion:
The Gamma Zone Reversal Strategy is one of the most reliable setups for expiry-based intraday trading. It helps you follow smart money behavior and enter trades at turning points where market makers are active.
If you want to learn everything about Futures and Options from A to Z, follow us now — I'm bringing powerful educational content your way!
Do you track Gamma zones in your trading? Let us know in the comments — and suggest any topic you want us to post next!

Head and Right Shoulder–Weekly Strategy for Nifty 08 May Expiry!Hello everyone, This week’s expiry strategy is not just any setup – it’s a premium structure crafted to take advantage of market exhaustion near resistance. We’re calling it the Head and Right Shoulder Strategy, and the payoff shape says it all!
Why This Strategy? (Based on Chart Analysis)
Resistance Zone: 24400–24785 (supply-heavy region, multiple rejection wicks visible)
Support Zone: 23800 (major bounce levels, strong candle reactions)
RSI Divergence Confirmation: Bearish divergence spotted on higher time frame, hinting exhaustion
Strategy: Head & Right Shoulder – 08 May 2025 Weekly Expiry
Sell 2x 08MAY2025 24500CE @ 138
Sell 2x 08MAY2025 23850PE @ 115.65
Buy 1x 08MAY2025 24250PE @ 220.25
Buy 1x 08MAY2025 24250CE @ 269
Payoff Graph for Nifty weekly strategy
Strategy Highlights:
(Head and right shoulder pattern on payoff chart – limited loss, defined range!)
Why This Works (Key Logic + Technical View):
Bearish RSI Divergence: Visible on 2-hour chart
Minor resistance at 24400 acting as rejection zone
Resistance-heavy zone above 24750 – price unlikely to sustain above this weekly
Support near 23800 – strong bounce area
Volatility dropping – makes premium writing favorable
Risk Management:
Don’t hold if either side breaks with strong volume
Exit if Nifty sustains above 24800+ or below 23650
Always keep SL alert or reversal signs on breakout
Rahul’s Tip
“Options trading is not only about payoff views, it’s about understanding structure.
This setup looks like a Head and Right Shoulder on the payoff – and we’re trading it like one.”
Conclusion:
This Head and Right Shoulder structure fits perfectly for the current week. With clean resistance levels and visible exhaustion patterns, the payoff structure gives both direction and edge.
What do you think about this setup? Have you ever deployed Head & Shoulder shaped option strategies? Let me know in comments below!
If you found this post valuable, don't forget to LIKE and FOLLOW !
I regularly share real-world trading setups, actionable strategies, and learning-focused content — all from real trading experience, not theory. Stay connected if you're serious about growing as a trader!
Disclaimer: This analysis is for educational purposes only. Please consult a financial advisor before making investment decisions.

Short Covering Trap Strategy – How to Catch Massive Moves!Hello Traders!
Today, we are diving into one of the most powerful and explosive setups in trading — the Short Covering Trap Strategy . When shorts get trapped and are forced to exit their positions, it can trigger massive upward moves in a very short time. If you can spot these traps early, you can ride some of the fastest rallies in the market!
What is a Short Covering Trap?
Short sellers bet on the market falling by selling first, planning to buy later at a lower price.
When the market suddenly reverses up against their position, they are forced to buy quickly to cover losses — creating a short covering rally .
This forced buying can lead to big green candles, breakout moves, and strong trend continuation .
How to Spot a Short Covering Trap
Identify Weakness or Breakdown Attempt
→ Price tries to break a support level but immediately reverses with high volume.
Sharp Reversal Candle
→ Look for strong bullish engulfing, hammer, or big green marubozu candle after false breakdown.
Volume Spike Confirmation
→ Check for sudden volume surge along with price reversal.
More volume = more trapped shorts.
Breakout Above Resistance
→ If price breaks above immediate resistance after trapping shorts, momentum can explode.
Real Example (OI Study please check chart above)
On 25th April 2025, Nifty faced rejection from the Resistance Zone around 24,100 levels.
OI data at 2 PM showed rising call writing pressure — indicating strong bearish sentiment initially.
By 3:30 PM, signs of weakening call writers emerged as put writers started adding positions, hinting at potential reversal.
On 28th April 2025, after Monday market opening, early morning OI data (9:15 AM and 10:15 AM) showed massive unwinding of call writers and heavy addition of put writing.
This sudden OI shift triggered a Short Covering Trap , leading to a quick rally of around 284 points in a short time.
Entry, Stop Loss, and Target Plan
Entry:
After confirmation candle closes above immediate resistance.
Stop Loss:
Below the reversal candle or recent swing low.
Target:
First target = Previous day's high or next major resistance.
Second target = Risk-Reward 1:2 or more.
When to Avoid This Setup
Low Volume Moves:
If the reversal happens without volume, it’s risky — avoid trading it.
Trending Down Days:
If broader market sentiment is heavily bearish, short covering may not sustain.
Rahul’s Tip
“Short covering rallies are like a firecracker — fast and furious. Ride it with strict risk control and exit smartly at targets.”
Conclusion
The Short Covering Trap Strategy offers some of the best risk-reward trades, especially in volatile markets. Recognize the signs early, manage your risk, and you can catch powerful explosive moves before the crowd!
Have you ever caught a massive short covering rally? Share your best trades and experiences in the comments below!
If you found this post valuable, don't forget to LIKE and FOLLOW !
I regularly share real-world trading setups, actionable strategies, and learning-focused content — all from real trading experience, not theory. Stay connected if you're serious about growing as a trader!

Nifty Daily Levels Update For Option Day Trading Tomorrow Call Side Posiible Trade in Nifty
First Possible Trade
Tread Entry
If Nifty sustain Above Support Zone (16606 -16588) You can Buy 16600 ATM CALL OPTION
Trade Target
Up side First Target is 16650 and If Any 1 Hour CandleCloses above first Target then Second target is 16700
Tread Stoploss
After Entry in Trade If any 30 min. Candle Closes Below Support 16588 then exit From Trade Or Take Stoplos of Maximum 20 /25 oints
Second Possible Trade
Tread Entry
If Nifty sustain Above Support Zone (16497 -16480) You can Buy 16600 ATM CALL OPTION
Trade Target
Up side First Target is 16585 and If Any 1 Hour CandleCloses above first Target then Second target is 16606 /16650
Tread Stoploss
After Entry in Trade If any 30 min. Candle Closes Below Support 16480 then exit From Trade Or Take Stoplos of Maximum 20 /25 oints
Tomorrow Put Side Posiible Trade in Nifty
Tread Entry
If Nifty Sustain Below Resistance Zone (16606-16588 ) You can Buy 16350 ATM PUT OPTION
Trade Target
Down side First nifty Target is 16497 If Any 1 Hour CandleCloses above first Target then Second target is 16370
Tread Stoploss
After Entry in Trade If any 30 min. Candle Closes Above Resistance 16606 then exit From Trade Or Take Stoplos of Maximum 20 /25 oints

Bank nifty target 36000 if price sustain above 35800 Bank nifty Target 36000 if price sustain above 35800 under 15 minutes candle
Trade set up :
a. Buy 35800 CE if price sustain above 35800 under minutes candle for 21st July expiry
Good Risk Reward Setup in this trade.

Nifty Level Upadate for Trading | END OF DAY CHART ANALYSISIf nifty Sustain above 17099 buy ATM CALL option but target is small 17185 - Stoploss - 17070
If nifty Sustain below 17070 buy ATM PUT Option - Stoploss 17100
For more update Serch in Google - manoj shinde 27485

Sideways movement in NIfty Now the Nifty Index is in consolidation mode after a strong bull run. Lucky for Option sellers indeed. ( Monthly Contracts)
1) We can execute Short Straddle near the All time High resistance or near to the immediate support at 17100 to 17000 (as per OI). Risky traders can go for Positional option buying (considering theta decay).
2)As its moving in a short range (350 points), it also a good option to use Short Strangle.
I would personally prefer the 1 st method, because there are chances that Support and Resistance levels get Breached.
Please share your valuable feedback
Disclaimer: Kindly do your own analysis and consult your advisor before taking any trade. This view is for educational purposes only.

Bank Nifty 13-7-2021Bank Nifty is looking quite bullish as Nifty 50 is also bullish but one thing that you should remember is that the Bank Nifty is considerably weak then Nifty 50. So you can expect a bullish view tomorrow. A gap up is expected because
1. There can be a break out due to ascending chart pattern that I analyzed in previous analysis. So keep an eye out their.
2. After analyzing the option chain we saw that the call writers exited their shorts in huge and amount and their is a short buildup heavily on the bullish or put side.
3. The PCR is 1.18 which is slightly overbought this is one of the reason why Bank Nifty is weak than Nifty 50.
4. The Bank nifty has gave a great closing of above the dangerous level of 35500 which is quite a bullish sign.
Now, the major(Yellow) and immediate(Blue) supports and resistance zones are give below. You can have a bullish view for tomorrow.
.
.
.
.
.
.
.
.
.
.
.
.
.
.
*Disclaimer*- This is just an analysis of the data on the basis of technical factors such as chart patterns, candlestick patterns, trend line , option chain data, etc,. Stock Market or Trading in any type of market is subject to high financial risk. You should see this idea as just an analysis. You are not obliged to follow my instructions. You will be responsible for all types gains or loses in the market.

Nifty Options Expiry Trade_210121Price action suggested a weakness in the index, hence continued to add more option selling at 14800 CE and bringing the hedge down from 14900 CE to 14850CE, thus reducing the risk in the trade and improving the risk-reward.
Gap up opening was a bit of a scare initially for the Call sold position, however there was no decisive upmove which was a saviour.

Nifty: Follow up on 1st week outlook viewNifty
CMP 14102
We had given a view on 1st Jan. This is in continuation of that view...
Nifty 13800 Put short Update
Suggested sell between 60-80
CMP 16
The position is active and is in profit.
Looking at the Options trade Data for January 01, 2021,
- Retail participants are looking more optimistic and
- FIIs and Proprietary traders are going preservative
(message in private to know more)
One may Consider adding a sell Call position
Strike Price : 14200 Call Option
CMP 46
The strategy is best suited for a range bound movement.
Disclaimer:
- The view expressed here is my personal view
- Past performance is not a guarantee for future predictions
- Use this for educational purpose
- Any decision you take, you need to take responsibility for the same
- It's your hard earned money. Treat it wisely
- Trade / Invest keeping in mind your trading style, goals and objectives, time horizon & risk tolerance
- if trading in F&O, understand that F&O trading involves risk
- Do take proper risk management measures
- Do your own analysis and consult your financial adviser if need be

Expiry Strategy: Sell 370 Call May @3.3 & Buy 380 Call May @ 1.7Trend is continued to be in consolidation phase between 310 and 400 levels. It wanders around 200 day EMA while MACD signals negative bias by staying below zero line. Expect it to stay below nearby resistance level of 370 till this expiry. As election result is on due, would like to adopt spread strategy. Lot size: 2667.

Expiry Strategy: Sell 290 Put @ 1.5It witnessed a turnaround by finding a breakout from recent consolidation. As well, MACD confirms the trend reversal. Expect it would expire above 290 level for this expiry. Due to low liquidity, advised to execute the transaction by placing a sell order @ 1.5.
HLong
