Expecting EurCHF bearish Why should we trust this idea 💡??Eur has 2.15% interest rate ,while chf is safe heaven currency so
it would shows always significant strength towards chf ,apart from that any Ongoing panic
global events will also cause CHF bullish with aligning the price action parameters by following liquidity 💲⚔️
Disclaimer: This is not any financial advice! Simulated idea 😉
Orderblocks

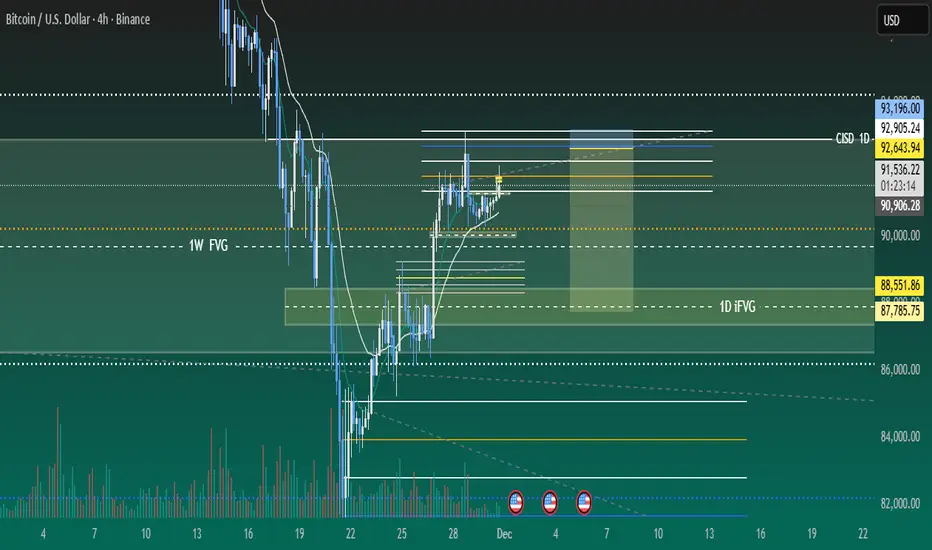
Weekly Analysis of BTC with Buy/Sell scenarios...BTC prediction of last week just worked perfectly well and market kept in consolidation mode itself. BTC is still in consolidation zone and may spend some more days. It may develop ABC pattern or reversal at identified daily FVG level, if price has to change its delivery and take turn from here. This zone is kind of make or break. If price is not able to sustain and breakdown, then it may witness ~65-70K levels as well.
We hope for reversal from this level as price is developing the pattern at higher time frame.
1. Price has taken liquidity or 82K and almost touched 80K.
2. It has inversed 1Day FVG and now price is consolidating in the range between EMAs.
3. We may expect price retracement till 1D iFVG and then reversal.
4. Before to that we may see sweep of 92900 (1D CISD) level and then a retracement short trade till 1D FVG
5. Most probably price will take liquidity of FVG/RDRB level and create MSS/CISD/TS/iFVG in LTF.
6. Price should show rejection/reversal in respective LTF (5m/15m) at FVG zone.
7. Take the trade only once clear entry model i.e. turtle soup. iFVG break, CDS or MSS happens on LTF
All these combinations are signaling a high probability and ~6R trade scenario.
Note – if you liked this analysis, please boost the idea so that other can also get benefit of it.
Also follow me for notification for incoming ideas.
Also Feel free to comment if you have any input to share.
Join me on live stream for real time update.
Disclaimer: This analysis is for educational purposes only and does not constitute investment advice. Please do your own research (DYOR) and check with your financial advisor before making any trading decisions.

Weekly Analysis BTC with Sell and Buy scenarios..Here is the weekly analysis of BTC including various topics of ICT, Price action etc.
Note – if you liked this analysis, please boost the idea so that other can also get benefit of it.
Also follow me for notification for incoming ideas.
Also Feel free to comment if you have any input to share.
Join me on live stream for real time update.
Disclaimer: This analysis is for educational purposes only and does not constitute investment advice. Please do your own research (DYOR) and check with your financial advisor before making any trading decisions.

Weekly Analysis of Nifty.....This is the weekly analysis of Nifty covering various topics of ICT, Price action.. Please do watch and repeat watch to learn these...
Note – if you liked this analysis, please boost the idea so that other can also get benefit of it.
Also follow me for notification for incoming ideas.
Also Feel free to comment if you have any input to share.
Join me on live stream for real time update.
Disclaimer: This analysis is for educational purposes only and does not constitute investment advice. Please do your own research (DYOR) and check with your financial advisor before making any trading decisions.

Weekly analysis Gold Multi RnR sell and Buy scenarioThis is weekly analysis of gold providing detailed analysis and educational topics i.e. ICT, Price action, support and resistance etc.
Note – if you liked this analysis, please boost the idea so that other can also get benefit of it.
Also follow me for notification for incoming ideas.
Also Feel free to comment if you have any input to share.
Join me on live stream for real time update.
Disclaimer: This analysis is for educational purposes only and does not constitute investment advice. Please do your own research (DYOR) and check with your financial advisor before making any trading decisions.

Weekly analysis BTC with high RnR scenariosBTC is now in consolidation zone and may spend some more days. It may also develop ABC pattern or reversal at daily level, if price has to change its delivery and take turn from here. This zone is kind of make or break. If price is not able to sustain and breakdown, then it may witness ~65-70K levels as well.
We hope for reversal from this level as price is developing the pattern at higher time frame.
1. Price has taken liquidity or 82K and almost touched 80K.
2. It has inversed 1Day FVG and now price is consolidating in the range between EMAs.
3. We may expect price retracement till 1D iFVG and then reversal.
4. Before to that we may see sweep of 92900 (1D CISD) level and then a retracement short trade till 1D FVG
5. Most probably price will take liquidity of FVG/RDRB level and create MSS/CISD/TS/iFVG in LTF.
6. Price should show rejection/reversal in respective LTF (5m/15m) at FVG zone.
7. Take the trade only once clear entry model i.e. turtle soup. iFVG break, CDS or MSS happens on LTF
All these combinations are signalling a high probability and high RnR trade scenario.
Note – if you liked this analysis, please boost the idea so that other can also get benefit of it.
Also follow me for notification for incoming ideas.
Also Feel free to comment if you have any input to share.
Join me on live stream for real time update.
Disclaimer: This analysis is for educational purposes only and does not constitute investment advice. Please do your own research (DYOR) and check with your financial advisor before making any trading decisions.
Weekly Gold analysis & 8R scenarioLast week gold closed positively with a strong candle showing positivity and approaching to a strong 4H FVG nested inside weekly quadrant level and making cluster. We may see both buying and selling scenarios.
Gold has also broken 4H trend line and retested it. So we can see a possible move till FVG.
We may also witness a breakout if price violates FVG and breaks all time high with strong volume support.
1. Price is creating higher highs in micro structure level and approaching towards 4hours FVG after breaking and retesting trend line at 4 Hours.
2. Trend line breakout is supported by strong volume.
3. Price is continuously running above EMAs confirming up move for now.
4. We may see a reversal scenario at 4 hour FVG level.
5. Most probably price will take liquidity of FVG/RDRB level and create MSS/CISD/TS/iFVG in LTF.
6. Price should show rejection/reversal in respective LTF (1h/15m) at FVG zone.
7. Take the trade only once clear entry model i.e. turtle soup. iFVG break, CDS or MSS happens on LTF
All these combinations are signalling a high probability and ~8R trade scenario.
Note – if you liked this analysis, please boost the idea so that other can also get benefit of it.
Also follow me for notification for incoming ideas.
Also Feel free to comment if you have any input to share.
Join me on live stream for real time update.
Disclaimer: This analysis is for educational purposes only and does not constitute investment advice. Please do your own research (DYOR) and check with your financial advisor before making any trading decisions.

Smart Money Liquidity Trap Explained⭐ Smart Money Liquidity Trap Explained
✨ A deep dive into how institutions manipulate price before major moves ✨
In every financial market — Forex, Crypto, Stocks, Indices — price doesn’t simply move at random. Behind the scenes, Smart Money (institutions, banks, hedge funds) engineer setups that allow them to enter positions at the best possible price. One of their most effective tools is the Liquidity Trap.
Let’s break it down beautifully and clearly. 👇
🔥 What Is a Liquidity Trap?
A Liquidity Trap occurs when Smart Money deliberately pushes price into areas loaded with:
❌ Stop-loss orders
📉 Sell-side liquidity
📈 Buy-side liquidity
😰 Emotional retail entries
🔥 Breakout traders placing pending orders
These areas become liquidity pools — perfect fuel for institutions to fill their massive positions.
Retail traders think it’s a breakout…
But Smart Money thinks:
➡️ "Thank you for the liquidity."
🧩 How Smart Money Creates the Trap
1️⃣ Phase 1: Build the Setup
Smart Money guides price slowly toward an obvious level:
A clean high
A clean low
A trendline
A double top/bottom
Retail traders get excited:
📢 “Breakout coming!”
But institutions are simply gathering attention.
2️⃣ Phase 2: The Liquidity Grab ⚡
Price spikes violently above/below the obvious level.
This move triggers:
🟥 Stop-loss hunts
📉 Forced liquidations
💥 Breakouts that fail instantly
This sudden spike gives institutions the liquidity needed to place large buy or sell orders without causing massive slippage.
This is why the spike is often fast and dramatic.
3️⃣ Phase 3: The Real Move Begins 🚀
After the liquidity is collected, price reverses sharply.
This is the moment Smart Money actually commits to the real direction.
Retail traders feel:
🤯 “Why did it reverse?!”
😭 “I got stopped out for nothing!”
😵 “The breakout was fake!”
But Smart Money simply executed their strategy perfectly.
🎯 How to Use Liquidity Traps in Your Trading
Study where retail traders commonly place:
⛔ Stops
📌 Breakout orders
❗ Predictable entries
Then wait for the fast liquidity grab followed by:
A displacement 🎇
A sharp wick rejection
A structure shift (CHoCH / BOS)
These signals often reveal the true direction of the upcoming move.
💡 Key Features of a Smart Money Liquidity Trap
✨ Sudden spike into obvious areas
✨ Fast liquidation and stop-hunting behavior
✨ Sharp wick rejections
✨ Structure shift after the spike
✨ Smooth continuation in the real direction
🚀 Why This Concept Is So Powerful
Recognizing liquidity traps allows you to:
❌ Avoid fake breakouts
🛡️ Protect yourself from stop-hunts
🎯 Enter the market at premium/discount levels
🤝 Align with Smart Money
💼 Improve long-term consistency
This is how professional traders stay on the right side of volatility — by understanding why the market moves, not just where it moves.

BTC strong down trend and high RnR sell scenario..BTC is in strong down trend and broke ~ 90K level and targeting further downside levels of 82K and 75K. Price is continuously forming lower highs and BoS. Price has formed a BOS on hourly chart and approaching 1h FVG. We may expect a rejection pattern in LTF inside FVG and further downfall.
1. Price is in strong down trend and formed 1H FVG after creating BOS.
2. FVG is formed on weekly quadrant level, making it more significant,
3. Price is now approaching FVG
4. Most probably price will take liquidity of FVG/RDRB level and create MSS/CISD/TS/iFVG in LTF.
5. Price should show rejection/reversal in respective LTF (5m/15m) at FVG zone.
6. Take the trade only once clear entry model i.e. turtle soup. iFVG break, CDS or MSS happens on LTF
All these combinations are signalling a high probability and ~8R trade scenario.
Note – if you liked this analysis, please boost the idea so that other can also get benefit of it.
Also follow me for notification for incoming ideas.
Also Feel free to comment if you have any input to share.
Join me on live stream for real time update.
Disclaimer: This analysis is for educational purposes only and does not constitute investment advice. Please do your own research (DYOR) and check with your financial advisor before making any trading decisions.

Gold/XAUSSD weekly analysis and possible sell/buy scenarios....Currently gold is showing pressure and generating sell signals. There are multiple sell opportunities developed in Gold in different time frames. And we can anticipate couple of opportunities out of these will trigger. Gold has already created CISD on HTF and tested daily FVG and changed delivery and showing down fall in price. There is already one sell scenario executed. And we can see few more in coming week.
1. Price has already changed delivery in daily time frame and tasted daily FVG and price is falling now.
2. Currently price is holding at daily FVG and we may see slight pull back around the levels of 424152 & 4205 and then further fall till ~3888 level.
3. We can see another higher probability sell scenario at 4300 level if aforementioned levels are breached.
4. RSI is also showing sell side pressure, giving another confluence.
5. Most probably price will take liquidity of FVG/RDRB level and create MSS/CISD/TS/iFVG in LTF.
6. Price should show rejection/reversal in respective LTF (1h/15m) at FVG zone.
7. Take the trade only once clear entry model i.e. turtle soup. iFVG break, CDS or MSS happens on LTF
All these combinations are signalling a high probability and ~10R trade scenario.
Note – if you liked this analysis, please boost the idea so that other can also get benefit of it.
Also follow me for notification for incoming ideas.
Also Feel free to comment if you have any input to share.
Join me on live stream for real time update.
Disclaimer: This analysis is for educational purposes only and does not constitute investment advice. Please do your own research (DYOR) and check with your financial advisor before making any trading decisions.

BTC Weekly analysis and sell/Buy scenarios....BTC moved as per our plan throughout last week more than 13K points so far, and still in down trend. Price is continuously creating BOSs and moving toward our target of 90K. Meanwhile during sniper delivery, it has created some pull back zones, which can be tested before reaching to our target. So we have few possible multi RnR trades scenarios before seeing possible reversal.
1. Sniper deliver is already done and price is pulling back slowly.
2. We may see possible pullback sell trade opportunity around 100K and 103.5k levels.
3. RSI is also showing sell side pressure, giving another confluence.
4. Most probably price will take liquidity of FVG/RDRB level and create MSS/CISD/TS/iFVG in LTF.
5. Price should show rejection/reversal in respective LTF (5m/15m) at FVG zone.
6. Take the trade only once clear entry model i.e. turtle soup. iFVG break, CDS or MSS happens on LTF
All these combinations are signalling a high probability and ~7R trade scenario.
Note – if you liked this analysis, please boost the idea so that other can also get benefit of it.
Also follow me for notification for incoming ideas.
Also Feel free to comment if you have any input to share.
Disclaimer: This analysis is for educational purposes only and does not constitute investment advice. Please do your own research (DYOR) and check with your financial advisor before making any trading decisions.

Order Blocks Simplified — How Institutions Control Price🔥 Order Blocks Simplified — How Institutions Control Price
Order Blocks are one of the most important concepts in modern trading — because they show where institutions place REAL positions, not where retail traders guess. 🏦📊
When you understand Order Blocks, you stop chasing random candles and start reading the footprints of smart money. Let’s simplify it. 👇✨
📌 What Is an Order Block? 🧱💰
An Order Block (OB) is a price zone where big institutions (banks, hedge funds, market makers) place massive orders.
These zones often appear before strong market moves — because that’s where smart money builds positions.
Think of an Order Block as:
🔹 The origin of a powerful move
🔹 A zone where price reacts repeatedly
🔹 A region that creates imbalance and momentum
🔹 A point where institutional orders remain unfilled
Once price returns to that zone, institutions fill the rest of their orders, causing another strong reaction. ⚡📈📉
📌 Why Do Order Blocks Matter? 🧠🔥
Because institutions control 80%+ of market volume — not retail.
So when they accumulate or distribute positions:
📈 Trends are born
📉 Reversals appear
🌊 Momentum shifts
💥 Big candles print
Order Blocks give you insight into:
✔️ Where big players enter
✔️ Where real support/resistance exists
✔️ Why price reverses at specific zones
✔️ Where high-probability trades form
It’s the closest thing to tracking the “big money blueprint.”
📌 How Order Blocks Form 🛠️📊
Order Blocks are created during periods of:
🔸 Accumulation (smart money buys quietly)
🔸 Distribution (smart money sells quietly)
Then price explodes away from that zone, showing that a major order cluster was executed.
This explosive move creates:
🔥 Imbalance (FVG)
🔥 Break of structure (BOS)
🔥 A directional trend
These are all signs of institutional activity.
📌 Types of Order Blocks 🟥🟩
🟥 Bearish Order Block (B-OB)
The last bullish candle before a strong bearish move.
It marks institutional selling.
🟩 Bullish Order Block (B-OB)
The last bearish candle before a strong bullish move.
It marks institutional buying.
Both act as high-probability reaction zones.
📌 How Institutions Use Order Blocks 🎯🏦
Institutions don’t enter all at once — their orders are too large.
So they:
1️⃣ Place part of their order
2️⃣ Push price away
3️⃣ Wait for retracement
4️⃣ Fill the rest at the same zone
That zone = the Order Block.
Price returning to an OB is not random — it’s smart money completing their business. 💼✨
📌 How You Trade Order Blocks 🧘♂️📈
✔️ Identify the strong move
Big displacement = institutional interest. 🚀
✔️ Mark the Order Block candle
The last opposite candle before the move. 🔍
✔️ Wait for price to return
Smart money loves to rebalance orders. 🔁
✔️ Enter with confirmation
Candles + structure + reaction = high probability. 🎯
Order Blocks are not predictions — they are reaction zones with a smart-money edge.
📌 Why Order Blocks Work So Well 🌟
Because they are built on:
💧 Liquidity
🧠 Smart Money Behavior
📊 Market Structure
⚡ Supply & Demand
🔥 Institutional Order Flow
This is why OBs outperform classic support/resistance.
They show institutional reality, not retail imagination.
✨ Final Thoughts: The Power of Order Blocks 🚀
Once you learn Order Blocks, everything becomes clearer:
✔️ You know where big money enters
✔️ You know where to wait for price
✔️ You stop chasing bad trades
✔️ You trade WITH smart money
✔️ You catch cleaner, stronger moves
Order Blocks are the foundation of modern price action — simple, powerful, and deeply effective. 🔥📈
BTC is forming a 3R sell scenario.....BTC is in downtrend in daily timeframe and shown sniper delivery, now it is in pullback mode. We may anticipate a good short term trade around 102000 RDRB level
1. Price is continuously crating BOSs..
2. Sniper deliver is already done and price is pulling back slowly.
3. RSI has already shown bearish divergence on hourly TF.
4. Most probably price will take liquidity of FVG/RDRB level and create MSS/CISD/TS/iFVG in LTF.
5. Price should show rejection/reversal in respective LTF (5m/15m) at FVG zone.
6. Take the trade only once clear entry model i.e. turtle soup. iFVG break, CDS or MSS happens on LTF
All these combinations are signalling a high probability and ~8R trade scenario.
Note – if you liked this analysis, please boost the idea so that other can also get benefit of it.
Also follow me for notification for incoming ideas.
Also Feel free to comment if you have any input to share.
Disclaimer: This analysis is for educational purposes only and does not constitute investment advice. Please do your own research (DYOR) and check with your financial advisor before making any trading decisions.

Axis bank is forming a good buy scenario.Axis Bank is in slow selling for weeks after a strong rally and now forming a bullish scenario.
It is taking reversal from protection trendline and braking out bearish trendline.
It is also taking support from daily order block.
it is also taking rejection from 21 EMA
All other Higher duration EMAs are synced in upside direction.
Rejection point is forming a cluster of multiple parameters .
All these in combination making it an attractive buying scenario....
Note – if you liked this analysis, please boost the idea so that other can also get benefit of it.
Also follow me for notification for incoming ideas.
Also Feel free to comment if you have any input to share.
Disclaimer: This analysis is for educational purposes only and does not constitute investment advice. Please do your own research (DYOR) and check with your financial advisor before making any trading decisions.

BTC 8R Sell scenario.........BTC is in downtrend in daily timeframe and shown sniper delivery, now it is in pullback mode. We may anticipate a good short term trade on hourly time frame around hourly FVG
1. HTF MSS is already done and price is reverting to FVG after BOS.
2. Daily quadrant cluster is also falling around FVG. Which is giving us some more critical levels of price reversal.
3. RSI has already shown bearish divergence on hourly TF.
4. Most probably price will take liquidity of FVG and create MSS/CISD/TS/iFVG in LTF.
5. Price should show rejection/reversal in respective LTF (5m/15m) at FVG zone.
6. Take the trade only once clear entry model i.e. turtle soup. iFVG break, CDS or MSS happens on LTF
All these combinations are signalling a high probability and ~8R trade scenario.
Note – if you liked this analysis, please boost the idea so that other can also get benefit of it.
Also follow me for notification for incoming ideas.
Also Feel free to comment if you have any input to share.
Disclaimer – This analysis is just for education purpose not any trading suggestion. Please take the trade at your own risk and with the discussion with your financial advisor.

Kotak buying scenario........Kotak Mahindra Bank is forming a wonderful scenario in buying side. It is ranging between trend lines for long time and now taking a reversal after a pullback. Below conditions are reflecting the situation of smart money to jump in…….
1. After pullback it is respecting cluster of 50/100 and 200 SMA and formed a rejection candle.
2. There is a daily FVG nested in OB, which is also being respected.
3. RSI is also at mid-level and showing a reversal..
4. We may see some choppy kind of situation for few days and later breakout.
Note – if you liked this analysis, please boost the idea so that other can also get benefit of it.
Also follow me for notification for incoming ideas.
Also Feel free to comment if you have any input to share.
Disclaimer – This analysis is just for education purpose not any trading suggestion. Please take the trade at your own risk and with the discussion with your financial advisor.

Weekly & Daily BTC analysis of 10R Opportunity........On HTF weekly and daily BTC is forming good scenarios for bearish trade. Price is consolidating at higher levels for last couple of weeks and showing value adjustment in BTC. Price already shot up a lot and we may see a short term pull back.
1. BTC has created CISD after taking liquidity at weekly level and tested weekly iFVG.
2. It has also created 1D FVG and 4H FVG and iFVG over lapping. creating cluster of CEs. Which might be a Good POI for sell side opportunity.
3. Technically we are already into a weekly down side scenario. Further price is approaching Daily and 4 Hourly FVGs for possible re-entry opportunities.
4. RSI has also already shown a bearish divergence on weekly level.
5. Most probably price will take liquidity of FVG and create MSS/CISD/TS/iFVG in LTF.
6. Price should show rejection/reversal in respective LTF (1H/15m) at FVG zone.
7. Take the trade only once clear entry model i.e. turtle soup. iFVG break, CDS or MSS happens on LTF
All these combinations are signalling a high probability and ~10R trade scenario.
Note – if you liked this analysis, please boost the idea so that other can also get benefit of it. Also follow me for notification for incoming ideas.
Also Feel free to comment if you have any input to share.
Disclaimer – This analysis is just for education purpose not any trading suggestion. Please take the trade at your own risk and with the discussion with your financial advisor.

BTC forming wonderful scenarioBTC is forming good scenarios for bullish and subsequently bearish trade. It has created ABC pattern and retracing back to bullish FVG. We need to wait for price getting into right zones. We may also see a sell side trade once reaches to bearish FVG.
1. Currently price has broken ABC pattern neckline and retracing towards 1h FVG.
2. We may also see a sell side trade once price tap into bearish FVG and shows reversal pattern.
3. Most probably price will take liquidity of FVG and create MSS/CISD/TS/iFVG in LTF.
4. Price should show rejection/reversal in LTF (5m,1m) at FVG zone.
5. Take the trade only once clear entry model i.e. turtle soup. iFVG break, CDS or MSS happens on LTF
All these combinations are signalling a high probability and ~4R trade scenario.
Note – if you liked this analysis, please boost the idea so that other can also get benefit of it. Also follow me for notification for incoming ideas.
Also Feel free to comment if you have any input to share.
Disclaimer – This analysis is just for education purpose not any trading suggestion. Please take the trade at your own risk and with the discussion with your financial advisor.

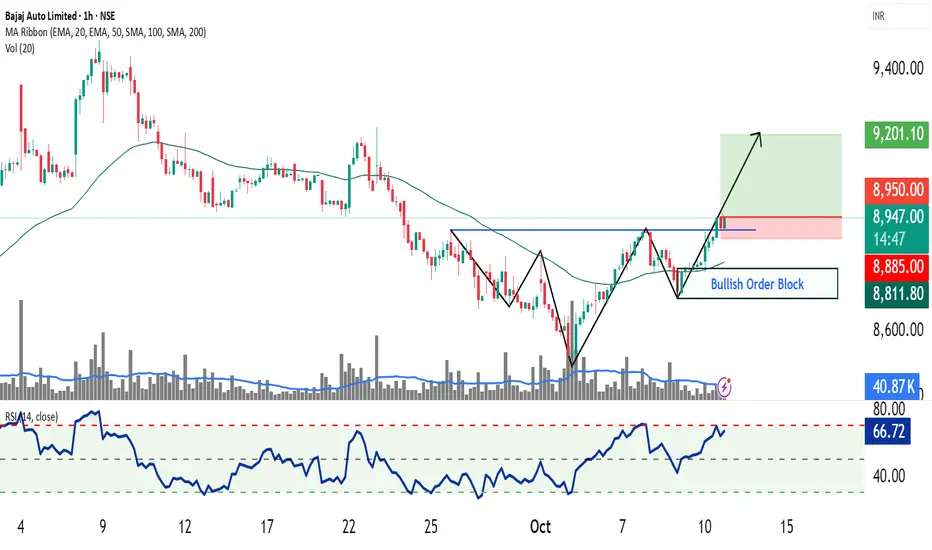
Bajaj Auto – Bullish head and shoulder breakout📈 Pattern Analysis: Bajaj Auto has successfully completed a Bullish Head and Shoulders pattern on the chart, followed by a clean breakout and subsequent retest, confirming the validity of the formation. The price action now awaits a pivot breakout, which would trigger the next leg of upside momentum.
📊 Trading Strategy:
Two distinct trading approaches can be considered based on trader type:
1. Retail Concept Strategy:
Enter long above the pivot high once price breaks decisively.
Place stop-loss below the breakout candle, ensuring a safer entry with confirmation.
Note: The risk–reward ratio is less favorable if the SL is kept below the right shoulder in classical style.
2. Smart Money Strategy:
Enter on retrace to the order block area positioned just above the right shoulder.
This offers a superior risk–reward entry aligned with institutional-style trading concepts.
🔎 Indicators & Trend:
50 EMA is sloping upward on the hourly timeframe, confirming short-term uptrend strength.
RSI > 65, indicating sustained bullish momentum with potential for continuation.
🎯 Target Projection:
Targets will be determined using the measurement rule, projecting the height of the head added to the neckline breakout zone.
⚠️ Disclaimer:
This analysis is prepared only for educational and training purposes. It does not constitute investment advice or a trading recommendation.
✍️ Prepared by: SEBI Certified Research Analyst (Not Registered)
Beautiful 6R BTC trade scenariosBTC is forming both buy and sell side trades as the price is in critical zone. BTC will possibly give us both side good trades. We need to wait for price getting into right zones.
1. Currently price is moving around daily and 4H gradient levels.
2. 125275 level is creating a gradient cluster of both 1d and 4h time frame. Which may give us a good sell side trade if price show clear reversal signals.
3. There is an 1hour iFVG if price takes liquidity of it, most probably it will touch gradient cluster level and good sell scenario may be confirmed.
4. There are several SIBIs which may be target for it and further buy side reversal trade.
5. Buy side reversal trade may be good trade as overall BTC order flow is upside.
6. Most probably price will take liquidity of FVGs and create MSS/CISD/TS/iFVG in LTF.
7. Price should show rejection/reversal in LTF (5m,1m) at FVG zone.
All these combinations are signalling a high probability and 5.5R trade scenario.
Note – if you liked this analysis, please boost the idea so that other can also get benefit of it. Also follow me for notification for incoming ideas.
Also Feel free to comment if you have any input to share.
Disclaimer – This analysis is just for education purpose not any trading suggestion. Please take the trade at your own risk and with the discussion with your financial advisor.

BTCUSD 3R Sell side trade BTCUSD is forming sell side trade as current bias and draw on liquidity both are at down side. Price has also left SIBIs to attract price upside for a while and then return back to target. In weekend price may have low volatility and trade possibly generate on Monday or later.
1. There is a 4H time frame bearish FVG.
2. There is bearish FVG in 1H and 30m overlapping with 4H FVG. Now price is approaching it slowly.
3. These FVGs are forming inside Fib golden zone.
4. Order flow is bearish. And draw on liquidity is also at downside.
5. Most probably price will take liquidity of FVGs and create MSS/CISD/TS/iFVG in LTF.
6. Price should show rejection/reversal in LTF (5m,1m) at FVG zone.
All these combinations are signalling a high probability and 3R trade scenario.
Note – if you liked this analysis, please boost the idea so that other can also get benefit of it. Also follow me for notification for incoming ideas.
Also Feel free to comment if you have any input to share.
Disclaimer – This analysis is just for education purpose not any trading suggestion. Please take the trade at your own risk and with the discussion with your financial advisor.

USDJPY Sell entry 1::5 RnRUSDJPY is forming a beautiful day trade for selling side. It can be a very good intraday trade if everything goes as per plan.
1. Price kissed 4H Iceberg Block and showed sniper liquidity and left bearish FVGs at both 30m and 15m.
2. 15m FVG is inside 30m FVG and upper side of OTE area.
3. Now it is moving toward FVG areas after taking reversal from bullish 15m BPR
4. Most probably price will take liquidity of FVG and OTE zone and create MSS in LTF.
5. Order flow confirming bearish bias.
6. Price should show rejection/reversal in LTF (5m,1m) at FVG zone.
All these combinations are signalling a high probability and high Risk and Reward (1:5) trade scenario.
Note – if you liked this analysis, please boost the idea so that other can also get benefit of it. Also follow me for notification for incoming ideas.
Also Feel free to comment if you have any input to share.
Disclaimer – This analysis is just for education purpose not any trading suggestion. Please take the trade at your own risk and with the discussion with your financial advisor.

Gold (XAUUSD) 1:4 intraday buy scenario.Gold is in up move and forming a good buy scenario on 30/15-minute chart. It can be a very good intraday trade if everything goes as per plan.
1. 30/15m bullish FVG is pending and price is showing pull back towards it.
2. Most probably price will take liquidity of FVG and OTE zone and create MSS in LTF.
3. Order flow confirming bullish bias.
4. Price should show rejection/reversal in LTF at FVG zone.
All these combinations are signalling a high probability and high Risk and Reward (1:4) trade scenario.
Note – if you liked this analysis, please boost the idea so that other can also get benefit of it. Also follow me for notification for incoming ideas.
Also Feel free to comment if you have any input to share.
Disclaimer – This analysis is just for education purpose not any trading suggestion. Please take the trade at your own risk and with the discussion with your financial advisor.
