rsirsi 10 x 21 crossover
still nifty in short term bear market until it breaks the above Trendline and sustain.
Better to avoid longs
Oscillators

RSI Divergence+ve Divergence in Infosys chart as you can see Higher low in RSI but Price is still at same level

BSE CMP 900 dated 29-4-2022 FALLING WEDGE BOBSE CMP 900 dated 29-4-2022
1. Falling Wedge BO @ 870
2. Volume Surge.
3. RSI On BO
Buy for a tgt of 1015 SL 850
It is just a view, pls trade at your own risk.

TATASTEEL LongLets wait and see if NSE:TATASTEEL can give an inverted Head and Shoulders Pattern breakout with rising RSI, price staying above 200 DMA and Bullish MACD crossover and line crosses above the zero line.
Buy when Day close Above with Volume: 1275
SL: 1150
Target: 1400
Disclaimer: For learning purpose only. I am not a SEBI registered analyst and not responsible for your profit or loss. Please consult your financial advisor before trading.

#VARROC VARROC looking bullish
volumes and chart pattern indicating good sign for further movement.
Consolidation breakout from zone.
Closing above 460 will be confirmation.
Need to hold his highs selling pressure is high in upward levels.
Can reach 510- 530 targets above that next Resistance at 570 .
Keep on radar.
-Gaurav
@Vivek-
@RAKESHBANSAL
@vijaythakkar009
@ExtremeVolume
@TheBreakOut @forextidings @Vivek- @investing @Tredingview

TV18 Broadcast Cmp 72.45 dated 26-4-2022 STRONG BUYTV18 Broadcast Cmp 72.45 dated 26-4-2022
1. Bullish Engulfing Candle made.
2. Volume Surge.
3. RSI Divergence.
Buy for a tgt of 78-82-88-92-107 SL 67
It is just a view, pls trade at your own risk.

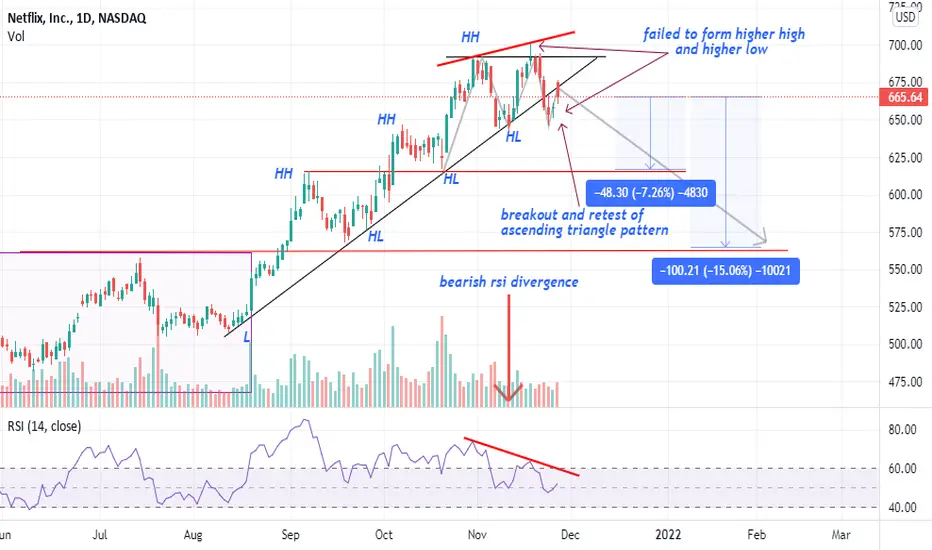
Netflix can plunge upto ''15%''Hi Traders / Investors ,
Netflix can fall upto 560 levels from 665 levels upto maximum of 100 points because of following reasons based on technical analysis.
1) Breakout and retest of Ascending triangle pattern and Uptrend .
2) Failed to form Higher High and Higher Low.
3) Formation of Bearish RSI Divergence.
It can fall upto 615 level which can be target no.1 and 560 level can be target no. 2 , if target no.1 breaches then we can look for target no .2.
This is just an analysis so please don't take any decisions solely on this basis.
Please give thumbs up if liked this analysis , as it requires deep research.

Daawat pattern buy opportunity - short termCup and handle setup
Could buy with SL close below 85
PA to watch.

Vinati Organic Cmp 2203 dated 22-4-2022 STRONG BUYVinati Organic Cmp 2203 dated 22-4-2022
1. Rectangle Consolidation BO @ 2204
2. RSI already given BO.
3. VOlume surge
Buy for a tgt of 2680 SL 2050
It is just a view, pls trade at your own risk.

'Verse' of 'Reverse' Candlestick Pattern-> Definition of Reversal patterns :-
Reversal patterns mean the formation of candlesticks which indicate the end of the existing trend (uptrend or downtrend). When such formation appears in a downtrend, it indicates a bullish reversal or end of selling spree and onset of buying spell. Conversely, when a trend reversal pattern forms in an uptrend, it warns traders of a possible end to bullish run and onset of a slump.
Candlestick patterns are visual patterns, helping traders to visualize when market sentiment is shifting, which is why many traders prefer candlestick charts over other trading tools. However, any trend reversal indication must conform with other popular technical trading tools.
-> Engulfing Patterns :-
An engulfing pattern is a two-candle formation that signals trend reversal, and hence, there are bullish engulfing and bearish engulfing.
The bearish engulfing happens in the uptrend. The first candle is a white/green candle that forms in the uptrend. The second candle opens higher than the previous session and then closes below the previous. It indicates that the bullish force made a final thrust before bearish forces took over.
The opposite of bearish engulfing is bullish engulfing, and it appears at the bottom of a downtrend.
->Doji :-
Doji is a unique formation – a candle with no real-body but with shadows. Doji can take many forms like Doji Star, Dragonfly Doji, Gravestone Doji, Long-legged Doji, and more.
It is often associated with market indecision before a trend reversal. Apart from Doji star, Dragonfly Doji and Gravestone Doji also indicate a trend reversal; but to base your trading decisions on them, those must concur with other popular trading tools like moving average, RSI, or moving oscillator.
Doji formations often have no real-body, means that the opening and closing price is almost the same, or the market has reached an equilibrium where neither the buying not the selling strengths are strong enough to give it a direction.
-> Abandoned Baby :-
Apparently, an abandoned baby is a more decisive trend reversal pattern than Doji. It is a rare formation, but when it appears, it is a strong enough indication for traders to alter their position accordingly.
Since it is a trend reversal pattern, an abandoned baby can appear in both uptrend or downtrend. An abandoned baby is a Doji star that appears between two candles – the first one appearing in the direction of the trend and the second confirmation candle appearing in the reversed trend, either bullish or bearish. The shadow of the first candle mustn’t overlap the second candle. The star appears above or below the trend, looking abandoned, hence the moniker.
-> Hammer Pattern :-
Hammer is a single candle pattern that appears in a downtrend implying a trend reversal to bullish. It usually has a small real-body and a long downward shadow. It indicates that the market fished for the bottom but eventually buying forces were strong to push the market up – the result is a bullish or green candle comprising a short real-body. The candle appearing next to the hammer must confirm the trend reversal to form a trading strategy. It must close above the last candle formed before the hammer.
The opposite formation of a hammer, an inverted hammer which appears in an uptrend, is also a trend reversal pattern. In this case, the color of the hammer doesn’t matter, but the upper shadow is twice the size of its real body. An inverted hammer requires stronger confirmation candles to ascertain trend reversal.
Another similar formation that appears in the candlestick chart is called a hanging man. It is a hammer that appears in uptrend. When the hanging man appears after a rally, it indicates a trend reversal. It needs further confirmation from the following candles appearing in the trendline. If those appearing in a downtrend, the hanging man confirms a downward trend reversal.
-> Piercing Line :-
A piercing line is a two-candle formation – a bearish long-bodied candle and another bullish candle which opens at a gap and closes at the midway of the bearish candle. Both candles have robust long bodies. It shows that the market started in bearish impulse, but eventually, buyers gained momentum to pull the market up and reserve their position.
-> Harami Pattern :-
Harami patterns are common and can be both bullish harami and bearish harami. In Japanese, the word translates to pregnant. It is a two-candle formation where the second candle is a small-bodied candle that opens and closes within the body of the first candle, representing a pregnant form. In the case of Harami Cross, the second candle is a Doji star.
A Harami is a reversal pattern, but it isn’t as strong as the hammer and needs confirmation from other technical trading tools like RSI, MACD, and the like.
My OBSERVATION :- These reversal patterns works very well when used with RSI, In case of indices, when RSI is above 65 or below 35 any such pattern visible indicates reversal and In case of stocks, when RSI is above 70 or below 40 any such pattern visible indicates reversal.

After a one sided move BIOCON is losing its momentum.INTRADAY SHORT OPPORTUNITY. - BIOCON
- After a parabolic move a doji and a red Candle at major resistance. With a Divergence in shorter time frame.
Good Shorting opportunity.
Please share your views in Comments.
THANKYOU.

Intraday Trade For 21-4-22Intraday Trade in Sail.
- Falling wedge pattern with major support.
- Divergence at lower timeframe indicates breakout.
- For safer side take the entry after Breakkout.
- Aggressive trader take trade at conversion point also as there is 2 confirmations(major support and Bullish divergence).
Thankyou.

Nestle India - RSI DivergenceNestle India is showing a RSI Divergence and good upward trend. Targets are as mentioned on the charts.
This is for educational purpose only.
Let me know your thoughts in the comments section.

SHAREINDIA Rising in Silence !!!!As the title states , SHAREINDIA has steadily shown a breakout
of cup and handle pattern with accumulating volume without
facing much resistance at its neckline.
RSI is also showing a uptrend with higher highs again
a positive signal.
MACD is also maintaining its strength.

Thermax Cmp 2230 dated 13-4-2022 H&S PatternThermax Cmp 2230 dated 13-4-2022
1. Inverted H&S Pattern on daily chart BO @
2165
2. Volume Surge.
3. RSI Triangle BO
Buy for a Tgt of 2650 SL 2100
Try to buy in dips.
It is just a view, pls trade at your own risk.

ITC - The Rise....ITC the 'rising giant' is showing its heroic move with very
much similarity as the 'Puspha' character, who was misunderstood in the
movie as inefficient man and same here 'ITC' was assumed as slow mover but
now it has changed everyone mindset with a strong move.
ITC has formed rising three method pattern in daily charts after a breakout
which is a positive signal.
ITC has given a weekly breakout above 263 which was a strong resistance.
Both RSI and MACD supporting the up move .
Weekly RSI :-
Daily RSI :-
Though ITC is trading in a channel but it seems that this time it could
break the channel.
#Enjoy_trading

Nifty 50 formed {Head & sholder}Time frame :- 15m
Stock :- Nifty 50
Indicator :- RSI & Price action
View :- Bearish
Just for education.
Not for coll.

💎 API3USDT : 182% Profit Potential in Next 6 Months💣💣💣💣last 2-3 weeks we seen huge buying in API3 coin, in upcoming months its going pump very hard.
entry and targets are given on the chart. Please Like and comment if there are any queries.

TATASTEEL-> Symmetrical Triangle Pattern Breakout.
-> Price at retest of trendline.
-> RSI Indicating Bullish Hidden Divergence. (Trend Continuation)

Exideind ,elliot wave, fib extelliot wave analysis. 3rd wave may started in exideind target can be 176 178 and 5th wave target -184-86

Bandhan Bank at Very Strong SupportAnalysis:
1) Currently RSI has converged with the stock, forming higher lows while stock has formed lower lows. It is considered as strongly bullish.
2) Stock is at very strong support from which it has previously broke corresponding resistances.
Target and SL will updated on confirmation.
Disclaimer: These analysis are only for educational purposes only. You are responsible for your own actions.

Nifty short term studyAll charting looks obvious once the day is over...
1. upward channel
2. bounce from bottom
3. oscillator + ma positive indication
4. range break and retest
