BTC/USDT STRUCTUREBTC is bullish short term.
But we don’t buy at highs.
If price dips near 68k and shows strong bounce, we look for longs targeting 69.5k and possibly 70.5k+
Buy from discount — not from the top.
Community ideas

Banknifty structure updateBankNifty looks weak intraday
If price pulls back near 60,700 and shows rejection, we look for shorts.
Main target below 60,000.
We sell from supply, not from the middle.
Short on Retracement into 60,650–60,800 Supply
Execution Model:
Allow small pullback toward 60,650–60,800.
Wait for 5m CHoCH confirming rejection.
Stop Loss:
Above 60,950
Targets:
TP1: 60,000
TP2: 59,750

Sensex structure updateSENSEX is still bearish overall.
If price pushes back near 84,000 and shows weakness, we look for shorts.
Targets below 82,400 and possibly 81,000.
We sell from premium — not from the middle.

Linde - At ResistanceLinde :
Rectangle Breakout done, retested and broke out
Currently at strong resistance
Looks good above 7100 for possible quick 5 percent move

Gold Late-Session Trading Strategy | February 13✅ 4H Trend Analysis
● Price previously broke below the 5000 level and dropped to a low of 4878, forming a structural breakdown.
● It then rebounded quickly and has now moved back above 5000.
● Currently, price is trading below MA10 and near MA20, with the moving averages beginning to converge.
● The Bollinger middle band (around 5030–5050) is acting as a key resistance zone.
📌 4H Conclusion:
● This is not a trend reversal, but rather a technical recovery following the breakdown.
● As long as price fails to hold firmly above 5050, the current move should still be viewed as a rebound within a corrective structure.
✅ 1H Trend Analysis
● On the 1-hour timeframe, price has formed a continuous rebound from the 4878 low, with both higher highs and higher lows developing.
● The moving averages have realigned into a bullish structure, indicating stronger short-term momentum.
● Price is currently approaching the 5010–5030 resistance zone.
● If price breaks above 5030, it may continue higher to test the 5050–5070 region.
📌 1H Conclusion:
The short-term rebound is continuing, but it is approaching strong resistance from the 4-hour timeframe.
🔴 Resistance
● 5030–5050 (4H middle band resistance)
● 5070–5100 (stronger resistance zone)
🟢 Support
● 4950–4970 (short-term support)
● 4870–4880 (key defensive support)
✅ Trading Strategy Reference
🔰 Long Strategy (Short-term trend-following longs)
👉 Entry: 4950–4980
🎯 Target 1: 5030
🎯 Target 2: 5070
📍 Logic: The 1H rebound is continuing, but it remains part of a corrective recovery phase.
🔰 Short Strategy (Primary approach: sell at resistance)
👉 Entry: 5030–5050 (scale in positions)
🎯 Target 1: 4970
🎯 Target 2: 4880
📍 Logic: The 4H structure remains corrective, making short positions at resistance more favorable.
✅ Risk Control
● Current phase: rebound testing resistance.
● If price firmly holds above 5050 on the 4H timeframe → short bias becomes invalid.
● If price breaks below 4950 → rebound likely ends.
● A rebound after a breakdown does not equal a trend reversal.

Nifty Analysis for Feb 11-16, 2026Wrap up:-
Earlier we have marked Major wave c, in which wave 1 is completed at 25473, wave 2 at 26341 and wave 3 is currently in progress.
Now, In wave 3, wave 1 is completed at 25641 and wave 2 is in progress which is making a wxy corrected pattern and currently wave x is in progress and is expected to be completed in the range of 25450-25300.
What I’m Watching for Feb 11-16, 2026 🔍
After Breakdown below 25811, it will be assumed that inner wave b of x is completed and thereafter, wave c will head towards for a Probable target i.e. 25450-25300 with a stoploss of 26009.
Disclaimer: Sharing my personal market view — only for educational purpose not financial advice.
"Don't predict the market. Decode them."

Nifty Energy - Rejected from Resistance ZoneNifty Energy :
In times of uncertainity, always look at the large/broader picture
Well Supported by Long term trend line
Currently rejected from Strong Resistance area
Breaking 37000 is crucial for good upmove (long due !)

Sterlite Tech (W): Aggressive Bullish (Decadal Breakout)(Timeframe: Weekly | Scale: Logarithmic)
The stock has confirmed a breakout from a 10-Year Symmetrical Triangle (2014–2025). Unlike previous attempts (which left long upper wicks), this week shows a strong closing candle above the resistance, supported by "Climax Volume."
🚀 1. The Fundamental Catalyst (The "Why")
The technical explosion is fueled by a structural shift in business prospects:
> US Market Opening: The reduction in US tariffs removes a major overhang, making STL competitive in its largest market again.
> Promoter Buying: The warrant issue at ₹110 sets a psychological floor. The market knows promoters are "all-in."
> Brokerage Upgrades: Recent reports (e.g., Nuvama) have raised targets to ₹200+, adding institutional credibility to the rally.
📈 2. The Chart Structure (The Decade Squeeze)
> The Pattern: The Symmetrical Triangle active since 2014.
> Resistance: The downward sloping trendline connecting peaks of 2018 (₹300+) and 2021 (₹200+) was passing through ₹145–₹150 .
> The Breakout: The stock closed the week at ~₹155 , confirming the jailbreak.
> Golden Crossover: On the Daily chart, the 50-DMA is rapidly approaching the 200-DMA from below. A crossover is imminent, which often triggers algorithmic buying.
📊 3. Volume & Indicators
> Volume Ignition: The volume is not just "high"; it is historic . This level of churn suggests a complete change of hands from "tired investors" to "fresh smart money."
> RSI: Rising sharply. Note that RSI is entering the "Overbought" zone (>70) on Weekly/Daily. In strong breakouts, RSI should remain overbought; it is a sign of strength, not a sell signal.
🎯 4. Future Scenarios & Key Levels
The stock has entered "Markup Phase."
🐂 Bullish Targets (The Extension):
- Target 1: ₹200 – ₹216.
- Target 2: ₹295.
🛡️ Support (The "Must Hold"):
- Immediate Support: ₹140 – ₹145. The breakout zone must now act as a rigid floor ( Polarity Principle ).
- Stop Loss: A weekly close below ₹130 would signal a "False Breakout" (Bull Trap).

NIFTY IT - LifelineNIFTY IT :
Just Taking a small Breathe after a huge fall
Currently supported by a longterm trendline
Bounced back from support region (yellow circles)
31000 levels are highly crucial now

NIFTY50 // BULLISH ENGULFING // 4HR TFHey folks,
I am looking here at the 4hr TF of Nifty 50 with EMA 50.
A visible Bullish engulfing on the 4hr tf has formed today above 50EMA, confirming the support of the moving average.
I know it is not a perfect bullish engulfing some of you might say, because of current 4hr candle open was not below previous one close. But in Chart analysis there is a rule that you to be versatile and flexible regarding these patterns, so it can be said that the two said price points are marginally close to consider this a engulfing.
Also, seeing little angle of the previous candle lower wick ( a good long one) it can be interpreted that the buy orders absorbed the good qty of sellers.
thus, I am going for a small long position in Nifty CE for next 4hrs candles till expiry of 10feb.
NIFTY 10FEB 26000CE.
Now just hoping for the "TRUMP" element to stay put down over the weekend.🤞🏼
:) Thanks. Happy Trading.

NIFTY- Intraday Levels - 16th Feb 2026If NIFTY sustain above 25502 then above this bullish then 25531/48 then 25602/30 or 25642/74 above this more bullish above this wait more levels marked on chart
If NIFTY sustain below 25439/26 below this bearish then around 25400/384 below this more bearish then 25261/39/26 strong level, then 25208/190/172 the last hope 25125/109/105/97/93 below this wait
Consider some buffer points in above levels.
Please do your due diligence before trading or investment.
**Disclaimer -
I am not a SEBI registered analyst or advisor. I does not represent or endorse the accuracy or reliability of any information, conversation, or content. Stock trading is inherently risky and the users agree to assume complete and full responsibility for the outcomes of all trading decisions that they make, including but not limited to loss of capital. None of these communications should be construed as an offer to buy or sell securities, nor advice to do so. The users understands and acknowledges that there is a very high risk involved in trading securities. By using this information, the user agrees that use of this information is entirely at their own risk.
Thank you.

BUY TODAY SELL TOMORROW for 5% DON’T HAVE TIME TO MANAGE YOUR TRADES?
- Take BTST trades at 3:25 pm every day
- Try to exit by taking 4-7% profit of each trade
- SL can also be maintained as closing below the low of the breakout candle
Now, why do I prefer BTST over swing trades? The primary reason is that I have observed that 90% of the stocks give most of the movement in just 1-2 days and the rest of the time they either consolidate or fall
Trendline Breakout in TVSSCS
BUY TODAY SELL TOMORROW for 5%

BAJAJ FINANCE@1025Not a SEBI registered, just sharing idea. Bajaj Finance @1025 broke out from falling trendline with volume. Short term target-1110, 1230 in 30-40 days, SL-1000.

BLUESTAR @1997Not a SEBI registered, just sharing idea. Investment idea BLUESTAR@1997 on the brink of breakout from rounding bottom @2041. Target short term-2500(4--50 days) long term -3500(6-9 month) SL-1940.

EURUSD BUY Breakout + Retest Entry
➡️ Break & Buy Above: 1.18956
When price decisively breaks above key resistance and holds, this signals bullish continuation.
📌 Stop-Loss: 1.1372
📌 Targets:
• TP1: 1.20888
• TP2: 1.21500
Why this works: Breakouts that retest previous resistance as support can unleash strong up moves.

NZD/JPY – Buy Entry Points📈 NZD/JPY – Buy Entry Points (Structured Plan)
Since you prefer clear trading levels, here is a clean buy setup plan.
🟢 1️⃣ Aggressive Buy (Trend Continuation)
Condition: Price holding above short-term support
Entry: 92.534 (on small pullback)
Stop Loss: 91.937
Target 1: 93.70
Target 2: 94.20
Target 3: 94.90

2-Year U.S. Treasury Yield Breaking Down!2-Year U.S. Treasury Yield ( TVC:US02Y ) chart is completing the bearish head & shoulder pattern and breaking down from the 3.45%-3.55% levels.
This may result in lower real yield expectations, increased demand for safety, shifting monetary policy expectations, and/or heightened short-term growth risk in the capital markets.
I expect it to reach the 2.40%-2.50% levels during the summer of this mid-term year.

Trade Catalyst Series - Episode 2 // GOKALDAS EXPORTSHey folks,
Today in new developing events in US-India deals, I have come with another stock to lookout.
This one is focused only for long-term window with the latest Reciprocal tariffs in talk.
1. Macro Overview
The US-India Interim Trade Agreement published today is a structural game changer for Indian textiles.
The Headline: US Reciprocal Tariffs on Indian exports (apparel) slashed from ~50% to 18%.
The Significance: This is not just a rollback; it is a competitive flip. For the last decade, India (tariff ~20%+) lost share to Vietnam and Bangladesh (zero or low duty).
But now new Hierarchy we have :
India: ~18% Duty
Vietnam/Bangladesh: ~20% Duty
China: ~30-35%+ Duty
Result: India is now the most cost-efficient sourcing hub for US brands.
2. Sector Impact: The "China+1" Accelerator
The entire Indian textile export sector moves from "survival mode" to "growth mode."
Exporters were absorbing 10-15% of the tariff burden to keep clients. This cost instantly vanishes, flowing directly to the bottom line.
US brands will likely to shift volume from Vietnam to India capturing the 2% duty spread.
3. Stock Spotlight: Why GOKEX you ask?
Gokaldas Exports is the highest-beta play on this specific catalyst.
~70% of GOKEX’s revenue comes from the US. No other major listed player (KPR Mill, Trident) has this level of direct sensitivity to US tariffs.
GOKEX recently acquired Atraco (Kenya) and Matrix (India). These assets were dragging earnings due to low utilization. With the tariff barrier removed, GOKEX can fill these factories with high-margin US orders.
4. Fundamental Check
Q3 FY26 (Bottom): Net profit crashed 71% YoY to inr14.6 Cr; Margins slumped to 7.7%. This is now priced in as the worst-case scenario.
FY27 Outlook (Recovery):
Revenue is expected to grow 15-20% as order books swell.
Margins: Projected to reduce back to 11-13% + tariff savings.
Valuation: Trading at ~26x depressed earnings. If earnings double in FY27 (base case on margin normalization), forward P/E drops to an attractive 13-15x.
5. Technical Setup - Daily Chart
The stock has already rallied ~40% this week.
Now on daily frame the RSI shows it is in overbought zone due to rush buying of the stock.
Next to watch out is for a minor pull back to the near support zone (here 0.786 level of fib) to make an entry.
the next resistance to watch will be 900. for that I would be monitoring the order book of the company in the next quarter.
6. Key Risks
-> The stock already rallied ~40% on rumors. A short-term dip is highly likely as other traders book profits.
->US Recession: Lower tariffs don't matter if US consumers stop buying clothes. Monitor US retail data closely.
-> A strengthening of rupee could eat into the new margin gains.
7. Final Verdict
I am long on this one so will be keep buying on Dips.
first Entry : 700-720
T1 : 1000
T2 : 1150
SL : 650
The 18% tariff rate is giving Indian exports distinct edge over Vietnam. so major focus after entry will be on the management commentary of order book visibility for Q1 FY27. If this all confirms volume shifts from Vietnam, the stock heads to inr1,000+, achieving our t2 or a new ATH.
Future episodes will explore additional sectors and companies that could emerge as beneficiaries of evolving global trade partnerships. If your eye catches on to some particular stock reflecting on the same let me know in the comments below I will do a episode on it too.

Gold prices fall - awaiting CPI fluctuations.Related Information:!!! ( XAU / USD )
Data released by the US Department of Labor showed that initial unemployment claims declined to 227,000 for the week ending February 7. While the figure came in slightly above market expectations of 222,000, it marked an improvement from the prior week’s revised reading of 232,000. At the same time, continuing claims increased to 1.862 million for the week ending January 31, underscoring persistent structural softness in the US labor market observed over the past year.
These mixed labor signals have helped underpin the US Dollar while simultaneously renewing investor interest in gold, as lingering employment fragilities continue to support demand for safe-haven assets.
personal opinion:!!!
Gold prices are consolidating below 4985, awaiting CPI news which is under selling pressure at the end of the week, and CPI and DXY data are recovering.
Important price zone to consider : !!!
Resistance zone point: 4985, 5040 zone
Support zone point : 4944 , 4890 zone
Follow us for the most accurate gold price trends.

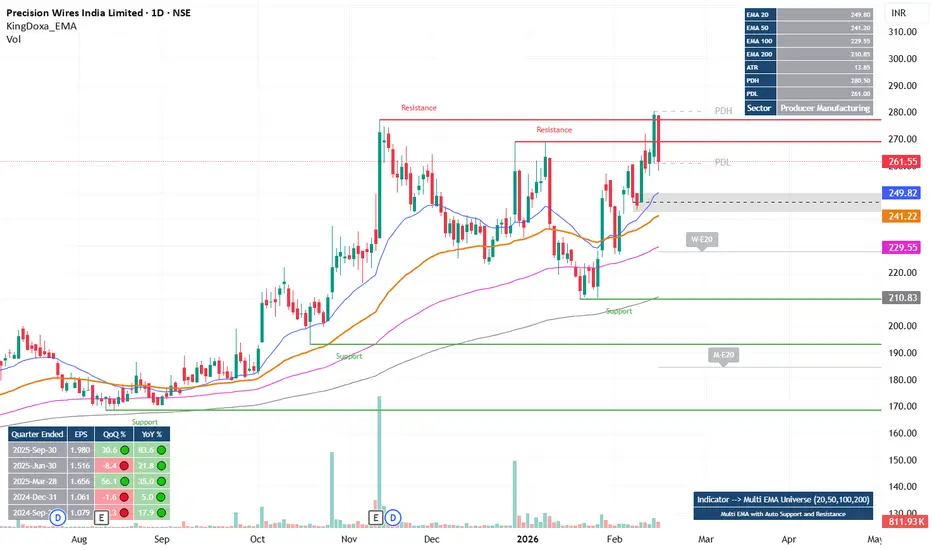
PRICWIREPRECWIRE
Price above all major EMA/s
Nice Buying pressure is observed
Failed B/o attempt followed by shake out. Resistance area Liquidity utilized.
Shake out move failed to close below PDL.
Price can get reverse either current level or from 250 (gray box), from where possible break out move can be observed.
AUDJPY – Bullish Reversal From Trendline SupportAUDJPY is reacting strongly from a major ascending trendline support on the 1H timeframe. Price swept liquidity below the structure, tapped into the demand zone, and immediately rejected — signaling buyer strength.
we entered long around 108.180, which aligns perfectly with the technicals.
📈 Why This Is a Bullish Setup
Price tapped the HTF trendline and respected it
Multiple liquidity sweeps beneath the zone, trapping sellers
Formation of a bullish rejection wick right at support
Price is still inside a discount area, ideal for longs
Recent bearish attempts failde to close below the trendline
Strong probability of a bullish push toward 109.20 – 109.50 liquidity zones
This is a classic trendline + demand + liquidity sweep confluence setup.
📋 Trade Parameters
Entry: 108.180 (executed)
Stop-Loss: ~55 pips (below liquidity sweep + structure low)
Take-Profit: ~110 pips (towards upper liquidity & imbalance zones)
Risk-to-Reward: ~1:2

Nifty Intraday Analysis for 13th February 2026NSE:NIFTY
Index has resistance near 26000 – 26050 range and if index crosses and sustains above this level then may reach near 26250 – 26300 range.
Nifty has immediate support near 25600 – 25550 range and if this support is broken then index may tank near 25350 – 25300 range.
The market is expected to open in the green with the range bound momentum. However, profit booking may pull the index lower in the end session.

Banknifty Intraday Analysis for 13th February 2026NSE:BANKNIFTY
Index has resistance near 61150 – 61250 range and if index crosses and sustains above this level then may reach near 61650 – 61750 range.
Banknifty has immediate support near 60350 - 60250 range and if this support is broken then index may tank near 59850 - 59750 range.
The market is expected to open in the green with the range bound momentum. However, profit booking may pull the index lower in the end session.
