SSWL - QUICK TRADE💡 Liked the idea?
Then don’t forget to Boost 🚀 it!
Comments are Most Welcome
Result Bet QUICK Trade
CMP 188
SL 175
Tgt upto 210
For more insights & trade ideas,
📲 Visit my profile and hit Follow
Warm regards,
Naresh G
SEBI Registered Research Analyst
💬 Comment below if you want me to analyse any stock for you 🔍
Community ideas

KALYANKJIL 1 Week Time Frame 📌 Current Price Snapshot (Weekly Context)
₹~391–396 — the stock is trading near its 52‑week low range after heavy selling pressure.
NSE/BSE trend is bearish on weekly charts (sell signals and down momentum).
📊 1‑Week Time Frame – Pivot & Key Levels
📉 Weekly Pivot & Levels (from pivot analysis)
(These are derived from weekly pivot point calculations, representing expected turning points for the week)
📌 Weekly Pivot:
Pivot: ~₹479.12
👊 Weekly Resistances:
R1: ~₹495.23
R2: ~₹522.97
R3: ~₹539.08
🛑 Weekly Supports:
S1: ~₹451.38
S2: ~₹435.27
S3: ~₹407.53
👉 The current market price (~₹392–396) is below the first major weekly support (~₹451) and closer to the third weekly support at ~₹407.5 — indicating deep bearish momentum this week.
🧠 Summary – 1‑Week Level Playbook
Bearish near‑term risk:
Break below ~₹407 opens potential towards psychological lower bands.
Key levels for traders this week:
Support to watch: ~₹407 (S3)
Initial resistance to challenge: ~₹451 (S1 on weekly pivot)
Major resistance zones: ~₹495 and ~₹523

XAUUSD H1 – Liquidity Grab Completed, Buy the DipMarket Context
Gold has just completed a strong impulsive rally, leaving behind multiple liquidity pockets and imbalance zones below. The current pullback is technical in nature, serving as a rebalancing phase after expansion rather than a trend reversal.
From a macro perspective, safe-haven demand and a cautious Fed outlook continue to support Gold, keeping the broader bias tilted to the upside.
Technical Structure (H1 – MMF)
Market structure remains bullish with higher highs and higher lows.
The recent sell-off is a liquidity grab into previous demand zones.
No confirmed bearish CHoCH at this stage.
Price is still holding above the major H1 GAP liquidity zone.
Trading Plan – MMF Style
Primary Scenario – Trend-Following BUY
Prefer BUY setups on pullbacks into:
BUY zone 1: 4,759 – 4,729
BUY zone 2 (deep): 4,669 – 4,600
Only execute BUYs after clear bullish reaction and structure hold.
Avoid FOMO at premium levels.
Upside Targets
TP1: 4,817
TP2: 4,892
TP3: 4,898 (liquidity sweep zone)
Alternative Scenario
If price fails to hold above 4,729 and sweeps deeper liquidity into the GAP H1 zone, wait for re-accumulation signals before re-entering BUYs.
Invalidation
An H1 close below 4,600 invalidates the bullish setup and requires a full structure reassessment.
Summary
The broader trend remains bullish. The current move is a corrective pullback into liquidity, offering high-quality buy-the-dip opportunities. Patience and confirmation remain key — let price come to you.

XAUUSD – H2 Technical AnalysisLiquidity Pullback Within a Strong Bullish Structure | Lana ✨
Gold continues to trade within a well-defined bullish structure on the H2 timeframe. The recent surge was impulsive, followed by a healthy retracement that appears to be rebalancing liquidity rather than signaling a trend reversal.
Price action remains constructive as long as the market respects key structural levels and the ascending trendline.
📈 Market Structure & Trend Context
The overall trend remains bullish, with higher highs and higher lows still intact.
Price continues to respect the ascending trendline, which has acted as reliable dynamic support throughout the uptrend.
The recent pullback occurred after an aggressive upside expansion, fitting the classic sequence:
Impulse → Pullback → Continuation
No clear distribution pattern is visible at this stage. As long as structural support holds, the bias remains BUY on pullbacks, not selling strength.
🔍 Key Technical Zones & Value Areas
Primary Buy POC Zone: 4764 – 4770
This area represents a high-volume node (POC) and aligns closely with the rising trendline.
It is a natural zone where price may rebalance before resuming the bullish trend.
Secondary Value Area (VAL–VAH): 4714 – 4718
A deeper liquidity zone that could act as support if sell pressure temporarily increases.
Near-term resistance: 4843
Acceptance above this level strengthens the continuation scenario.
Psychological reaction zone: 4900
Likely to generate short-term hesitation or profit-taking.
Higher-timeframe expansion targets:
5000 (psychological level)
2.618 Fibonacci extension, where major liquidity may be resting.
🎯 Trading Plan – H2 Structure-Based
✅ Primary Scenario: BUY the Pullback
Buy Entry:
👉 4766 – 4770
Lana prefers to engage only if price pulls back into the POC zone and shows bullish confirmation on H1–H2 (trendline hold, strong rejection of lower prices, or bullish follow-through).
Stop Loss:
👉 4756 – 4758
(Placed ~8–10 points below entry, beneath the POC zone and the ascending trendline)
🎯 Take Profit Targets (Scaled Exits)
TP1: 4843
First resistance zone — partial profit-taking recommended.
TP2: 4900
Psychological level with potential short-term reactions.
TP3: 5000
Major psychological milestone and upside expansion target.
TP4 (extension): 5050 – 5080
Area aligned with the 2.618 Fibonacci extension and higher-timeframe liquidity.
The preferred approach is to scale out gradually and protect the position, adjusting risk as price confirms continuation.
🌍 Macro Context (Brief)
According to Goldman Sachs, central banks in emerging markets are expected to continue diversifying reserves away from traditional assets and into gold.
Average annual central bank gold purchases are projected to reach around 60 tons by 2026, reinforcing structural demand for gold.
This ongoing accumulation supports the idea that pullbacks are more likely driven by positioning and profit-taking, rather than a shift in long-term fundamentals.
🧠 Lana’s View
This remains a pullback within a bullish trend, not a bearish reversal.
The focus stays on buying value at key liquidity zones, not chasing price at highs.
Patience, structure, and disciplined execution remain the edge.
✨ Respect the trend, trade the structure, and let price come to your zone.

HINDZINC 1 Day Time Frame 📌 Current Price (intraday basis):
• ~ ₹667–₹670.8 (range seen today) with highs near ~₹694 and lows near ~₹652.65 earlier in the session.
📈 Intraday Pivot Levels (Daily)
These are calculated from recent price action and are widely used by traders to gauge intraday support and resistance:
📊 Pivot & Levels (Standard Daily)
• Pivot Point (PP): ~₹705.45
• Resistance
• R1: ~₹713.35
• R2: ~₹725.70
• Support
• S1: ~₹685.20
• S2: ~₹672.85
• S3: ~₹664.95
📍 Central Pivot Range (CPR)
• Top CPR: ~₹695.32
• Middle CPR: ~₹693.10
• Bottom CPR: ~₹690.88**
(Note: Pivot and CPR may shift slightly as market updates.)
📍 Summary – 1D Intraday Levels
Level Price (₹) Role
R2 ~725.70 Major upside resistance
R1 ~713.35 Near‑term resistance
Pivot ~705.45 Key directional trigger
CPR Top/Mid/Bottom ~695–690.9 Important intraday range
S1 ~685.20 Near‑term support
S2 ~672.85 Secondary support
S3 ~664.95 Lower support zone

IRB: Leading Diagonal ?LD didn't quite make it to the Upper Trendline.
Wave C in progress.
Likely to bottom near 20.
Non-log chart.
Always open to a different perspective.

Nifty buyDisclaimer:- This is not A BUY OR SELL recommendation. please Consult with your financial advisor or with broker before taking any trade,
this post is for educational purpose only . warning :- do not jump directly or do not copy my trades
DO your analysis properly

NIFTY – Bearish Structure Playing Out as AnticipatedIn my previous posts, I had clearly highlighted the possibility of a trend shift and warned that the ongoing price action could resolve to the downside. Over the last few sessions, price has started to play out exactly along those lines.
1. Bearish crossover (mini death cross)
A bearish crossover between the short-term and medium-term moving averages has now occurred. This was already anticipated and mentioned in earlier posts, and it marks a loss of bullish momentum after the ATH zone.
2. Clean breakdown below key support
Price has decisively broken below an important support and trendline structure. This confirms the bearish bias and strengthens the view that the broader market is under distribution rather than accumulation.
3. Next immediate support zone
The marked zone below acts as the next immediate support, where we may expect temporary consolidation or a technical bounce. However, unless there is strong follow-through buying, this should be treated cautiously.
4. Caution on bullish moves
Any signs of bullishness from here are likely to be temporary retracements, which may eventually trigger further sell-offs.
➡️ Avoid fresh swing longs until overall market sentiment turns favorable.
➡️ Existing positions should be managed with strict stop-losses and disciplined risk management.
The market is behaving in line with what was discussed earlier. Until structure changes and strength is proven, the risk remains on the downside. Patience and capital protection are more important than chasing trades in such phases.
📢📢📢
If my perspective changes or if I gather additional fundamental data that influences my views, I will provide updates accordingly.
Thank you for following along with this journey, and I remain committed to sharing insights and updates as my trading strategy evolves. As always, please feel free to reach out with any questions or comments.
Other posts related to this particular position and scrip, if any, will be attached underneath. Do check those out too.
Disclaimer : The analysis shared here is for informational purposes only and should not be considered as financial advice. Trading in all markets carries inherent risks, and past performance is not indicative of future results. It’s essential to conduct your own research and assess your risk tolerance before making any investment decisions. The views expressed in this analysis are solely mine. It’s important to note that I am not a SEBI registered analyst, so the analysis provided does not constitute formal investment advice under SEBI regulations.

DIXON 1 Day Time Frame 📉 Intraday Price Action (Today’s Range)
Day’s Range: ~₹10,274 – ₹10,790
This indicates where the stock has been trading so far today.
📊 Key Intraday Levels for 1‑Day Time Frame
🟢 Support Levels
S1: ~₹10,545 – ₹10,550
S2: ~₹10,359 – ₹10,360
S3: ~₹10,016 – ₹10,020
🔴 Resistance Levels
R1: ~₹11,070 – ₹11,075
R2: ~₹11,410 – ₹11,420
R3: ~₹11,600 – ₹11,605
These pivot‑derived support/resistance levels are typical for intraday reference (classic pivot methodology).
🧠 How to Use These Levels (Intraday)
Bullish bias: A sustained break above R1 ~₹11,070 with volume can open moves toward R2 ~₹11,410.
Bearish bias: If price loses S1 ~₹10,545, next support guards are S2 ~₹10,360 and S3 ~₹10,016.

silver support and resitancelook for 300 if it close 295-297 strongly on up 1hr time frame its bullish , if get rejections exit at given lines

JINDALSTEL 1 Day Time Frame 📊 Current Price Snapshot
The stock has been trading around ~₹1,030–₹1,070 on recent sessions.
🔑 Daily Pivot & Key Levels (1‑Day Time Frame)
🔼 Resistance Levels
R1: ~₹1,053–₹1,063
R2: ~₹1,062–₹1,071
R3: ~₹1,070–₹1,079+
These are potential daily resistance zones where price may slow or reverse on the upside.
🔁 Pivot/Reference Level
Daily Pivot (central level): ~₹1,045–₹1,046
This is the equilibrium reference; above this suggests slightly bullish bias, below suggests bearish bias for the day.
🔽 Support Levels
S1: ~₹1,034–₹1,056
S2: ~₹1,025–₹1,048
S3: ~₹1,015–₹1,041
These are key intraday support zones where the stock may find buying interest.
📈 How to Use These Levels Today
Bullish scenario: If price holds above the pivot and clears R1/R2 (~₹1,053–₹1,071) with volume, it may test R3 (~₹1,078+).
Bearish scenario: If it breaks below S2 (~₹1,025), watch for deeper pullbacks toward S3 (~₹1,015).
Range‑bound: If staying between pivot and S1/R1, expect sideways movement.
(Typical pivot logic — not investment advice.)

IOC 1 Month Time Frame 📌 CURRENT PRICE (as of 22 Jan 2026)
IOC share price: ~₹159.9 per share (NSE/BSE).
📊 1‑Month Technical Levels (Current & Accurate)
Resistance (Upside Levels)
These are levels where price may find selling pressure in the near term:
R1 – Immediate Resistance: ~₹160.6–₹162.5
R2 – Mid Resistance: ~₹162.5–₹163.9
R3 – Higher Resistance: ~₹164–₹165.2
A broader longer‑range resistance zone near ₹170–₹171+ remains significant if the market strengthens.
Why these matter:
Resistance levels show where the stock has historically paused or reversed on recent charts — useful for targets or exits.
Support (Downside Levels)
These are key near‑term supporting price zones:
S1 – Immediate Support: ~₹156.8–₹159.4
S2 – Secondary Support: ~₹154.7–₹157.9
S3 – Deeper Support: ~₹152.9–₹155.0
Note: If price breaks below ~₹155, it could signal further weakness in the short term.
🧠 How to Use These Levels
Swing traders: Use support zones for entry zones and resistance levels as targets.
Breakouts: A clear close above ₹164–₹165 could open room toward the ₹170+ zone.
Breakdown: A close below ₹155 could escalate selling into deeper support.

Real Knowledge of Candle Patterns Types of Candlestick Patterns
Candlestick patterns fall into three groups:
1. Reversal Patterns
Signal a potential change in trend.
2. Continuation Patterns
Indicate the trend will likely continue.
3. Indecision Patterns
Show lack of conviction and potential upcoming moves.

Elliott Wave Analysis XAUUSD – 22/01/2026
1. Momentum
– D1 momentum is currently preparing to reverse, which warns that the market may enter a corrective phase or move sideways for at least several days. We need to wait for today’s daily candle close to confirm this signal.
– H4 momentum is preparing to reverse to the upside, signaling the possibility of a bullish move on the H4 timeframe today. This is an important move that needs to be closely monitored.
– H1 momentum is currently rising and approaching the overbought zone, indicating that the short-term bullish momentum is weakening. When H1 momentum enters the overbought area and reverses, a short-term corrective decline is likely to occur.
2. Wave Structure
D1 Timeframe
– On the daily timeframe, price is currently in the late stage of the blue wave 5.
– At the same time, D1 momentum is preparing to reverse, therefore we need to wait for today’s daily close for confirmation.
– If the D1 momentum reversal to the downside is confirmed, this would warn of a relatively extended corrective move following the D1 trend.
– In that scenario, price may:
– Move back inside the rising price channel
– Test the lower boundary of the channel
– Or even decline deeper toward the previous wave 4 base around 4276
– Therefore, we must anticipate and prepare for deeper corrective scenarios.
H4 Timeframe
– With yesterday’s decline, the current structure is likely forming orange wave 4.
– Using the 0.382 Fibonacci retracement of orange wave 3, the potential target zone for wave 4 is around 4667.
– At the moment, H4 momentum is preparing to reverse upward, signaling that a bullish move may appear today.
– This upward move is very important because:
– If H4 momentum reverses up and reaches the overbought zone
– But price fails to create a new high
– This would warn of a deeper corrective process on the higher timeframe.
H1 Timeframe
– On H1, price has already reached the target of the purple wave 4.
– However, there is currently a confluence of multiple wave 4 structures from higher timeframes, so caution is required.
– H1 momentum is preparing to move into the overbought zone, which warns of a potential decline within the next few hours.
– This decline creates an expectation that price may sweep liquidity below around 4737, which is the target zone for the Buy setup.
3. Expectations and Price Targets
– After the corrective move, the next bullish leg will be very important due to the overlap of multiple wave structures on higher timeframes, meaning volatility is expected to be significant.
– Therefore, profit targets should be set appropriately and managed flexibly.
– The most ideal target for the bullish move is the completion of purple wave 5 around 4959.
– However, as analyzed on the H4 timeframe:
– If momentum rises but price fails to break the previous high
– In that case, it is advisable to prioritize taking profits in this area, as it may signal the formation of wave 4 on the H4 timeframe, leading to a deeper decline.
4. Trading Plan
– Buy setup: 4738 – 4736
– SL: 4728
– TP1: 4758
– TP2: 4816
– TP3: 4870

RICOAUTO 1 Week Time Frame 📊 Current Price Snapshot
The stock is trading around ₹115–₹122 range recently.
📈 Key Levels for 1-Week Time Frame
🔵 Resistance Levels (Upside Targets)
1. ~₹121–₹122 — Immediate resistance zone (short-term pivot region).
2. ~₹126–₹127 — Next resistance zone where sellers may appear.
3. ~₹129–₹132 — Higher resistance area, a target if momentum improves.
📌 If price breaks and sustains above ₹122–₹126 with volume, near-term bullish continuation could occur.
🔻 Support Levels (Downside Defense)
1. ~₹113–₹114 — First technical support.
2. ~₹110 — Secondary near-term support.
3. ~₹105–₹106 — Stronger lower support zone if selling accelerates.
📌 A close below ₹110 in daily charts often signals deeper pullbacks.
📌 What Traders Are Watching
Some technical analysts have noted support around ₹120–₹123 with stop-loss/entry zones for short-term trades (e.g., stop-loss near ₹114–₹115).
⚠️ Risk Notes
Short-term technical signals (like moving averages) currently show weak to selling bias on intraday/daily charts.
Broader market conditions and sector movement can heavily influence price direction.

Real Knowledge Chart Patterns Why Candlestick Patterns Matter
Candlestick patterns matter because they reflect real-time trader behavior:
Are bulls becoming aggressive?
Are bears weakening?
Is a reversal coming?
Is the trend gaining strength?
Are institutions absorbing liquidity?
In Volume Profile or Market Structure context:
A candle pattern near value areas confirms reversals.
A candle pattern at breakout zones confirms continuation.
A candle pattern after liquidity grabs confirms orderflow shift.

Gold: Structure Intact, Momentum Mature — Time Risk ZoneGold continues to trade within a well-defined long-term rising channel.
Recent acceleration has pushed price into higher Fibonacci stretch zones, indicating maturity rather than an immediate reversal.
Momentum is elevated, suggesting the market may cool via time and consolidation, not necessarily through a sharp decline.
As long as the primary channel holds, the broader structure remains intact.
This is an observation of market structure, not a directional call.
Risk management and decisions remain individual responsibility.
Key principle:
Structure > Excitement | Time-risk > Price targets
Structure is observed, not predicted.
Decisions remain the sole responsibility of the reader.

XAUUSD – Trendline broken, focus on Buying liquidityMarket Context
After a strong impulsive rally, Gold has broken below the short-term ascending trendline, signaling a technical correction and liquidity rebalancing phase. However, the higher-timeframe structure remains intact, and the current decline is still viewed as corrective rather than a trend reversal.
From a fundamental perspective, safe-haven demand and a cautious monetary policy outlook continue to support Gold. This keeps deeper pullbacks attractive for institutional accumulation rather than aggressive selling.
Structure & Price Action (H1)
Short-term bullish trendline has been broken → transition into a corrective phase.
No confirmed bearish CHoCH on H1 at this stage.
Price is rotating within a range, targeting liquidity pools below.
Multiple Demand + Liquidity + H1 GAP zones are located beneath current price.
Upper zones remain Supply / Liquidity Sell areas for potential reactions.
Key Levels to Watch
Supply / Liquidity Sell: 4,949 – 4,874
Mid reaction zone: 4,824
Primary BUY zone: 4,755 – 4,729
Deep BUY zone (H1 GAP – Liquidity): 4,665 – 4,600
Trading Plan – MMF Style
Primary Scenario – Buy at Discount
Look for BUY setups at:
BUY zone 1: 4,755 – 4,729
BUY zone 2: 4,665 – 4,600 (H1 GAP & liquidity)
Entries only after clear bullish reactions and structure holding.
Avoid premature entries while price remains mid-range.
Upside Targets
TP1: 4,824
TP2: 4,874
TP3: 4,949 (upper liquidity sweep)
Alternative Scenario
If price fails to reach lower zones and holds above 4,824, wait for a break & retest to re-enter BUY positions in trend direction.
Invalidation
An H1 close below 4,600 invalidates the BUY bias.
Stand aside and reassess overall market structure.
Summary
The broader bullish bias remains intact, while the current move represents a healthy pullback for liquidity absorption. The optimal strategy is patience—BUY at discounted zones with confirmation, not by chasing price.

XAUUSD – Short-Term Trendline Broken, Focus on Buying Liquidity Market Context
After a strong impulsive rally, Gold has broken below the short-term ascending trendline, signaling a technical correction and liquidity rebalancing phase. However, the higher-timeframe structure remains intact, and the current decline is still viewed as corrective rather than a trend reversal.
From a fundamental perspective, safe-haven demand and a cautious monetary policy outlook continue to support Gold. This keeps deeper pullbacks attractive for institutional accumulation rather than aggressive selling.
Structure & Price Action (H1)
Short-term bullish trendline has been broken → transition into a corrective phase.
No confirmed bearish CHoCH on H1 at this stage.
Price is rotating within a range, targeting liquidity pools below.
Multiple Demand + Liquidity + H1 GAP zones are located beneath current price.
Upper zones remain Supply / Liquidity Sell areas for potential reactions.
Key Levels to Watch
Supply / Liquidity Sell: 4,949 – 4,874
Mid reaction zone: 4,824
Primary BUY zone: 4,755 – 4,729
Deep BUY zone (H1 GAP – Liquidity): 4,665 – 4,600
Trading Plan – MMF Style
Primary Scenario – Buy at Discount
Look for BUY setups at:
BUY zone 1: 4,755 – 4,729
BUY zone 2: 4,665 – 4,600 (H1 GAP & liquidity)
Entries only after clear bullish reactions and structure holding.
Avoid premature entries while price remains mid-range.
Upside Targets
TP1: 4,824
TP2: 4,874
TP3: 4,949 (upper liquidity sweep)
Alternative Scenario
If price fails to reach lower zones and holds above 4,824, wait for a break & retest to re-enter BUY positions in trend direction.
Invalidation
An H1 close below 4,600 invalidates the BUY bias.
Stand aside and reassess overall market structure.
Summary
The broader bullish bias remains intact, while the current move represents a healthy pullback for liquidity absorption. The optimal strategy is patience—BUY at discounted zones with confirmation, not by chasing price.

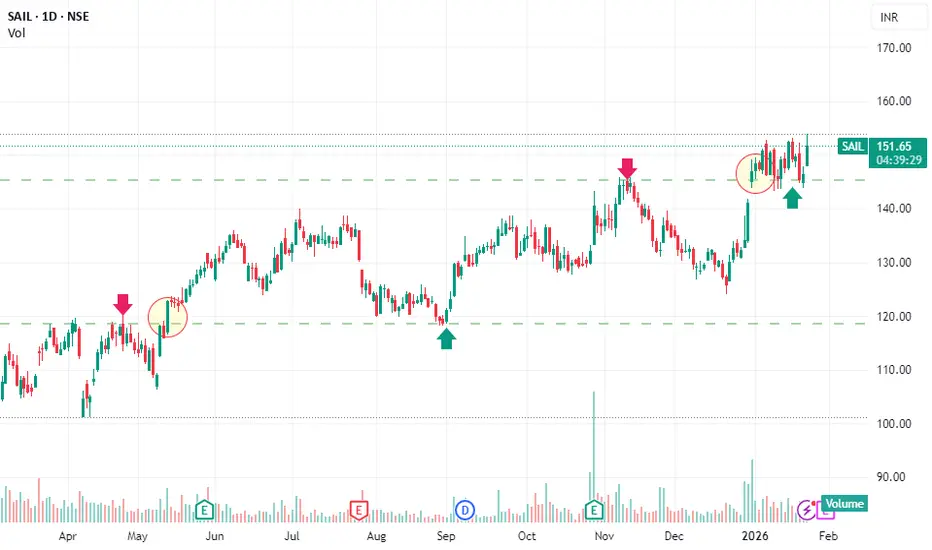
SAIL – Retest of Previous Breakout Turned Support
SAIL has successfully taken support at its previous breakout zone, which is a classic sign of strength. After breaking above the earlier resistance, the stock retraced back to the same level, where buyers defended the price, confirming the breakout’s validity.
Following this breakout–retest formation, SAIL has now started moving upward, indicating renewed buying interest and continuation of the bullish trend.
Technical Highlights:
Previous resistance has turned into strong support
Retest held without breakdown, showing bullish structure intact
Price action suggests higher-high and higher-low formation
Momentum is shifting back in favor of bulls
Conclusion:
As long as SAIL holds above the breakout support zone, the upside bias remains positive. The current move indicates a potential continuation of the ongoing uptrend, with higher levels likely in the coming sessions.
XAUUSD/GOLD 1H BUY LIMIT PROJECTION 22.01.26Today I’m sharing a HIGH PROBABILITY XAUUSD 1H Buy Limit Projection 📈
✅ Demand Zone Entry
✅ 0.618 Golden Fibo Confirmation
✅ Liquidity Collection Area Support
✅ Breakout confirmation & upside projection
🎯 Targets: R1 ➝ R2
🛑 SL: Below Stoploss Zone

GIFTNIFTY Feb 2026 Fut Roll-Over Levels For 22nd JAN 2026Roll-Over: GIFTNIFTY Feb 2026 Fut IntraSwing Levels For 22nd JAN 2026
🚀Follow & Compare NIFTY spot Post for Taking Trade
🚀Follow & Compare GIFTNIFTY Jan '26 EXP Post to take Roll-Over decision
^^^^^^^^^_______________________^^^^^^^^^^^^^^
💥Level Interpretation / description:
L#1: If the candle crossed & stays above the “Buy Gen”, it is treated / considered as Bullish bias.
L#2: Possibility / Probability of REVERSAL near RLB#1 & UBTgt
L#3: If the candle stays above “Sell Gen” but below “Buy Gen”, it is treated / considered as Sidewise. Aggressive Traders can take Long position near “Sell Gen” either retesting or crossed from Below & vice-versa i.e. can take Short position near “Buy Gen” either retesting or crossed downward from Above.
L#4: If the candle crossed & stays below the “Sell Gen”, it is treated / considered a Bearish bias.
L#5: Possibility / Probability of REVERSAL near RLS#1 & USTgt
HZB (Buy side) & HZS (Sell side) => Hurdle Zone,
*** Specialty of “HZB#1, HZB#2 HZS#1 & HZS#2” is Sidewise (behaviour in Nature)
Rest Plotted and Mentioned on Chart
Color code Used:
Green =. Positive bias.
Red =. Negative bias.
RED in Between Green means Trend Finder / Momentum Change
/ CYCLE Change and Vice Versa.
Notice One thing: HOW LEVELS are Working.
Use any Momentum Indicator / Oscillator or as you "USED to" to Take entry.
━━━━━━━━━━━━━━━━━━━━━━━━━━━━━━━━━━━━━━━━━━━
⚠️ DISCLAIMER:
The information, views, and ideas shared here are purely for educational and informational purposes only. They are not intended as investment advice or a recommendation to buy, sell, or hold any financial instruments. I am not a SEBI-registered financial adviser.
Trading and investing in the stock market involves risk, and you should do your own research and analysis. You are solely responsible for any decisions made based on this research.
"As HARD EARNED MONEY IS YOUR's, So DECISION SHOULD HAVE TO BE YOUR's".
━━━━━━━━━━━━━━━━━━━━━━━━━━━━━━━━━
❇️ Follow notification about periodical View
💥 Do Comment for Stock WEEKLY Level Analysis.🚀
📊 Do you agree with this view?
✈️ HIT THE PLANE ICON if this technical observation resonates with you. It will Motivate me.
━━━━━━━━━━━━━━━━━━━━━━━━━━━━━━━━━
💡 If You LOOKING any CHART & want for Level and ANALYZE?
Share your desired stock names in the comments below! I will try to analyze the chart Levels, patterns and share my technical view (so far my Knowledge).
If Viewers think It can identify meaningful setups. Looking forward to hearing from all of you — let's keep this discussion going and help each other make better trading decisions.

Gold & Silver as Safe-Haven and Hedge AssetsWhat Is a Safe-Haven Asset?
A safe-haven asset is one that tends to retain or increase its value during times of market stress. When equities fall sharply, currencies weaken, or financial systems face instability, capital often flows into assets perceived as stable and trustworthy. Gold and silver are classic examples because they are:
Tangible and finite resources
Independent of any single government or central bank
Globally accepted stores of value
Unlike fiat currencies, which can be printed in unlimited quantities, precious metals have natural supply constraints. This scarcity underpins their long-term value and makes them reliable during crises.
Gold: The Ultimate Safe-Haven Asset
Gold is widely considered the purest safe-haven asset in global markets.
1. Store of Value Across Centuries
Gold has preserved purchasing power over extremely long periods. While paper currencies have repeatedly collapsed due to hyperinflation, political upheaval, or excessive debt, gold has consistently retained value. This historical trust makes it a natural refuge when confidence in financial systems erodes.
2. Hedge Against Inflation
Inflation reduces the real value of money. When prices rise and purchasing power falls, gold often performs well. This is because gold prices tend to adjust upward as investors seek protection from currency debasement. During periods of high inflation or negative real interest rates, gold becomes particularly attractive.
3. Protection Against Currency Devaluation
Gold is priced globally in US dollars, but its value transcends any single currency. When a domestic currency weakens—due to fiscal deficits, monetary easing, or balance-of-payments stress—gold often rises in local currency terms. For emerging markets, including India, gold has historically acted as a shield against rupee depreciation.
4. Crisis and Geopolitical Hedge
Wars, financial crises, pandemics, and banking failures often trigger a “flight to safety.” In such moments, gold demand surges from investors, central banks, and institutions. Central banks themselves hold gold as part of foreign exchange reserves, reinforcing its role as a monetary anchor.
5. Portfolio Diversification
Gold typically has a low or negative correlation with equities and bonds during stress periods. This makes it an effective diversification tool. Even a modest allocation to gold can reduce overall portfolio volatility and drawdowns during market crashes.
Silver: The Hybrid Safe-Haven Asset
Silver shares many characteristics with gold but has a dual identity—part monetary metal, part industrial commodity.
1. Monetary and Investment Demand
Like gold, silver has been used as money throughout history. It attracts investment demand during inflationary periods and financial uncertainty, especially from retail investors due to its lower price per unit compared to gold.
2. Industrial Utility
Unlike gold, a large portion of silver demand comes from industrial applications—electronics, solar panels, medical devices, batteries, and electric vehicles. This gives silver an additional growth driver tied to economic expansion and technological progress.
3. Inflation Hedge with Higher Volatility
Silver can act as an inflation hedge, but its price tends to be more volatile than gold. During strong economic recoveries or reflationary phases, silver often outperforms gold, while during sharp crises gold usually remains more stable.
4. Leverage to Gold
Historically, silver tends to amplify gold’s moves. When gold enters a strong bull market, silver often rises faster in percentage terms. This makes silver attractive to investors seeking higher upside, albeit with greater risk.
Gold vs Silver as Hedges
While both metals act as hedges, they serve slightly different roles:
Gold: Best for capital preservation, crisis protection, and stability
Silver: Better for growth-linked hedging and higher return potential
Gold is favored by central banks and conservative investors, while silver appeals more to tactical and cyclical investors.
Role During Economic Cycles
Recession or Crisis
Gold usually performs strongly
Silver may lag initially due to weaker industrial demand
High Inflation / Stagflation
Both gold and silver tend to rise
Silver can outperform if inflation coincides with supply constraints
Economic Recovery / Growth Boom
Gold may consolidate
Silver often benefits from rising industrial demand
Rising Interest Rates
Short-term pressure on both metals
Long-term performance depends on real interest rates (rates minus inflation)
Ways to Invest in Gold and Silver
Investors can gain exposure through multiple avenues:
Physical metals (coins, bars, jewelry)
ETFs and mutual funds backed by bullion
Sovereign gold bonds (especially relevant in India)
Futures and options for active traders
Mining stocks for leveraged exposure
Each method has different risk, liquidity, and cost considerations.
Limitations and Risks
Despite their strengths, gold and silver are not perfect hedges:
They do not generate income like dividends or interest
Prices can remain flat for long periods
Short-term volatility, especially in silver, can be high
Performance depends heavily on macro factors such as real interest rates and dollar strength
Therefore, they are best used as portfolio stabilizers, not return-maximizing assets.
Conclusion
Gold and silver remain indispensable components of a well-balanced investment strategy. Gold stands as the ultimate safe-haven—offering protection against inflation, currency erosion, systemic risk, and geopolitical uncertainty. Silver complements gold with its dual role as a monetary metal and industrial commodity, providing both defensive qualities and growth potential.
