Trading Errors That Separate Winners from Losers1. Lack of a Trading Plan
One of the most glaring differences between winning and losing traders is the presence—or absence—of a clear trading plan.
Winners: Enter the market with a plan that covers entry criteria, exit points, risk tolerance, and position sizing. They know exactly why they are entering a trade and under what conditions they will exit, win or lose.
Losers: Trade impulsively, often chasing tips, reacting to news, or “winging it” based on emotions. Without predefined rules, they rely on hope and gut feelings, which are inconsistent and unreliable.
Think of it like driving without a destination or map—you may move, but you’re likely to get lost. Trading without a plan is essentially gambling.
2. Ignoring Risk Management
Risk management is often called the “holy grail” of trading. It is not glamorous, but it determines survival.
Winners: Risk only a small portion of their capital on each trade (often 1–2%). They use stop-loss orders, hedge positions, and understand the risk-reward ratio before entering a trade. They think in probabilities and know that protecting capital is more important than chasing quick gains.
Losers: Risk far too much on a single trade, sometimes even their entire account. They move stop-loss levels farther to avoid taking a small loss, only to suffer a devastating one later. A few bad trades can wipe out months or years of effort.
A classic rule says: “Take care of the downside, and the upside will take care of itself.” Winners live by this; losers ignore it.
3. Overtrading
Overtrading is one of the most common traps for beginners.
Winners: Understand that patience pays. They wait for high-probability setups, sometimes taking just a handful of trades in a week or month. They trade less, but smarter.
Losers: Feel the need to be in the market constantly. They confuse activity with productivity, opening positions based on boredom, fear of missing out (FOMO), or the illusion that “more trades = more profit.”
Overtrading not only increases transaction costs but also magnifies exposure to emotional mistakes.
4. Emotional Decision-Making
Markets are emotional arenas, and controlling psychology is as important as technical skill.
Winners: Maintain discipline and detach emotionally from trades. They accept losses as part of the business and move on without revenge-trading.
Losers: Allow fear, greed, hope, or frustration to dictate their moves. A small loss triggers panic. A big win creates overconfidence, leading to reckless bets. They chase losses, double down, or refuse to cut losers, turning manageable mistakes into disasters.
The famous trader Paul Tudor Jones once said: “Losers average losers.” This reflects the emotional trap of holding on to bad trades instead of accepting defeat.
5. Lack of Education and Preparation
Trading looks deceptively simple. Charts, news, and platforms are accessible to anyone. But without a strong foundation, losses are inevitable.
Winners: Invest time in education, study market structure, read books, analyze charts, and even backtest strategies. They treat trading as a profession, not a hobby.
Losers: Jump into markets unprepared, lured by promises of quick riches. They copy strategies without understanding them, rely on social media tips, or trade based on rumors.
In any competitive field—sports, medicine, law—training is essential. Trading is no different. Lack of preparation ensures failure.
6. Failure to Adapt
Markets are dynamic. What works today may not work tomorrow.
Winners: Adapt strategies to evolving conditions. If volatility rises, they adjust position sizing. If market structure changes, they reevaluate systems. They are flexible, constantly learning and evolving.
Losers: Stick rigidly to outdated methods or strategies, even when evidence shows they no longer work. They resist change, hoping markets will return to conditions where their strategy worked.
Adaptability is survival. Dinosaurs didn’t adapt and went extinct. Traders who fail to adapt face the same fate.
7. Neglecting the Importance of Psychology
Many traders focus only on technical indicators or news but ignore the psychology of trading.
Winners: Develop strong mental frameworks—discipline, patience, resilience. They understand cognitive biases like loss aversion, confirmation bias, and recency bias, and work to minimize their impact.
Losers: Are controlled by psychological traps. They believe they’re always right, seek only confirming evidence, and fear taking losses. This mindset sabotages even good strategies.
Trading is 80% psychology and 20% technique. Those who underestimate this imbalance often lose.
8. Unrealistic Expectations
Another error that separates losers from winners is expectation management.
Winners: Aim for consistent returns, not overnight riches. They understand compounding and set achievable goals. For them, trading is a marathon, not a sprint.
Losers: Expect to double their money every week, quit jobs overnight, or become millionaires in months. Such expectations lead to overleveraging, impulsive trades, and eventual ruin.
The harsh truth: trading is not a get-rich-quick scheme. Those who see it that way rarely last.
9. Ignoring Journal Keeping and Review
One of the simplest but most powerful tools in trading is a trading journal.
Winners: Keep detailed records of trades, including entry/exit, reasoning, emotions, and outcomes. They review mistakes, identify patterns, and refine strategies.
Losers: Don’t track trades. They forget mistakes, repeat them, and fail to see patterns of error.
Reviewing a journal is like a coach analyzing a game replay—it highlights strengths and weaknesses that cannot be seen in the heat of the moment.
10. Misuse of Leverage
Leverage magnifies both gains and losses.
Winners: Use leverage cautiously, only when setups are highly favorable. They ensure their accounts can handle drawdowns without panic.
Losers: Abuse leverage, turning small moves against them into catastrophic losses. They view leverage as a shortcut to quick profits, forgetting it’s a double-edged sword.
Many traders don’t fail because they are wrong, but because they are overleveraged when wrong.
11. Blindly Following Others
In today’s world, tips, social media, and chat groups flood traders with “advice.”
Winners: May listen to others but always do their own research before acting. They know that ultimately, their money is their responsibility.
Losers: Follow every tip or influencer without analysis. They jump on hype-driven moves, often buying at tops and selling at bottoms.
The herd mentality is strong in markets, but as Warren Buffett says: “Be fearful when others are greedy, and greedy when others are fearful.”
12. Lack of Patience and Discipline
Trading rewards patience and punishes impatience.
Winners: Can wait days or weeks for a setup that matches their rules. They avoid shortcuts and stick to discipline.
Losers: Want instant results. They break rules, enter trades prematurely, and exit too early out of fear.
Impatience turns strategy into chaos. Discipline turns chaos into consistency.
Conclusion: Turning Errors into Edges
The line between winning and losing traders isn’t about intelligence, luck, or even access to capital. It’s about behavior, discipline, and error management. Winners aren’t error-free—they simply make fewer critical mistakes and learn from every one. Losers repeat the same destructive errors until their capital or confidence runs out.
To move from losing to winning:
Create and follow a trading plan.
Prioritize risk management over profit.
Develop patience, discipline, and emotional control.
Treat trading as a profession—study, practice, and adapt.
Journal and review trades consistently.
The markets will always test you. But by avoiding these errors, you’ll stand among the minority who consistently extract profits rather than donate them.
Community ideas
Part 6 Learn Institutional Trading Call & Put Options Explained
At the heart of option trading are two instruments: Calls and Puts.
Call Option: Gives the buyer the right (not obligation) to buy the asset at the strike price.
Buyers expect prices to rise.
Sellers (writers) expect prices to stay flat or fall.
Put Option: Gives the buyer the right (not obligation) to sell the asset at the strike price.
Buyers expect prices to fall.
Sellers expect prices to stay flat or rise.
📌 Example:
If Reliance stock trades at ₹2500:
A ₹2600 call may cost ₹50 premium. If the stock rises to ₹2700, profit = (2700-2600-50) = ₹50 per share.
A ₹2400 put may cost ₹40. If stock falls to ₹2200, profit = (2400-2200-40) = ₹160 per share.
Key Concepts
Intrinsic Value: Real profit if exercised immediately.
Time Value: Premium paid for potential future movement.
In-the-Money (ITM): Option already profitable if exercised.
Out-of-the-Money (OTM): Option has no intrinsic value, only time value.
At-the-Money (ATM): Strike = current market price.

Part 1 Ride The Big MovesWhat is an Option?
An option is a financial contract that gives the buyer the right, but not the obligation, to buy or sell an underlying asset at a predetermined price (called the strike price) on or before a specific date (called the expiry date).
There are two main types of options:
Call Option – Gives the buyer the right to buy the underlying asset.
Put Option – Gives the buyer the right to sell the underlying asset.
Example:
If you buy a call option on stock XYZ with a strike price of ₹500, you can buy the stock at ₹500 even if the market price rises to ₹600.
If you buy a put option on stock XYZ at ₹500, you can sell it at ₹500 even if the market price falls to ₹400.
How Options Work
Call Option Buyer: Expects the price to rise. Pays a premium upfront. Profit = Unlimited (price can rise indefinitely) – Premium paid. Loss = Premium paid (if price falls below strike).
Put Option Buyer: Expects the price to fall. Pays a premium upfront. Profit = Strike – Price (max is strike – 0) – Premium paid. Loss = Premium paid.
Option Seller (Writer): Receives the premium. Takes obligation to buy/sell if the buyer exercises. Risk = Can be unlimited for call sellers.
Factors Affecting Option Prices (Option Greeks)
Option price is influenced by:
Delta (Δ) – How much the option price moves with a 1-point move in underlying.
Gamma (Γ) – How fast delta changes with underlying price.
Theta (Θ) – Time decay; how much value the option loses each day.
Vega (V) – Sensitivity to volatility in the underlying asset.
Rho (ρ) – Sensitivity to interest rates.
Tip: Time decay is crucial – options lose value as expiry approaches if the underlying doesn’t move favorably.

Part 2 Ride The Big MovesBasic Option Strategies
For Beginners
Long Call – Buy call, profit if price rises.
Long Put – Buy put, profit if price falls.
Covered Call – Own stock and sell call, earn premium.
Protective Put – Own stock and buy put to protect against downside.
Intermediate Strategies
Straddle – Buy call + put at same strike, profit from volatility.
Strangle – Buy OTM call + put, cheaper than straddle.
Bull Call Spread – Buy lower strike call, sell higher strike call.
Bear Put Spread – Buy higher strike put, sell lower strike put.
Advanced Strategies
Iron Condor, Butterfly Spread, Calendar Spread – mainly for experienced traders looking for defined risk/reward.
Advantages of Option Trading
Leverage: Small investment controls large position.
Hedging: Protect stock portfolios.
Flexibility: Profit in rising, falling, or sideways markets.
Limited Loss: Buyers lose only the premium paid.
Risks in Option Trading
Premium Loss: 100% loss if option expires worthless.
Time Decay: OTM options lose value fast near expiry.
Complexity: Advanced strategies require precise planning.
Unlimited Risk: Selling naked calls can be disastrous.

Physiology of Trading in the AI Era1. Human Physiology and Trading: The Foundations
1.1 Stress and the Fight-or-Flight Response
When humans trade, they are not just using rational logic; they are also battling their physiological responses. Every trade triggers an emotional and bodily reaction. For example:
Adrenaline release when markets move rapidly in one’s favor or against them.
Increased heart rate and blood pressure during volatile sessions.
Sweating palms and muscle tension as risk builds.
This “fight-or-flight” response, mediated by the sympathetic nervous system, has been part of human survival for millennia. In trading, however, it can impair rational decision-making. A surge of cortisol (the stress hormone) may lead to panic selling, hesitation, or impulsive buying.
1.2 Dopamine and Reward Pathways
Trading can be addictive. Each win activates dopamine in the brain’s reward circuitry, similar to gambling or gaming. Traders often “chase” that feeling, even when logic dictates restraint. Losses, on the other hand, trigger stress chemicals, leading to cycles of overtrading, revenge trading, or withdrawal.
1.3 Cognitive Load and Fatigue
Traditional trading involves constant information processing—charts, news, market data, risk assessments. This consumes enormous cognitive energy. Long sessions can lead to decision fatigue, reducing accuracy and discipline.
Thus, before AI, trading was fundamentally a battle of human physiology against the demands of complex markets.
2. The AI Disruption in Trading
2.1 Rise of Algorithmic and High-Frequency Trading (HFT)
AI-driven systems can execute thousands of trades per second, scan global markets, detect patterns invisible to humans, and adjust strategies in real-time. These machines do not suffer from fear, greed, or fatigue.
For human physiology, this means:
Reduced direct execution stress (since machines handle it).
Increased monitoring stress (humans must supervise systems).
Psychological dislocation (traders may feel less control).
2.2 Machine Learning in Decision Support
AI models analyze sentiment from social media, evaluate economic indicators, and forecast price moves. Instead of staring at multiple screens, traders increasingly interpret AI dashboards and signals. This shifts the physiological strain from reaction-based stress to interpretation-based stress.
2.3 Automation and Human Role Redefinition
In the AI era, humans are less about execution and more about strategy, oversight, and risk management. Physiology adapts to:
Lower manual workload.
Higher demand for sustained attention.
Possible under-stimulation leading to boredom and disengagement.
3. Physiological Challenges of Trading with AI
3.1 Stress of Oversight
Even though AI reduces execution stress, it creates new types of anxiety:
“What if the algorithm fails?”
“What if there is a flash crash?”
“What if my model is outdated?”
This “meta-stress” is often harder to manage because the trader is not directly in control. Cortisol levels may remain high over long periods, contributing to chronic stress.
3.2 Cognitive Overload from Complexity
AI outputs are highly complex—probability charts, heatmaps, predictive models. Interpreting them requires intense concentration, taxing the prefrontal cortex (responsible for logic and planning). Prolonged exposure leads to cognitive fatigue, headaches, and reduced analytical clarity.
3.3 Screen Time and Physical Health
AI-based trading often demands sitting for long hours in front of multiple screens. This leads to:
Eye strain (computer vision syndrome).
Poor posture and musculoskeletal stress.
Reduced physical activity, increasing long-term health risks.
3.4 Emotional Detachment vs Overreliance
Some traders experience emotional detachment because AI reduces the “thrill” of trading. Others, however, become overly reliant, experiencing anxiety when AI signals conflict with personal judgment. Both conditions alter physiological balance—either numbing dopamine pathways or overstimulating stress responses.
4. Positive Physiological Impacts of AI in Trading
4.1 Reduced Acute Stress
Since AI handles rapid execution, traders are spared the intense “fight-or-flight” responses of old floor trading. Heart rate variability (HRV) studies show that algorithmic traders often experience lower peak stress events compared to manual traders.
4.2 Better Sleep and Recovery (Potentially)
If managed well, AI systems allow for reduced night sessions and improved rest. However, this is true only when traders trust their systems.
4.3 Cognitive Augmentation
By filtering noise and providing data-driven insights, AI reduces raw information overload. Traders can focus on strategic thinking, which may be less physiologically taxing than high-speed execution.
5. Neurophysiology of Human-AI Interaction
5.1 Brain Plasticity and Adaptation
Just as the brain adapted to calculators and computers, it is adapting to AI in trading. Neural pathways reorganize to prioritize pattern recognition, probabilistic thinking, and machine-interpretation skills.
5.2 The Stress of Uncertainty
The human brain dislikes uncertainty. AI, by nature, operates probabilistically (e.g., “there is a 70% chance of price rise”). This constant probabilistic feedback keeps traders in a state of anticipatory stress, leading to sustained low-level cortisol release.
5.3 Trust and the Oxytocin Factor
Neuroscience shows that trust is mediated by oxytocin. When traders trust their AI systems, oxytocin reduces stress. But if trust breaks (due to errors or losses), physiological stress spikes significantly higher than in traditional trading.
6. The Future of Trading Physiology in the AI Era
6.1 Neural Interfaces and Brain-Computer Trading
As AI advances, direct brain-computer interfaces may allow traders to interact without keyboards or screens. This will blur the line between human physiology and machine execution.
6.2 AI as Physiological Regulator
AI could not only trade but also monitor the trader’s physiological state—detecting stress, suggesting breaks, or even auto-reducing risk exposure when cortisol levels spike.
6.3 From Physiology to Philosophy
Ultimately, the AI era forces us to ask: What is the role of human physiology in a world where machines outperform us? Perhaps the answer lies not in competing, but in complementing—using uniquely human traits while allowing AI to handle mechanical execution.
Conclusion
The physiology of trading in the AI era is a fascinating intersection of biology and technology. Human bodies, wired for survival in primal environments, now face markets dominated by machines that never fatigue or feel fear. While AI reduces some physiological burdens—like execution stress—it introduces new forms of stress, such as oversight anxiety, cognitive overload, and emotional detachment.
The challenge for modern traders is not to resist AI but to manage their physiology in harmony with it. By using mindfulness, ergonomic design, physical health practices, and new neuro-adaptive tools, traders can maintain resilience.
In the long run, the physiology of trading will evolve. The human brain adapts, neural pathways shift, and AI itself may become an ally in regulating our stress. Trading in the AI era is no longer just about markets—it is about the integration of human physiology with machine intelligence.
Stock Market Gains: A Comprehensive Analysis1. Introduction
The stock market is a reflection of the economic and financial health of a nation. It serves as a platform where investors trade ownership shares in publicly listed companies. Stock market gains represent the increase in the value of investments over time and are a key measure of financial success for both individual and institutional investors. These gains can be realized in the form of capital appreciation, dividends, or a combination of both.
Understanding stock market gains requires examining not only market mechanics but also broader economic, psychological, and geopolitical factors. They are influenced by a complex interplay of microeconomic and macroeconomic forces, corporate performance, investor sentiment, and global market dynamics.
2. Types of Stock Market Gains
Stock market gains generally fall into two broad categories:
2.1 Capital Gains
Capital gains occur when the price of a stock increases from the time it was purchased. For instance, if an investor buys a stock at ₹100 and sells it at ₹150, the capital gain is ₹50 per share. Capital gains can be:
Short-term: Gains on assets held for less than a year. Typically, these are taxed at higher rates in many countries.
Long-term: Gains on assets held for more than a year, often benefiting from lower tax rates.
Capital gains are highly influenced by market volatility, investor sentiment, and company performance.
2.2 Dividend Gains
Dividends are periodic payments made by companies to shareholders from their profits. They provide passive income and can significantly contribute to long-term wealth creation. For example, an investor holding 100 shares of a company paying ₹5 per share annually will earn ₹500 per year in dividends. Dividend gains are particularly attractive in defensive and high-growth sectors, where companies distribute consistent dividends while maintaining growth.
2.3 Total Returns
A comprehensive view of stock market gains combines capital gains and dividends, which together form the total return. Total returns are crucial for understanding the real profitability of investments over time.
3. Factors Driving Stock Market Gains
3.1 Economic Indicators
Stock market performance is closely tied to economic conditions:
GDP Growth: Higher economic growth often translates into better corporate earnings, boosting stock prices.
Inflation: Moderate inflation is generally positive for stock markets, while hyperinflation erodes gains.
Interest Rates: Lower interest rates reduce the cost of borrowing, stimulate economic activity, and often drive stock market gains. Conversely, rising rates may dampen gains.
3.2 Corporate Performance
Individual companies’ financial health directly affects their stock prices:
Revenue and Profit Growth: Companies with consistent earnings growth attract investors, pushing stock prices higher.
Innovation and Market Leadership: Firms that innovate or dominate their sectors tend to deliver superior gains.
Efficient Management: Strong corporate governance and effective management strategies often lead to sustainable gains.
3.3 Market Sentiment
Investor behavior and psychology play a significant role:
Bullish Sentiment: Optimism about future growth drives buying pressure, increasing stock prices.
Fear and Panic: Negative news or global uncertainty can trigger sell-offs, temporarily reducing gains.
Herd Behavior: Investors often follow trends, amplifying market movements and influencing gains.
3.4 Geopolitical Factors
Global events can have an outsized impact on stock market gains:
Trade wars and tariffs can affect corporate profits.
Political instability may deter foreign investment.
Geopolitical tensions in energy-producing regions can drive energy stock gains.
3.5 Technological and Sectoral Trends
Emerging industries often generate substantial gains for early investors:
Tech and AI Sectors: Companies in artificial intelligence, cloud computing, and semiconductors have shown explosive stock market gains.
Renewable Energy: Growth in solar, wind, and battery technology stocks is contributing to modern market gains.
Healthcare and Biotechnology: Innovations in pharmaceuticals and biotech often lead to rapid capital appreciation.
4. Measuring Stock Market Gains
4.1 Index Performance
Stock market gains are often measured using market indices like the Nifty 50, S&P 500, or Dow Jones Industrial Average. Indices aggregate individual stock performances to provide a snapshot of overall market trends.
Absolute Gains: The simple increase in index value over time.
Percentage Gains: Provides a normalized view of growth, making it easier to compare different periods.
4.2 Individual Stock Performance
Investors track gains at the individual stock level:
Price-to-Earnings (P/E) Ratio: A valuation metric indicating whether a stock is priced reasonably relative to earnings.
Return on Equity (ROE): Measures profitability and efficiency in generating gains for shareholders.
Earnings Per Share (EPS) Growth: Predicts future potential gains based on historical performance.
4.3 Risk-Adjusted Returns
Not all gains are equally valuable. Sharpe ratio, beta, and alpha are used to measure gains relative to risk, helping investors identify whether they are being adequately compensated for taking on market risk.
5. Strategies to Maximize Stock Market Gains
Investors employ a variety of strategies to maximize gains:
5.1 Long-Term Investing
Buy-and-hold strategies capitalize on compounding gains over time.
Focus on fundamentally strong companies with consistent revenue and profit growth.
Dividend reinvestment enhances long-term total returns.
5.2 Value Investing
Identify undervalued stocks trading below their intrinsic value.
Purchase during market corrections to maximize potential gains when the market recognizes their true worth.
5.3 Growth Investing
Focus on companies with above-average growth potential.
Higher risk but the potential for extraordinary capital gains exists.
5.4 Technical Analysis
Use price charts, moving averages, volume, and other indicators to time entry and exit points.
Helps traders capture short-term gains in volatile markets.
5.5 Diversification
Spread investments across sectors, geographies, and asset classes.
Mitigates risk while maintaining potential for gains.
5.6 Leveraging Derivatives
Options, futures, and other derivatives can magnify gains, but also increase risk.
Requires careful strategy and risk management.
6. Market Cycles and Gains
Stock market gains are not linear; they fluctuate according to market cycles:
6.1 Bull Markets
Characterized by optimism, rising stock prices, and strong gains.
Investors often see high capital gains during these periods.
6.2 Bear Markets
Stock prices decline, eroding gains temporarily.
Savvy investors may find opportunities to accumulate quality stocks at lower prices.
6.3 Sideways Markets
Periods of consolidation or minimal growth.
Dividend gains and strategic trading can still provide meaningful returns.
7. Psychological Aspects of Gains
Investor psychology significantly impacts the realization of gains:
Fear of Missing Out (FOMO) can drive impulsive purchases.
Overconfidence may lead to excessive risk-taking.
Loss Aversion can prevent selling winning stocks, reducing potential gains.
Patience and Discipline are essential for consistent long-term gains.
8. Risks and Challenges
Stock market gains are not guaranteed. Several factors can limit or reverse gains:
Market Volatility: Rapid price swings can erode capital gains.
Economic Downturns: Recessions can reduce corporate earnings and stock prices.
Inflation and Currency Risk: Erode real returns, particularly for international investments.
Regulatory Changes: Sudden policy shifts can impact entire sectors.
Fraud and Mismanagement: Corporate scandals or governance failures can wipe out gains.
Technology, AI, and the Future of Gains
Technology is reshaping how gains are generated and tracked:
Algorithmic Trading: Uses AI to capture short-term gains at scale.
Robo-Advisors: Offer automated portfolio management to maximize long-term gains.
Big Data and Analytics: Help investors identify trends and make data-driven decisions.
The future of stock market gains will likely be influenced by these technological advances, increasing efficiency and access to opportunities globally.
Conclusion
Stock market gains are multifaceted, driven by economic fundamentals, corporate performance, investor psychology, and global events. Understanding the types of gains, factors influencing them, and strategies to maximize returns is essential for both individual and institutional investors. While the potential for extraordinary returns exists, risks and volatility are inherent, necessitating careful analysis, discipline, and a long-term perspective.
In essence, achieving meaningful stock market gains requires a balance of knowledge, strategy, patience, and adaptability to market conditions. Investors who combine analytical insight with disciplined execution are best positioned to navigate the complexities of the financial markets and capitalize on growth opportunities.

High-Frequency Trading (HFT)1. Introduction to High-Frequency Trading
High-Frequency Trading, commonly known as HFT, is one of the most fascinating and controversial developments in modern financial markets. It refers to the use of advanced algorithms, ultra-fast computers, and high-speed data networks to execute thousands of trades in fractions of a second. Unlike traditional traders who might hold a stock for days, weeks, or months, HFT firms often hold positions for mere milliseconds to seconds before closing them.
The goal is simple yet complex: exploit tiny price inefficiencies across markets repeatedly, so that the small profits from each trade accumulate into large gains. HFT thrives on speed, volume, and precision.
In the 21st century, HFT has transformed how global markets function. Estimates suggest that 50–60% of equity trading volume in the US and nearly 40% in Europe is driven by HFT. It has created a financial arms race where firms spend millions to shave microseconds off trade execution time.
But while some argue HFT improves liquidity and efficiency, others see it as an unfair advantage that destabilizes markets. To understand this debate, we must first trace how HFT evolved.
2. Historical Evolution of HFT
a) Early Trading Days
Before computers, trading was conducted by human brokers shouting orders on exchange floors. Trades took minutes, sometimes hours, to process. Speed wasn’t the focus; information and relationships were.
b) Rise of Electronic Trading (1970s–1990s)
The introduction of NASDAQ in 1971, the first electronic stock exchange, was the seed for automated trading.
By the late 1980s, program trading became popular: computer systems executed pre-defined buy/sell orders.
Regulatory changes like SEC’s Regulation ATS (1998) enabled Alternative Trading Systems (ATS), such as electronic communication networks (ECNs).
c) Birth of High-Frequency Trading (2000s)
With the spread of broadband internet and decimalization (2001) of stock quotes (moving from 1/16th to 1 cent spreads), markets became tighter and more suitable for HFT.
By mid-2000s, firms like Citadel, Jump Trading, and Renaissance Technologies began developing advanced algorithms.
In 2005, Regulation NMS in the US required brokers to offer clients the best available prices, which fueled arbitrage-based HFT.
d) The HFT Boom (2007–2010)
Ultra-low latency networks allowed HFT firms to trade in microseconds.
During this period, HFT profits peaked at $5 billion annually in the US.
e) Modern Era (2010–Present)
Post the 2010 Flash Crash, regulators imposed stricter monitoring.
Now, HFT is more competitive, with shrinking spreads and lower profitability. Only the largest firms with cutting-edge infrastructure dominate.
3. Core Principles and Mechanics of HFT
At its core, HFT relies on three fundamental pillars:
Speed – Faster data processing and trade execution than competitors.
Volume – Executing thousands to millions of trades daily.
Automation – Fully algorithm-driven, with minimal human intervention.
How HFT Works Step by Step:
Market Data Collection – Systems capture live market feeds from multiple exchanges.
Signal Processing – Algorithms identify potential opportunities (like arbitrage or momentum).
Order Placement – Orders are executed within microseconds.
Risk Control – Automated systems constantly monitor exposure.
Order Cancellation – A hallmark of HFT is rapid order cancellation; more than 90% of orders are canceled before execution.
In short, HFT is about being faster and smarter than everyone else in spotting and exploiting price inefficiencies.
4. Technology & Infrastructure Behind HFT
HFT is as much about technology as finance.
Colocation: HFT firms place their servers next to exchange servers to minimize latency.
Microwave & Laser Networks: Some firms use microwave towers or laser beams (instead of fiber optic cables) to send signals faster between cities like Chicago and New York.
Custom Hardware: Use of Field-Programmable Gate Arrays (FPGAs) and specialized chips for ultra-fast execution.
Algorithms: Written in low-level programming languages (C++, Java, Python) optimized for speed.
Data Feeds: Direct market data feeds from exchanges, often costing millions annually.
Without such infrastructure, competing in HFT is impossible.
5. Types of HFT Strategies
HFT isn’t a single strategy—it’s a family of approaches.
a) Market Making
Continuously posting buy and sell quotes.
Profit from the bid-ask spread.
Provides liquidity but withdraws during stress, creating volatility.
b) Arbitrage Strategies
Statistical Arbitrage: Exploiting short-term mispricings between correlated assets.
Index Arbitrage: Spotting mismatches between index futures and constituent stocks.
Cross-Exchange Arbitrage: Exploiting price differences across exchanges.
c) Momentum Ignition
Algorithms try to trigger price moves by quickly buying/selling and then profiting from the resulting momentum.
d) Event Arbitrage
Trading news or events (earnings releases, economic data) milliseconds after release.
e) Latency Arbitrage
Profiting from speed advantage when market data is updated at different times across venues.
f) Quote Stuffing (controversial)
Sending massive orders to overload competitors’ systems, then exploiting the delay.
6. Benefits of HFT
Despite criticisms, HFT provides several market benefits:
Liquidity Provision – Ensures continuous buy/sell availability.
Tighter Spreads – Reduced transaction costs for investors.
Market Efficiency – Prices reflect information faster.
Arbitrage Reductions – Eliminates mispricings across markets.
Automation & Innovation – Pushes markets toward modernization.
7. Risks, Criticisms, and Controversies
HFT has a darker side.
Market Volatility – Sudden liquidity withdrawals can trigger flash crashes.
Unfair Advantage – Retail and institutional investors can’t compete on speed.
Order Spoofing & Manipulation – Some HFT tactics border on illegal.
Systemic Risk – Reliance on algorithms may cause chain reactions.
Resource Arms Race – Billions spent on infrastructure only benefit a few.
The 2010 Flash Crash
On May 6, 2010, the Dow Jones plunged nearly 1,000 points in minutes, partly due to HFT feedback loops. Although the market recovered quickly, it exposed the fragility of algorithm-driven markets.
8. Regulation & Global Perspectives
Regulators worldwide are struggling to balance innovation with fairness.
US: SEC and CFTC monitor HFT. Rules like Reg NMS and circuit breakers have been introduced.
Europe: MiFID II (2018) tightened reporting, increased transparency, and mandated testing of algorithms.
India: SEBI regulates algo trading; discussions about limiting co-location privileges exist.
China: More restrictive, cautious approach.
Overall, regulators want to prevent manipulation while preserving liquidity benefits.
Conclusion
High-Frequency Trading is both a marvel of technology and a challenge for market fairness. It epitomizes the arms race between human ingenuity and machine speed. While HFT undoubtedly improves liquidity and market efficiency, it also introduces systemic risks that cannot be ignored.
As markets evolve, so will HFT—pushed forward by AI, quantum computing, and global competition. For traders, investors, and policymakers, understanding HFT isn’t just about finance—it’s about the intersection of technology, economics, and ethics in the digital age of markets.
Part 8 Trading Master ClassIntroduction to Options
Financial markets provide several instruments to trade and invest. Among equities, futures, commodities, and currencies, options trading has gained significant popularity worldwide, including India. Options are not just speculative tools; they are also powerful instruments for hedging, income generation, and risk management.
An option is essentially a derivative contract—its value is derived from an underlying asset like a stock, index, commodity, or currency. Unlike direct stock ownership, an option gives the buyer rights but not obligations. This unique feature makes them versatile but also complex for beginners.
To truly master options, one must understand not only the basic definitions but also pricing, market psychology, and strategies.
Basic Terminology
Before diving deeper, let’s go through the essential terms:
Option Contract: Agreement between buyer and seller based on an underlying asset.
Underlying Asset: Stock, index, commodity, or currency.
Strike Price: Pre-decided price at which the option can be exercised.
Expiry Date: The last date on which the option can be exercised.
Premium: Price paid by the buyer to acquire the option.
Lot Size: Minimum quantity for which an option can be traded.
European vs. American Options: European can be exercised only on expiry; American anytime before expiry.
Call & Put Options Explained
At the heart of option trading are two instruments: Calls and Puts.
Call Option: Gives the buyer the right (not obligation) to buy the asset at the strike price.
Buyers expect prices to rise.
Sellers (writers) expect prices to stay flat or fall.
Put Option: Gives the buyer the right (not obligation) to sell the asset at the strike price.
Buyers expect prices to fall.
Sellers expect prices to stay flat or rise.
📌 Example:
If Reliance stock trades at ₹2500:
A ₹2600 call may cost ₹50 premium. If the stock rises to ₹2700, profit = (2700-2600-50) = ₹50 per share.
A ₹2400 put may cost ₹40. If stock falls to ₹2200, profit = (2400-2200-40) = ₹160 per share.

Part 3 Learn Institutional Trading Understanding Options
An option is a financial contract that gives the holder the right, but not the obligation, to buy or sell an underlying asset at a specified price, called the strike price, before or on a specific date known as the expiry date. Options are derivatives, meaning their value is derived from an underlying asset like stocks, indices, commodities, or currencies.
Types of Options
Call Option
A call option gives the buyer the right to buy the underlying asset at the strike price. Buyers expect the price to rise.
Example: If Infosys stock trades at ₹1500 and a trader buys a call with a strike price of ₹1550 for ₹30, they can purchase the stock at ₹1550, even if it rises to ₹1600.
Put Option
A put option gives the buyer the right to sell the underlying asset at the strike price. Buyers expect the price to fall.
Example: If Infosys stock trades at ₹1500 and a trader buys a put with a strike price of ₹1450 for ₹25, they can sell the stock at ₹1450, even if it drops to ₹1400.
Option Pricing and Factors Affecting Value
Option pricing is influenced by several variables, known as the Option Greeks:
Delta (Δ): Measures how much the option price moves with a ₹1 change in the underlying asset.
Call options have positive delta; put options have negative delta.
Gamma (Γ): Measures how delta changes as the underlying asset moves.
Theta (Θ): Represents time decay – the rate at which an option loses value as expiry approaches.
Vega (V): Sensitivity to volatility in the underlying asset. High volatility increases option premiums.
Rho (ρ): Sensitivity to interest rate changes.
Other factors include:
Underlying asset price
Strike price relative to market price
Time to expiry
Market volatility
Understanding these factors is crucial for effective trading and risk management.

Part 4 Learn Institutional Trading Introduction to Options
Financial markets provide several instruments to trade and invest. Among equities, futures, commodities, and currencies, options trading has gained significant popularity worldwide, including India. Options are not just speculative tools; they are also powerful instruments for hedging, income generation, and risk management.
An option is essentially a derivative contract—its value is derived from an underlying asset like a stock, index, commodity, or currency. Unlike direct stock ownership, an option gives the buyer rights but not obligations. This unique feature makes them versatile but also complex for beginners.
To truly master options, one must understand not only the basic definitions but also pricing, market psychology, and strategies.
Basic Terminology
Before diving deeper, let’s go through the essential terms:
Option Contract: Agreement between buyer and seller based on an underlying asset.
Underlying Asset: Stock, index, commodity, or currency.
Strike Price: Pre-decided price at which the option can be exercised.
Expiry Date: The last date on which the option can be exercised.
Premium: Price paid by the buyer to acquire the option.
Lot Size: Minimum quantity for which an option can be traded.
European vs. American Options: European can be exercised only on expiry; American anytime before expiry.
How Options Work in Practice
Option buyers have limited risk (premium paid) but unlimited profit potential (in calls if stock rises, in puts if stock falls).
Option sellers have limited profit (premium received) but potentially unlimited risk.
This asymmetric payoff structure creates a market where traders, hedgers, and institutions interact.

Derivatives in India: Secret Strategies for Massive ReturnsChapter 1: Understanding the Derivative Landscape in India
Before diving into strategies, it’s essential to understand the structure of derivatives in India.
1.1 What Are Derivatives?
A derivative is a financial contract whose value is derived from an underlying asset—such as stocks, indices, commodities, or currencies. In India, the most popular derivatives are:
Futures: Obligatory contracts to buy/sell at a predetermined price and date.
Options: Rights (but not obligations) to buy (call) or sell (put) at a specified price.
1.2 Key Milestones in India’s Derivatives Market
2000: NSE introduced index futures (Nifty 50).
2001: Index options and stock options launched.
2002: Stock futures introduced.
2020s: Surge in retail participation, especially in weekly options like Bank Nifty and Nifty.
1.3 Why Derivatives Matter in India
High Liquidity: Nifty and Bank Nifty options are among the most traded contracts globally.
Leverage: Small capital can control large positions.
Risk Management: Hedging against market volatility.
Speculation: Rapid gains (or losses) from price swings.
Chapter 2: The Psychology of Massive Returns
Before we look at the “secret strategies,” it’s important to highlight the psychological aspect.
2.1 Retail vs. Institutional Mindset
Retail traders often chase short-term profits, influenced by tips and news.
Institutions focus on risk-adjusted returns and hedging.
2.2 The Power of Discipline
The secret to massive returns isn’t chasing every trade but mastering risk control. Successful derivative players:
Limit losses using stop-loss orders.
Diversify positions.
Understand implied volatility and time decay.
2.3 The Illusion of Quick Money
Many traders blow up accounts because derivatives magnify both profits and losses. True success comes when strategies align with market structure.
Chapter 3: Secret Derivative Strategies for Massive Returns
Now let’s uncover the advanced and lesser-known strategies that experienced traders in India deploy.
3.1 The “Covered Call” Strategy
How it works: Buy a stock and sell a call option on the same stock.
Why it works in India: Many Indian stocks (like Infosys, HDFC Bank, Reliance) have stable long-term growth. Covered calls allow investors to earn extra income through premiums.
Secret Edge: Institutions frequently roll over covered calls, effectively compounding returns.
3.2 The “Straddle & Strangle” Trick Before Events
Straddle: Buy both a call and a put at the same strike price.
Strangle: Buy a call and a put at different strike prices.
When to use: Before high-volatility events (Union Budget, RBI monetary policy, earnings).
Secret Edge: In India, implied volatility (IV) tends to spike before events, allowing traders to profit even without large price moves.
3.3 The “Iron Condor” Strategy for Sideways Markets
Setup: Sell an out-of-the-money call and put, and buy further out-of-the-money call and put.
Why it works: Indian indices often consolidate after big moves, making non-directional strategies highly profitable.
Secret Edge: Works exceptionally well during weeks when no major events are scheduled.
3.4 The “Calendar Spread” Advantage
How it works: Sell near-term options and buy long-term options.
Why it works in India: Weekly options expire every Thursday, while monthly options provide longer exposure. Traders exploit the faster time decay in short-term contracts.
3.5 The “Delta Neutral” Hedge Fund Style Strategy
Concept: Create positions where overall delta (price sensitivity) is near zero, focusing on volatility instead of direction.
Example: Combine futures and options to balance exposure.
Secret Edge: Many prop desks in India use delta-neutral positions with high leverage to scalp volatility.
3.6 Bank Nifty Weekly Options: The Retail Goldmine
Why Bank Nifty? It has the highest liquidity and volatility.
Secret Trick: Institutions often sell far out-of-the-money (OTM) options to collect premiums, while retail traders chase cheap options.
How to win: Instead of buying OTM lottery tickets, adopt option-selling strategies with strict risk management.
3.7 “Event-Based Futures Arbitrage”
Concept: Price discrepancies often exist between cash and futures markets during dividend announcements, stock splits, or mergers.
Secret Edge: Advanced traders arbitrage these mispricings for near risk-free profits.
3.8 “Sectoral Rotational Strategies”
How it works: Track which sector index (Nifty IT, Nifty Pharma, Nifty Bank) is gaining momentum.
Secret Edge: Derivatives allow leveraged plays on sectors, amplifying returns during sectoral bull runs.
Chapter 4: Institutional Secrets That Retail Misses
Institutions and proprietary trading desks in India use strategies hidden from retail eyes.
4.1 Options Writing Dominance
Data shows institutions and HNIs are net option sellers, while retail is usually on the buying side. Sellers win most of the time due to time decay (theta).
4.2 Smart Order Flow Analysis
Institutions use algorithms to analyze open interest (OI) buildup. For example:
Rising OI with price rise → Long buildup.
Rising OI with price fall → Short buildup.
Retail often ignores these signs.
4.3 Implied Volatility Arbitrage
Big players monitor volatility skews between Nifty and Bank Nifty, or between weekly and monthly contracts. They profit from mispriced options that retail never notices.
Chapter 5: Risk Management – The True Secret to Longevity
No matter how powerful your strategy, risk management is the real differentiator.
5.1 The 2% Rule
Never risk more than 2% of capital on a single trade.
5.2 Stop-Loss Discipline
Options can go to zero, but a stop-loss saves you from portfolio collapse.
5.3 Position Sizing
Institutions diversify across indices, stocks, and expiries to avoid overexposure. Retail traders should do the same.
Conclusion
Derivatives in India present unparalleled opportunities for those who know how to use them wisely. The secret strategies for massive returns aren’t really about exotic formulas—they’re about understanding volatility, market psychology, institutional behavior, and risk management.
While retail traders often chase lottery-style option buying, the real winners are those who:
Sell options with discipline.
Use spreads and hedges to limit risks.
Exploit volatility and time decay.
Align trades with institutional flows.
If you want to succeed in the derivative markets of India, stop searching for shortcuts. Instead, master these strategies, respect risk, and trade with a professional mindset. The potential for massive returns is real—but only for the disciplined few.

Inflation Nightmare ContinuesHistorical Background of Inflation Crises
To understand why current inflation feels like a nightmare, it is important to examine historical episodes where inflation destroyed economies and societies:
Weimar Germany (1920s) – After World War I, Germany printed money to pay reparations and fund government expenses. Prices doubled every few days, bread became unaffordable, and savings were wiped out. This hyperinflation destroyed the middle class and sowed political instability, eventually contributing to the rise of extremism.
Latin America (1980s–90s) – Countries like Argentina, Brazil, and Peru faced chronic inflation and hyperinflation due to poor fiscal discipline, currency devaluations, and external debt crises. Entire generations learned to spend salaries within hours of being paid, knowing that prices would rise dramatically by the next day.
Zimbabwe (2000s) – Perhaps one of the most extreme cases of hyperinflation, Zimbabwe experienced annual inflation in the billions of percent. Currency became worthless, and barter trade replaced the monetary system.
Global Stagflation (1970s) – Triggered by oil shocks and loose monetary policy, the developed world faced both high inflation and high unemployment. It was a nightmare scenario for policymakers, since raising interest rates to curb inflation also deepened unemployment, while stimulating growth further fueled inflation.
These examples highlight a crucial point: inflation is not simply about rising prices; it is about the breakdown of trust in money itself. Once the population loses confidence that their currency holds value, the entire economic and social order comes under threat.
Causes of the Current Inflation Nightmare
The ongoing global inflation wave is different from past episodes in its complexity. It is not caused by a single factor, but rather a convergence of multiple structural issues:
1. Post-Pandemic Demand Surge
When COVID-19 restrictions were lifted, pent-up demand for goods, travel, housing, and entertainment surged. Households that had saved during lockdowns spent aggressively. The sudden imbalance between strong demand and limited supply triggered price spikes.
2. Supply Chain Disruptions
Even though demand came back quickly, global supply chains took years to recover. Shipping costs skyrocketed, raw material shortages became common, and semiconductor shortages crippled industries from automobiles to electronics.
3. Energy Price Shocks
Geopolitical tensions, including the Russia–Ukraine war, severely disrupted oil and natural gas supplies. Europe in particular faced skyrocketing energy bills, which filtered into the cost of everything from heating to fertilizer.
4. Food Inflation
Climate change events such as droughts, floods, and heatwaves reduced agricultural productivity. Coupled with disrupted fertilizer supply chains, global food prices surged, creating a humanitarian as well as an economic crisis.
5. Loose Monetary Policy Legacy
For over a decade, central banks in the U.S., Europe, Japan, and other advanced economies pursued ultra-low interest rates and quantitative easing to stimulate growth. This cheap money created asset bubbles and an expectation of endless liquidity. When inflation surged, central banks had to pivot sharply, but the lag effect meant prices had already spiraled.
6. Labor Market Shifts
In many countries, post-pandemic labor shortages emerged due to early retirements, changes in work preferences, or immigration restrictions. Employers raised wages to attract workers, fueling wage-price spirals.
7. Geopolitical Fragmentation
The shift toward deglobalization, reshoring, and protectionism has added to costs. When supply chains are localized for security reasons, they often become less efficient and more expensive, driving structural inflation.
How Inflation Impacts Households
For ordinary families, inflation is not an abstract economic term—it is felt in daily struggles.
Erosion of Purchasing Power: Salaries often do not keep pace with rising prices, meaning households can afford less with the same income. Groceries, fuel, school fees, and healthcare eat up larger portions of budgets.
Savings Destruction: Fixed deposits and bank savings accounts yield little compared to inflation. A 6% annual return is meaningless when inflation is 8%. This pushes households into riskier investments.
Housing Stress: Rising interest rates make mortgages costlier. Rent also rises as landlords pass on higher costs.
Psychological Toll: The constant stress of managing finances in an inflationary environment reduces consumer confidence and long-term planning. Families delay weddings, education, and retirement investments.
Impact on Businesses
Rising Input Costs: Raw materials, energy, and transportation become more expensive, squeezing margins.
Unstable Pricing: Companies face difficulties in setting long-term contracts when costs are volatile.
Debt Burden: Higher interest rates increase borrowing costs, particularly painful for small businesses.
Investment Delays: Businesses often delay expansion projects due to uncertain demand and financing conditions.
Wage Pressures: To retain talent, companies must raise wages, further driving costs upward.
This environment often results in a vicious cycle where businesses either pass on costs to consumers, fueling further inflation, or cut back on production, worsening economic stagnation.
Policy Dilemmas
Central banks and governments face a unique challenge: how to curb inflation without destroying growth.
Central Bank Tightening – Raising interest rates helps reduce demand, but also risks triggering recessions.
Fiscal Policy – Governments can subsidize food, fuel, or housing, but that adds to fiscal deficits and sometimes worsens inflation.
Supply-Side Reforms – Long-term solutions like improving infrastructure, energy independence, or agricultural productivity take time.
Communication Crisis – Policymakers struggle to maintain credibility. If the public believes central banks cannot control inflation, expectations of rising prices become self-fulfilling.
This is the nightmare scenario: monetary tools are blunt, fiscal tools are politically constrained, and structural reforms are slow.
Global Perspective
United States: Persistent wage inflation, strong consumer demand, and housing shortages make it difficult for the Federal Reserve to achieve its 2% inflation target.
Europe: Energy dependence and fragmented fiscal policies complicate the European Central Bank’s task.
Emerging Markets: Countries like India and Brazil face imported inflation through higher oil and food prices. Weaker currencies exacerbate the problem.
Developing Nations: Many African and South Asian countries face “stagflation” – high inflation with weak growth, often worsened by debt crises.
Social and Political Fallout
Inflation is not just an economic issue; it destabilizes societies:
Rising Inequality: Wealthier households with assets like real estate or equities can hedge against inflation, while the poor, who spend most income on essentials, suffer disproportionately.
Erosion of Trust in Institutions: When inflation persists, people lose faith in central banks, governments, and financial systems.
Political Populism: Inflation often fuels populist movements promising subsidies, wage increases, or price controls—measures that may worsen long-term stability.
Unrest and Protests: History shows that food and fuel inflation often sparks protests, riots, and even revolutions.
The Nightmare if Inflation Persists
If the inflation nightmare continues unchecked, the world could face:
Currency Crises in weaker economies.
Debt Defaults by heavily indebted nations unable to finance rising borrowing costs.
Global Recession triggered by aggressive rate hikes.
Social Instability as unemployment and inequality rise.
Shift in Global Power – countries that manage inflation better may emerge as new economic leaders, while others fall behind.
Possible Pathways Out
While the nightmare seems relentless, there are strategies to stabilize the situation:
Technology and Productivity Growth: Innovation can reduce costs, offsetting inflationary pressures.
Energy Transition: Moving toward renewable energy reduces vulnerability to oil and gas shocks.
Global Cooperation: Trade agreements and supply chain resilience can bring stability.
Credible Monetary Policy: Central banks must maintain independence and act decisively to anchor expectations.
Targeted Fiscal Support: Protecting vulnerable households while maintaining overall fiscal discipline.
Conclusion
Inflation is more than rising prices—it is an erosion of stability, trust, and prosperity. When it becomes entrenched, it threatens not just economies but the very fabric of societies. Today’s inflationary pressures are unique in their complexity, fueled by supply shocks, geopolitical tensions, and structural economic changes. The nightmare continues because solutions are neither simple nor immediate.
Yet, history also shows that inflationary crises can be overcome with credible policies, innovation, and resilience. The real challenge lies in balancing short-term sacrifices with long-term stability. If policymakers and societies fail to rise to this challenge, the inflation nightmare will not just continue—it may define the economic future of an entire generation.
Institutional Trading Strategies1. Understanding Institutional Trading
Institutional trading refers to trading executed by large organizations, which can move millions or billions of dollars in assets. Unlike retail traders, institutions face unique challenges:
Liquidity impact: Large trades can move markets significantly.
Market timing: Buying or selling at the wrong time can trigger price slippage.
Regulatory considerations: Compliance with SEC or SEBI regulations, insider trading rules, and disclosure requirements.
Information asymmetry: Institutions often have access to research and proprietary data unavailable to retail traders.
Because of these factors, institutions adopt strategies designed to minimize risk and market impact while maximizing returns.
2. Core Institutional Trading Strategies
A. Algorithmic & Quantitative Strategies
Institutions often use advanced algorithms to automate trading and exploit tiny inefficiencies.
VWAP (Volume Weighted Average Price)
Objective: Buy or sell close to the day’s average price.
Mechanics: Break large orders into smaller chunks executed over time.
Benefit: Minimizes market impact and slippage.
TWAP (Time Weighted Average Price)
Objective: Spread trades evenly over a set time.
Ideal for: Illiquid stocks or executing predictable, steady flows.
Liquidity-Seeking Algorithms
Scan multiple venues for the best prices.
Avoids pushing prices against themselves when trading large volumes.
Statistical Arbitrage
Exploits small price discrepancies between correlated securities.
Typically high-frequency, requires strong computing power.
B. Execution-Based Strategies
Focus on how to enter and exit positions efficiently without alerting the market.
Iceberg Orders
Only a small portion of the total order is visible.
Reduces market reaction while enabling execution of large trades.
Dark Pool Trading
Off-exchange venues where large trades can happen anonymously.
Reduces market impact but may have slightly less favorable pricing.
Block Trades
Very large trades negotiated privately.
Often used for institutional rebalancing, mergers, or index adjustments.
C. Directional / Market Bias Strategies
These involve taking a view on price direction but with institutional tools.
Momentum Trading
Buy assets trending up, sell assets trending down.
Often combined with quant signals to detect strong, persistent moves.
Mean Reversion
Exploit temporary price swings away from average value.
Requires sophisticated risk management for stop-losses.
Pairs Trading
Go long on one stock and short a correlated one.
Goal: Profit from relative moves while minimizing market exposure.
D. Fundamental & Event-Driven Strategies
Institutions often trade based on macro, company-specific, or event-driven catalysts.
Merger Arbitrage
Buy target stock and sell acquirer’s stock in announced mergers.
Profits from narrowing spread between deal price and market price.
Earnings Plays
Long/short positions around earnings announcements.
Often uses options for asymmetric risk-reward.
Macro Strategies
Trade based on interest rates, currency movements, commodities, or geopolitical events.
Hedge funds excel here, often using derivatives to leverage insights.
E. Index and ETF Strategies
Institutions moving large money often track or hedge index exposure.
Index Arbitrage
Exploit differences between index futures and underlying stocks.
Requires precise timing and low-latency systems.
ETF Creation/Redemption
Institutions can create or redeem ETF shares to capitalize on pricing inefficiencies.
Minimizes market exposure while arbitraging between ETF price and underlying assets.
F. Portfolio Rebalancing
Large institutions must rebalance periodically:
Quarterly/annual adjustments to match benchmarks.
Use program trading to spread trades over multiple sessions.
Incorporate risk management rules to avoid unwanted exposure.
3. Risk Management in Institutional Trading
Institutions manage risk carefully because a single trade can move millions in losses:
Position Sizing: Limit exposure per trade relative to portfolio.
Stop-Loss & Hedging: Use options, futures, or inverse ETFs.
Diversification: Across sectors, geographies, and instruments.
Liquidity Risk Control: Avoid positions that can’t be exited quickly.
4. Advantages of Institutional Trading
Access to capital for bulk trades.
Information edge through research teams.
Reduced transaction costs via negotiated fees and algorithmic efficiency.
Ability to influence market structure for advantageous execution.
5. Key Challenges
Slippage and Market Impact: Large trades can shift prices.
Regulatory Scrutiny: Must comply with reporting and trading rules.
Technology Dependency: Relies heavily on algorithms and low-latency infrastructure.
Competition: Other institutions using similar strategies can reduce alpha.
6. Examples of Institutional Trading in Practice
Mutual Funds:
Execute index rebalancing using VWAP/TWAP algorithms.
Hedge Funds:
Exploit statistical arbitrage, pairs trading, and macro events.
Investment Banks:
Facilitate block trades and ETF arbitrage for clients.
Pension Funds:
Focus on long-term rebalancing and risk-controlled investments.
In summary: Institutional trading is about strategically moving large amounts of capital while controlling risk, minimizing market impact, and exploiting both structural and event-driven opportunities. Their success lies in technology, research, execution discipline, and risk management rather than guessing market direction.
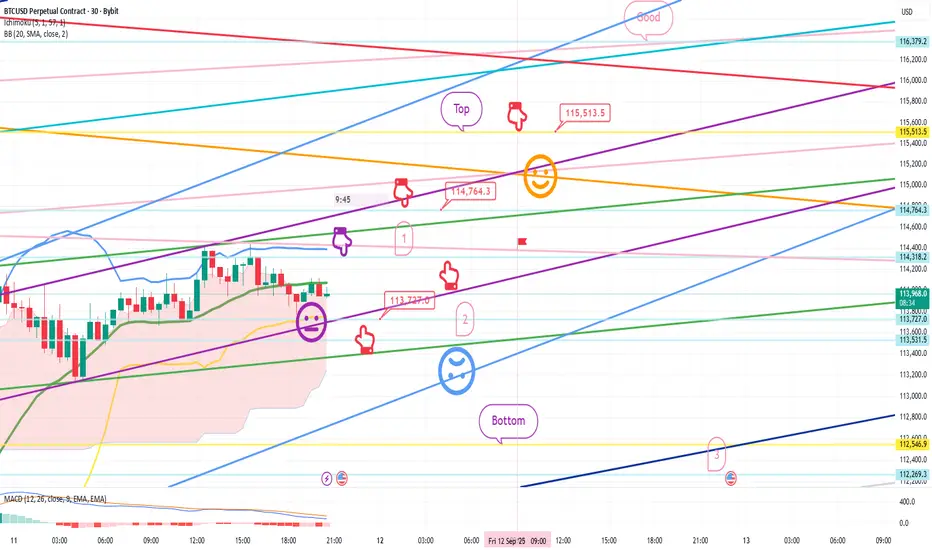
EMA vs SMA vs WMA: Which Moving Average Should You Use?🔎 Intro / Overview
Moving Averages remain one of the most trusted tools in technical analysis. They smooth price action, highlight the trend, and often act as dynamic support or resistance.
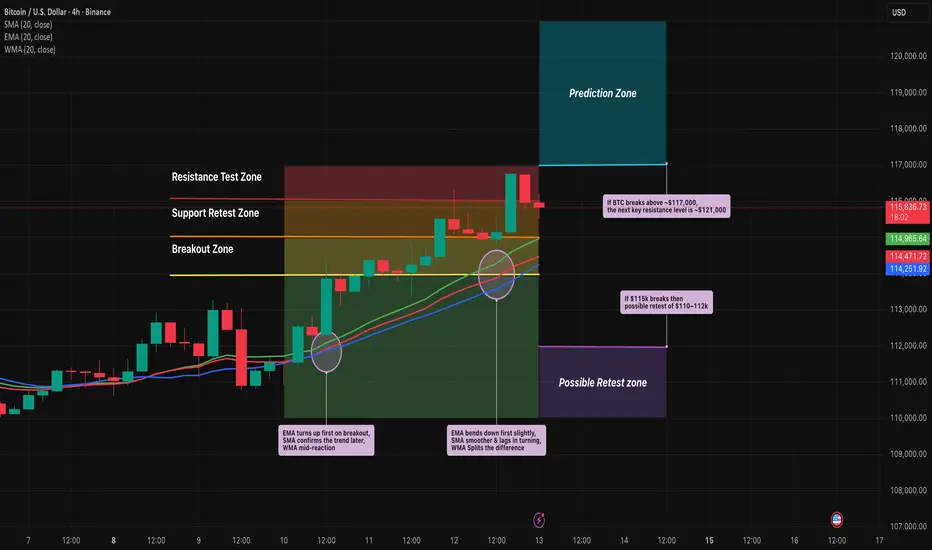
In this post, we compare the 20-period SMA, EMA, and WMA on BTCUSD 4H to show how each reacts differently to market moves.
___________________________________________________________
📔 Concept
SMA (Simple Moving Average): Every candle in the lookback is weighted equally → smooth but slower to react.
EMA (Exponential Moving Average): Recent candles carry more weight → reacts faster, hugs price closely.
WMA (Weighted Moving Average): Linear weighting → a balance between SMA’s stability and EMA’s sensitivity.
The difference lies in responsiveness. Faster averages react early but risk false signals, slower averages confirm trends but lag.
___________________________________________________________
📌 How to Use
1️⃣ Plot the 20-period SMA, EMA, and WMA together.
2️⃣ Watch how each responds during pullbacks, rallies, and consolidations.
3️⃣ Use EMA for quicker signals, SMA for smoother long-term view, and WMA if you prefer a middle ground.
4️⃣ Combine with price action or RSI to avoid relying on moving averages alone.
___________________________________________________________
🎯 Trading Plan
Intraday traders: EMA crossovers (e.g., 9 vs 21 EMA) for faster entries and exits.
Swing traders: SMA for identifying trend direction and major support/resistance.
Balanced traders: WMA for medium-term setups where stability and responsiveness matter equally.
Always align the moving average with your trading style and risk appetite.
___________________________________________________________
📊 Chart Explanation
On BTCUSD 4H:
EMA (red) bent upward first during the $114k breakout, SMA (blue) confirmed later, and WMA (green) sat between them.
At the $115k retest, EMA dipped first, while SMA lagged.
At $116.5–117k resistance, EMA whipsawed but SMA stayed smoother.
Notice how these differences become clear during sharp pullbacks, quick rallies, and sideways ranges.
___________________________________________________________
👀 Observation
EMA is quick but noisy ⚡, SMA is calm but late 🕰️, WMA strikes a middle ground ⚖️.
___________________________________________________________
❗ Why It Matters?
Choosing the right moving average impacts how quickly you spot entries, confirm trends, and manage stop-losses. Understanding the differences helps traders adapt strategies to both trending and sideways markets.
___________________________________________________________
🎯 Conclusion
No single moving average is “best.” Each serves a purpose depending on the timeframe and style of trading. The key is consistency — choose one that aligns with your plan, test it, and apply it with discipline.
👉 Which one do you prefer in your trading — EMA, SMA, or WMA?
___________________________________________________________
⚠️ Disclaimer
📘 For educational purposes only ·
🙅 Not SEBI registered ·
❌ Not a buy/sell recommendation ·
🧠 Purely a learning resource ·
📊 Not Financial Advice
5 Defensive & Growth Sectors Perfect for Dip Buying1. Pharmaceuticals & Healthcare
Why It’s Defensive
Healthcare is a necessity, not a luxury. People need medicines, hospitals, and diagnostic services regardless of economic conditions. That’s why pharma and healthcare stocks are considered defensive – they remain resilient even during recessions, global slowdowns, or financial crises.
For example, during the COVID-19 crash of March 2020, while many sectors collapsed, pharma stocks quickly recovered and even surged due to global demand for medicines, vaccines, and hospital services.
Why It’s Growth-Oriented
Rising global healthcare spending: Aging populations in developed countries and increasing middle-class income in emerging markets boost demand.
Innovation in biotech & generics: Indian pharma companies are global leaders in generic drugs and are expanding into biosimilars, CRAMS (Contract Research and Manufacturing Services), and specialty medicines.
Telemedicine & digital health: Healthcare is undergoing digital transformation, creating new growth avenues.
Dip Buying Opportunities
Pharma stocks often face sharp corrections due to regulatory concerns, USFDA observations, or temporary pricing pressures. These dips are usually opportunities because:
Core demand for healthcare doesn’t vanish.
Once regulatory issues are resolved, stocks bounce back strongly.
Defensive nature ensures limited downside risk.
Example: Sun Pharma, Dr. Reddy’s, and Cipla often correct 15–20% due to quarterly margin pressures, but these are great accumulation zones for long-term investors.
Investment Strategy
Focus on large-cap pharma for stability and mid-cap specialty companies for higher growth.
Accumulate in phases during 10–20% marketwide corrections.
Diversify across hospitals, diagnostics, and pharma manufacturing for balanced exposure.
2. FMCG (Fast-Moving Consumer Goods)
Why It’s Defensive
FMCG companies sell essentials – food, beverages, personal care, and household products. Even in recessions, people continue buying soaps, biscuits, and packaged goods. This makes FMCG stocks highly resilient.
Historically, FMCG stocks like Hindustan Unilever (HUL), Nestlé, and Dabur have delivered steady returns regardless of market cycles. Their low volatility and strong brand loyalty make them classic defensive plays.
Why It’s Growth-Oriented
Rural consumption growth: Government spending on infrastructure and rising rural incomes increase demand for everyday goods.
Premiumization: Consumers are upgrading from basic to premium products.
Export opportunities: Many Indian FMCG firms are expanding into Southeast Asia, Africa, and the Middle East.
E-commerce & D2C channels: Online retail is boosting FMCG distribution and margins.
Dip Buying Opportunities
FMCG stocks rarely see sharp falls, but when markets correct heavily, they too trade at attractive valuations. These dips are perfect to accumulate:
High dividend yields add to returns.
Sector is less affected by inflation and currency swings.
Low-beta nature reduces portfolio volatility.
Example: ITC was ignored for years due to regulatory risks in its cigarette business, but patient investors who accumulated during dips saw multi-fold returns once FMCG growth kicked in.
Investment Strategy
Look for market leaders with strong distribution networks.
FMCG works best for long-term compounding, so use SIP-style accumulation.
Mix large brands (HUL, Nestlé) with emerging challengers (Marico, Emami).
3. Information Technology (IT) & Digital Services
Why It’s Defensive
At first glance, IT may not seem defensive, but global outsourcing and digitization trends provide resilience. Indian IT companies like TCS, Infosys, and HCL Tech derive a majority of revenues from recurring service contracts with global clients, ensuring steady cash flows.
Even during global slowdowns, IT spending often shifts from discretionary projects to cost-saving digital initiatives – keeping demand steady.
Why It’s Growth-Oriented
Digital transformation: Cloud computing, AI, data analytics, and cybersecurity are high-growth areas.
Global outsourcing demand: Companies worldwide seek cost efficiency, benefiting Indian IT firms.
New-age verticals: FinTech, healthtech, and e-commerce drive additional IT services demand.
High free cash flow: IT majors regularly return cash to shareholders through buybacks and dividends.
Dip Buying Opportunities
IT is cyclical and often corrects sharply when:
The US or Europe signals a slowdown.
Clients cut IT budgets temporarily.
Currency fluctuations impact quarterly results.
But these dips are ideal for accumulation because long-term demand for digitization is irreversible.
Example: During 2022, IT stocks corrected 30–40% due to global slowdown fears. Investors who accumulated Infosys and TCS during the correction are sitting on solid gains as digital spending picked up again.
Investment Strategy
Large-caps for stability (TCS, Infosys).
Mid-cap IT for higher growth (LTIMindtree, Persistent Systems).
Accumulate during 20–30% corrections in IT index.
Avoid chasing small-cap IT unless fundamentals are strong.
4. Banking & Financial Services
Why It’s Defensive
Banking is the backbone of any economy. Regardless of cycles, credit, deposits, and payments continue. In India, the financialization of savings and increasing credit penetration make banking a structural growth story.
Defensive elements include:
Strong regulatory framework by RBI.
Essential role in supporting all other industries.
Diversification across retail, corporate, and digital lending.
Why It’s Growth-Oriented
Credit expansion: India’s credit-to-GDP ratio is still low compared to global averages, leaving massive room for growth.
Digital finance: UPI, fintech partnerships, and mobile banking expand customer reach.
Insurance & asset management: BFSI sector is diversifying into wealth management and insurance.
Consolidation: Strong banks gain market share when weaker NBFCs or PSU banks face stress.
Dip Buying Opportunities
Banking stocks are volatile due to:
Rising interest rate cycles.
NPA concerns.
Global macroeconomic risks.
But dips often reverse quickly because banking demand is long-term.
Example: In 2020, HDFC Bank corrected sharply due to lockdown fears, but within a year, it made new highs as loan growth revived. Similarly, SBI’s turnaround post-2018 NPA cycle rewarded patient investors.
Investment Strategy
Private banks (HDFC Bank, ICICI Bank) for stability.
Select PSU banks (SBI, Bank of Baroda) during dip cycles.
NBFCs like Bajaj Finance for higher growth.
Accumulate gradually since BFSI can be volatile.
5. Energy & Power (with Renewable Focus)
Why It’s Defensive
Energy is a basic necessity. Industries, households, and transportation all rely on it. Demand for electricity, fuel, and energy infrastructure rarely collapses, making this sector defensive.
Why It’s Growth-Oriented
Renewable revolution: Solar, wind, and green hydrogen are the future, creating massive growth opportunities.
Government push: India targets net-zero emissions by 2070, meaning long-term policy support.
Rising demand: India’s power consumption grows consistently with urbanization and industrialization.
Energy diversification: Companies are shifting from traditional coal-based power to renewables, ensuring sustainability.
Dip Buying Opportunities
Energy and power stocks often correct due to:
Regulatory tariff changes.
Fuel cost fluctuations.
Global crude oil price swings.
But long-term demand remains intact, making dips valuable entry points.
Example: NTPC and Tata Power corrected during coal price hikes but bounced back as renewable capacity additions boosted valuations.
Investment Strategy
Balance between traditional leaders (NTPC, Power Grid) and renewable-focused players (Adani Green, Tata Power).
Accumulate during dips linked to global crude swings.
Long-term horizon needed, as renewable projects take time to scale.
How to Approach Dip Buying in These Sectors
Phased Buying: Don’t invest all at once. Break your investment into tranches and buy during market-wide or sector-specific corrections.
Valuation Discipline: Even defensive sectors can be overvalued. Wait for P/E multiples to come back to reasonable levels.
Diversification: Spread investments across all five sectors to balance risk and growth.
Use ETFs/Mutual Funds: If stock-picking is tough, sectoral ETFs or actively managed funds provide easier access.
Stay Patient: Dip buying works when you hold through recovery cycles. Avoid panic selling.
Conclusion
Market dips are uncomfortable but essential for building wealth. Instead of fearing corrections, smart investors use them to accumulate quality sectors. The five sectors we discussed – Pharma & Healthcare, FMCG, IT & Digital Services, Banking & Financials, and Energy with Renewables – combine the best of both worlds: resilience during downturns and strong growth potential during expansions.
By adopting a disciplined dip-buying approach, investors can build a portfolio that not only weathers volatility but also compounds steadily over time. Remember, corrections are temporary, but the growth stories of these defensive sectors are structural and long-term.
If you position yourself well, every market dip can become your wealth-building opportunity.

Part 9 Trading Master ClassHow Options Work in Practice
Option buyers have limited risk (premium paid) but unlimited profit potential (in calls if stock rises, in puts if stock falls).
Option sellers have limited profit (premium received) but potentially unlimited risk.
This asymmetric payoff structure creates a market where traders, hedgers, and institutions interact.
Key Concepts
Intrinsic Value: Real profit if exercised immediately.
Time Value: Premium paid for potential future movement.
In-the-Money (ITM): Option already profitable if exercised.
Out-of-the-Money (OTM): Option has no intrinsic value, only time value.
At-the-Money (ATM): Strike = current market price.
Why Traders Use Options
Hedging – Protect portfolio against price swings.
Speculation – Bet on future price movements with smaller capital.
Income Generation – Sell options and earn premiums.
Arbitrage – Exploit mispricing between spot and derivatives.
Options Pricing Models
Two main models:
Black-Scholes Model: Uses volatility, strike, expiry, and interest rates to price options.
Binomial Model: Breaks time into steps, considering probability of price moves.
Factors affecting option prices:
Spot price of underlying
Strike price
Time to expiry
Volatility
Interest rates
Dividends

Part 7 Trading Master Class Why Traders Use Options
Hedging – Protect portfolio against price swings.
Speculation – Bet on future price movements with smaller capital.
Income Generation – Sell options and earn premiums.
Arbitrage – Exploit mispricing between spot and derivatives.
Options Pricing Models
Two main models:
Black-Scholes Model: Uses volatility, strike, expiry, and interest rates to price options.
Binomial Model: Breaks time into steps, considering probability of price moves.
Factors affecting option prices:
Spot price of underlying
Strike price
Time to expiry
Volatility
Interest rates
Dividends
Strategies in Option Trading
Options allow creation of custom payoff structures. Strategies are classified as:
A. Protective Strategies
Protective Put – Holding stock + buying put (like insurance).
Covered Call – Holding stock + selling call.
B. Income Strategies
Iron Condor – Selling OTM call & put, buying further OTM options.
Strangle/Straddle Selling – Profit from time decay when market is range-bound.
C. Speculative Strategies
Long Straddle – Buy ATM call + put, profit from big moves.
Bull Call Spread – Buy lower strike call, sell higher strike call.
Bear Put Spread – Buy higher strike put, sell lower strike put.
📊 Each strategy has its risk/reward profile. Professional traders combine them depending on market conditions.

BITCOIN CRASH PREDICTIONAs per the chart pattern of Bitcoin USD Chart, there is a possibility of a downtrend and crash in bitcoin till 80k levels as major order blocks are pending on Daily / Weekly / Monthly charts. With a stop loss of 118234, a short position can be initiated for a target of 107000 short term of 2 weeks and up to 80k in long term of 6 months to 1 year.

UNOMINDA Price ActionUNO Minda Ltd is trading at ₹1,282 as of September 12, 2025, delivering consistent financial and operational outperformance. For FY25, the company posted consolidated revenue of ₹16,775 crore, up 20% year-on-year, with net profit rising 9% to ₹936 crore. EBITDA grew 18% to ₹1,800 crore, and operating margins remain stable at 10.7%. Recent quarterly profit after tax is ₹289 crore, and EPS for the last twelve months stands at ₹13.97.
Expansion in premium switches, alloy wheels, lighting, sensors, sunroof products, and emerging EV technologies has bolstered top-line growth. Strategic projects—including new capacities for four-wheeler EV components and ADAS products—support a robust future pipeline, while strong cash flows enable ongoing fundraising and project commissioning.
Valuation remains at a premium to the sector, with trailing P/E around 79, price-to-book of 13, and price-to-sales ratio of 4.2, reflecting leadership in innovation and rapid growth. Return on capital employed is healthy at 15.7%, and debt remains modest, sustaining investor and institutional confidence. Technically, the stock is just below its 52-week high and continues to outperform broad market indices, maintaining an upward momentum trend.
Promoter and institutional holding are stable, affirming long-term commitment, and a final dividend of ₹1.50 per share was declared for FY25, rewarding shareholders alongside growth investments. UNO Minda’s medium- and long-term outlook remains highly constructive, anchored by strong financials, prudent capital allocation, innovative leadership, and a resilient growth trajectory.
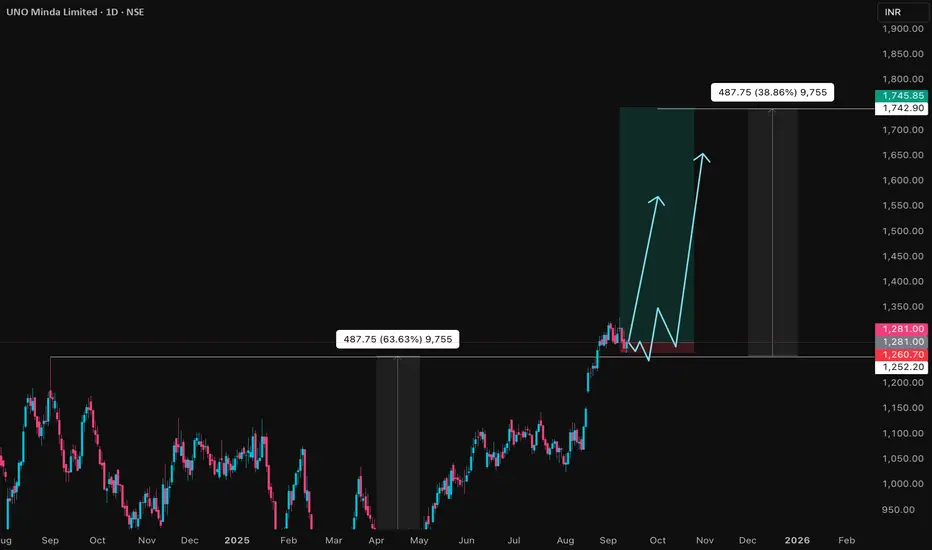
NIFTY Daily – Potential Cup-and-Handle Breakout
Nifty 50 has been carving out a textbook cup-and-handle formation over the past several months. Price is now pressing toward the neckline zone near 25,810 (Sep’24 monthly high)
Supports: 24,430 (Sep opening week) remain pivotal levels for any pullback.
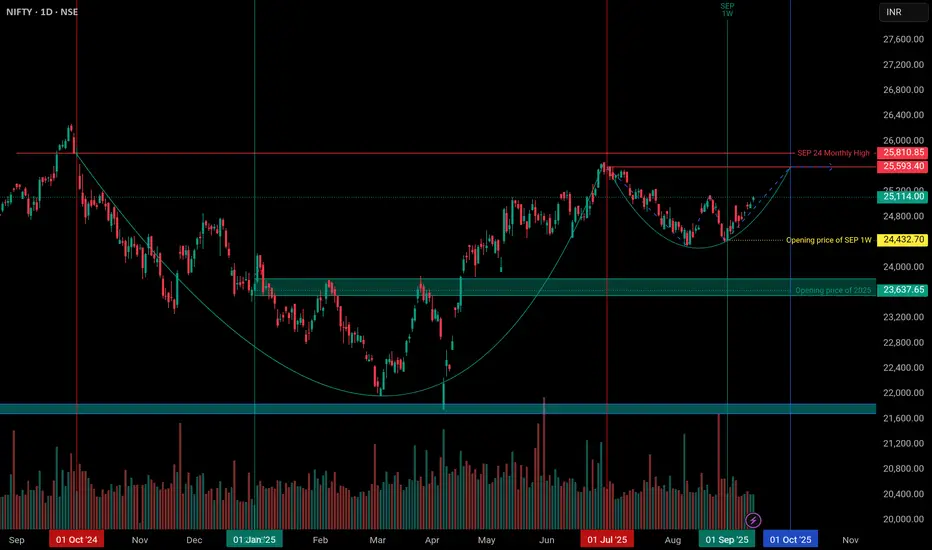
NIFTY 1D Time frame🔢 Current Level
NIFTY ~ 25,114
🔑 Key Resistance & Support Levels
Resistance Zones:
~ 25,200 – 25,250 (near-term resistance)
~ 25,400 – 25,500 (stronger resistance if it breaks above the first zone)
Support Zones:
~ 24,950 – 25,000 (immediate support)
~ 24,800 – 24,900 (short-term support)
~ 24,600 – 24,700 (deeper support, in case of downside move)
📉 Outlook
Bullish Scenario: If NIFTY holds above ~25,000 and clears ~25,250, it may head toward ~25,400-25,500.
Bearish Scenario: If it drops below ~24,950, then weakness may drag it toward ~24,800 or lower supports.
Neutral / Range: Between ~25,000 – 25,250 likely consolidation until a decisive move.
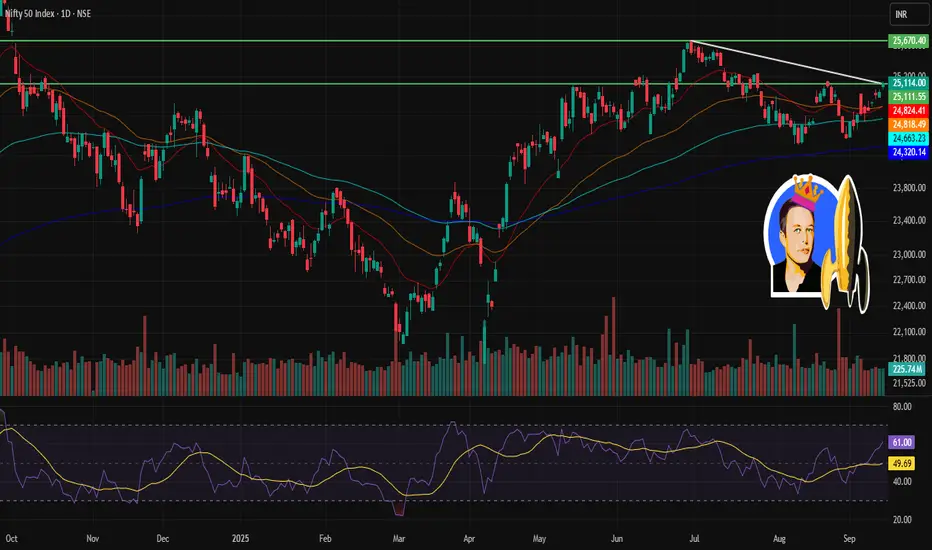
BAJFINANCE 1D Time frameCurrent Market Situation
Bajaj Finance is trading around ₹1003 in the daily chart. This level is very important because the stock has just touched its 52-week high near ₹1005. On the lower side, today’s support level is around ₹970 – ₹975, which is also close to the previous closing price.
The overall trend in the daily chart is strongly bullish, meaning buyers are in control right now.
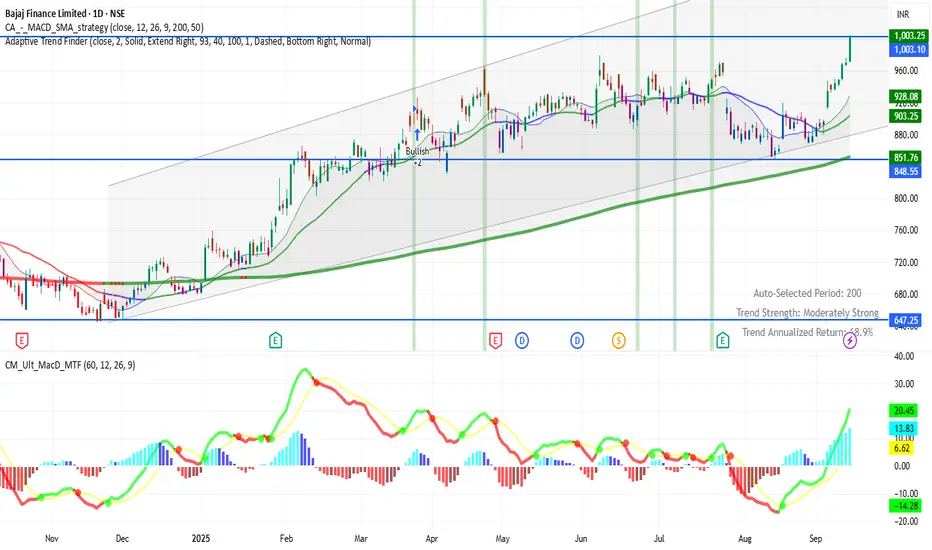
Bitcoin Bybit chart analysis September 11 (CPI)Hello
It's a Bitcoin Guide.
If you "follow"
You can receive real-time movement paths and comment notifications on major sections.
If my analysis was helpful,
Please click the booster button at the bottom.
This is Bitcoin's 30-minute chart.
The CPI indicator will be released shortly at 9:30 AM.
I implemented the strategy based on Nasdaq movements.
*When the red finger moves,
Long position strategy
Confirm the upward wave by touching the first section above (autonomous shorting)
1. $113,727 long position entry point / Stop loss if the light blue support line is broken
2. $114,764.3 long position 1st target -> Top 2nd -> Good 3rd target
If the daily candlestick forms before 9:00 AM tomorrow,
you can switch to a short position if the top section is touched.
You can also use the first section shown as a long position switching point.
If the price falls immediately without touching the purple finger at the top, the final long position is at the second level. The strategy was to place a stop-loss order from the breakout of the light blue support line until the possibility of a sideways movement.
From the breakout of the light blue support line, the price opens up to the bottom -> level 3, so long positions should be cautious.
Please use my analysis to this point for reference only.
I hope you operate safely, adhering to principled trading and a stop-loss order.
Thank you.