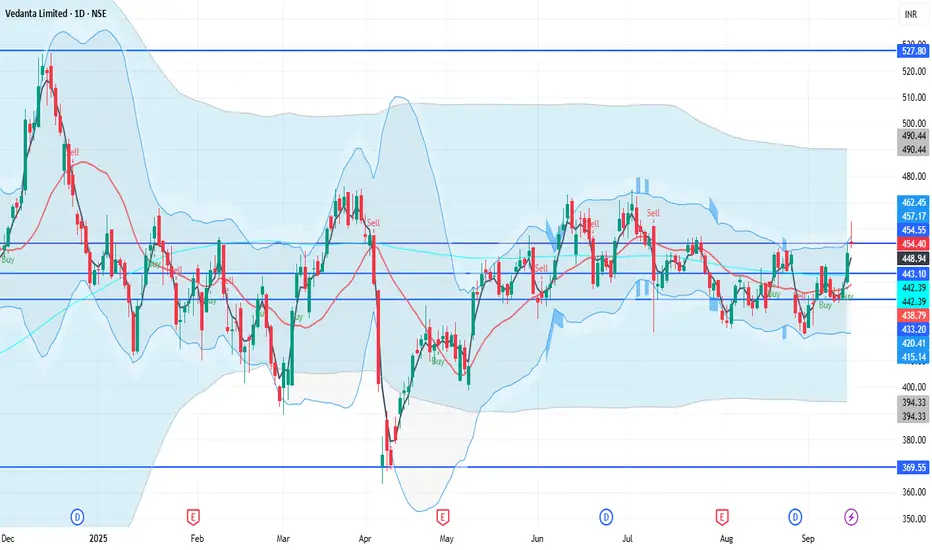
VEDL 1D Time frameCurrent Price
₹454.20
🔹 Market Snapshot
Day’s Range: ₹454.15 – ₹462.80
Previous Close: ₹450.90
52-Week Range: ₹363.00 – ₹526.95
Market Cap: ₹1.80 lakh crore
P/E Ratio (TTM): 12.37
P/B Ratio: 4.81
Dividend Yield: 9.44%
Book Value per Share: ₹95.87
EPS (TTM): ₹37.25
Community ideas
Nifty - Expiry Day Analysis Sep 16Price is moving within the range 25000 - 25150. We got choppy moves in this area as there is no trend strength. Price has to bounce from the 25040 level or have to break 25150 with strength to continue the bullish trend. Otherwise, we will get a range move.
Buy above 25040 with the stop loss of 24990 for the targets 25080, 25120, 25160, and 25220.
Sell below 24940 with the stop loss of 24990 for the targets 24900, 24860, 24820, and 24740.
Expected expiry day range is 24950 to 25240.
Always do your analysis before taking any trade.

HDFCBANK 1D Time framePrice Action
Current Price: ₹967.10 (approx)
Day’s Range: ₹965 – ₹970
52-Week Range: ₹806.50 – ₹1,018.85
🔹 Support & Resistance
Immediate Support: ₹960 – ₹958
Next Support: ₹954 – ₹950
Immediate Resistance: ₹970 – ₹975
Higher Resistance: ₹980

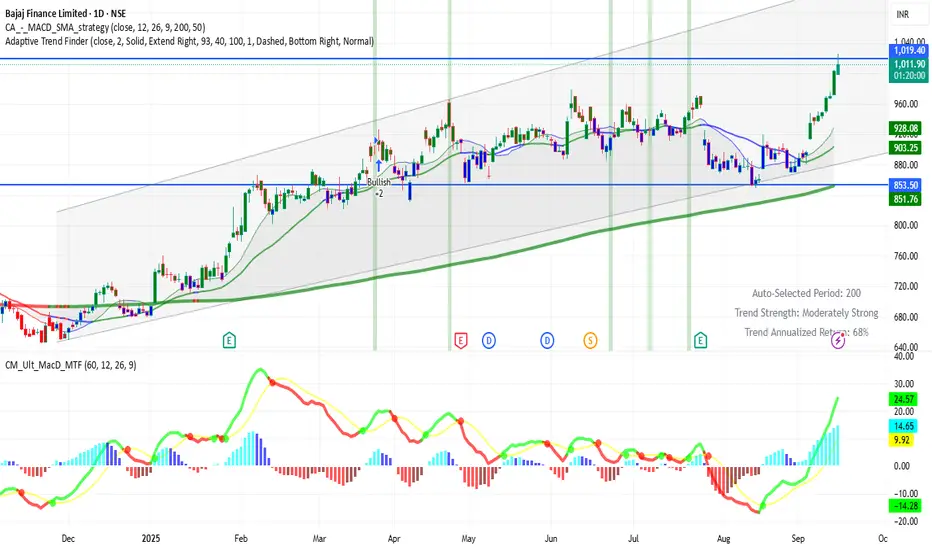
BAJFINANCE 1D Time frame
Current Price: ₹1018 (approx)
Day’s Range: ₹998 – ₹1,025.70
Previous Close: ₹970.25
🔹 Support & Resistance
Support 1: ₹981 – ₹960
Support 2: ₹947 – ₹934
Resistance 1: ₹1,030
Resistance 2: ₹1,049
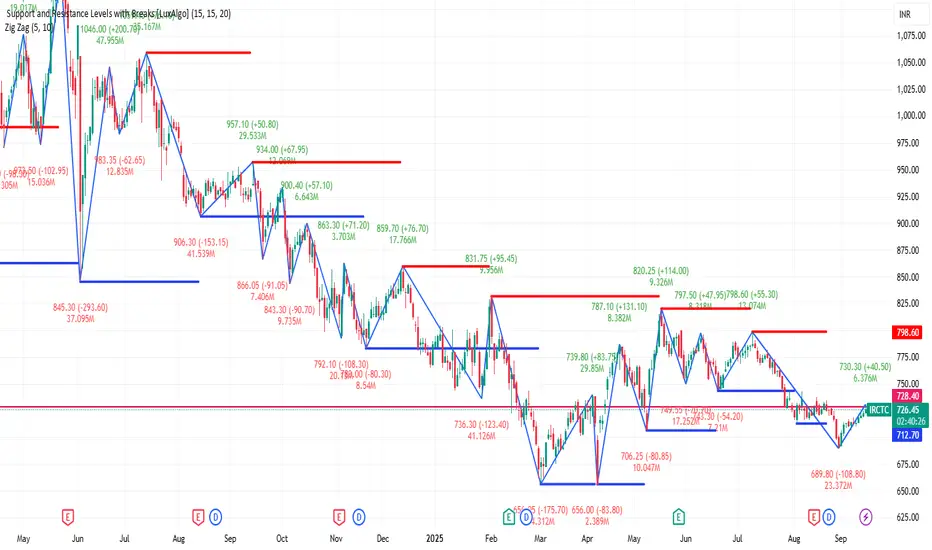
IRCTC 1D Time frameCurrent Price
₹728.65
🔹 Market Snapshot
Day’s Range: ₹722.55 – ₹730.30
Previous Close: ₹722.95
52-Week Range: ₹656.00 – ₹957.10
Market Cap: ₹57,776 crore
P/E Ratio (TTM): 44.33
P/B Ratio: 15.91
Dividend Yield: 0.00%
EPS (TTM): ₹16.44
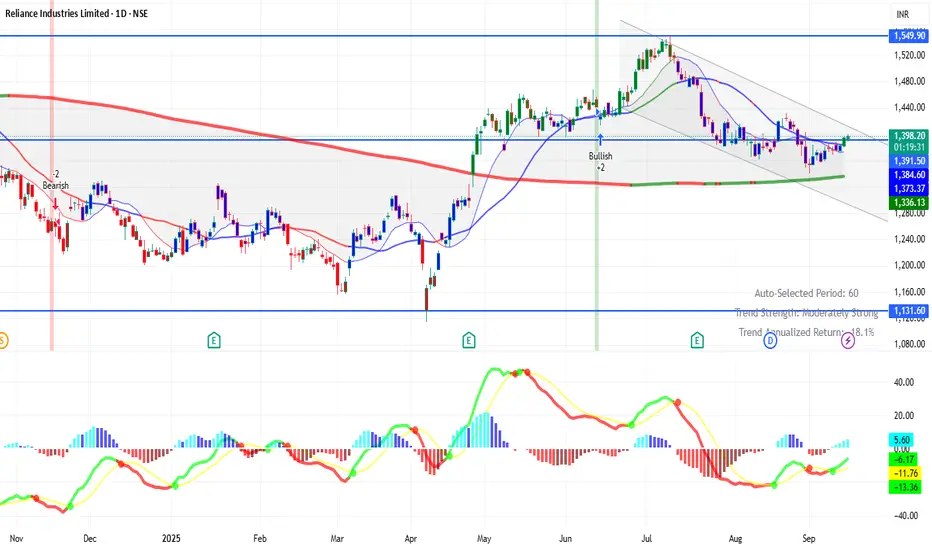
RELIANCE 1D Time framePrice Action
Current Price: ₹1,392 – ₹1,395 (approx)
Previous Close: ₹1,383.50
52-Week Range: ₹1,114.85 – ₹1,551.00
🔹 Support & Resistance
Immediate Support: ₹1,385 – ₹1,375
Next Support: ₹1,369
Immediate Resistance: ₹1,400 – ₹1,406
Next Resistance: ₹1,417
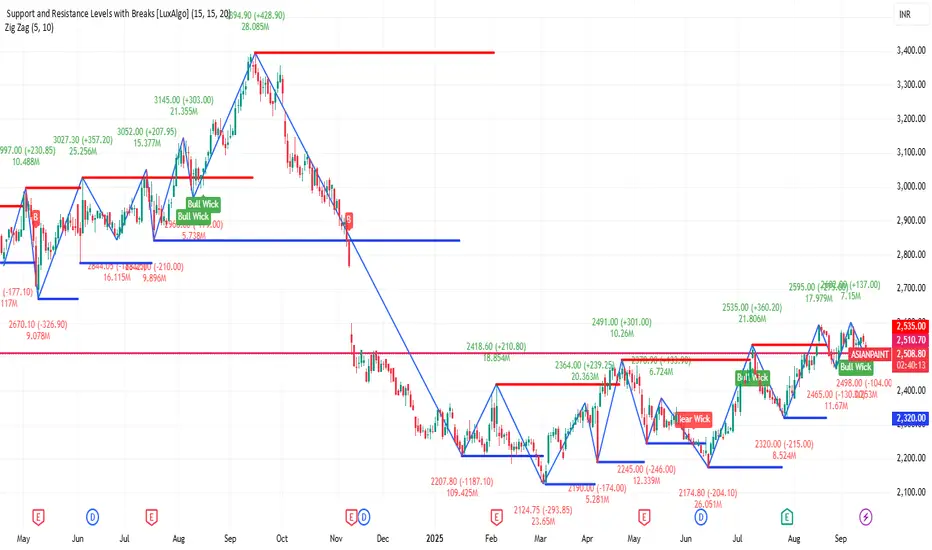
ASIANPAINT 1D Time frameToday's Trading Range:
Day's Range: ₹2,498.00 – ₹2,543.50
Opening Price: ₹2,535.10
Previous Close: ₹2,540.50
52-Week Range: ₹2,124.75 – ₹3,394.90
📈 Circuit Limits:
Upper Circuit Limit: ₹2,800.90
Lower Circuit Limit: ₹2,291.70
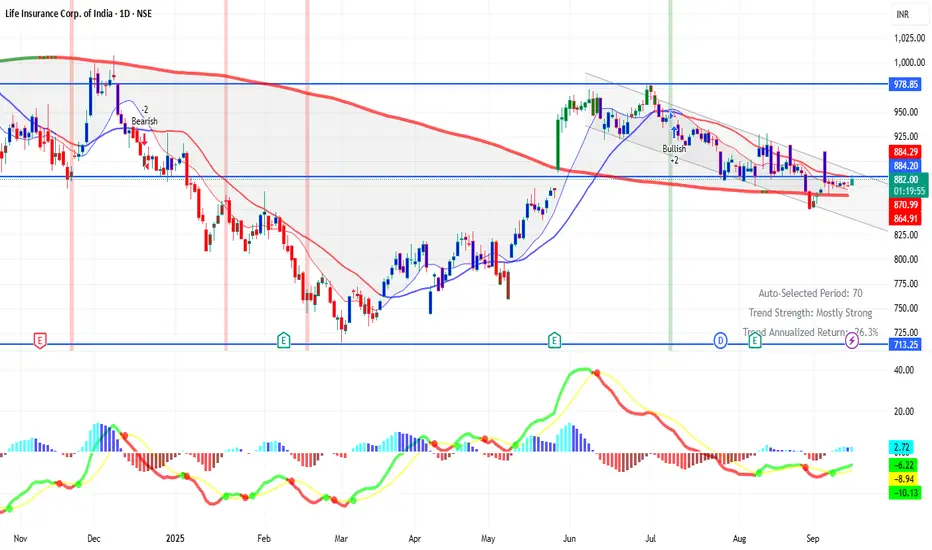
LICI 1D Time framePrice Action
Current Price: ₹882.50 (approx)
52-Week Range: ₹715.30 – ₹1,048.90
P/E Ratio: ~11.4
Book Value per Share: ~₹200+
🔹 Support & Resistance
Strong Support: ₹800 – ₹830
Immediate Resistance: ₹860 – ₹900
Next Resistance (medium-term): ₹1,000+
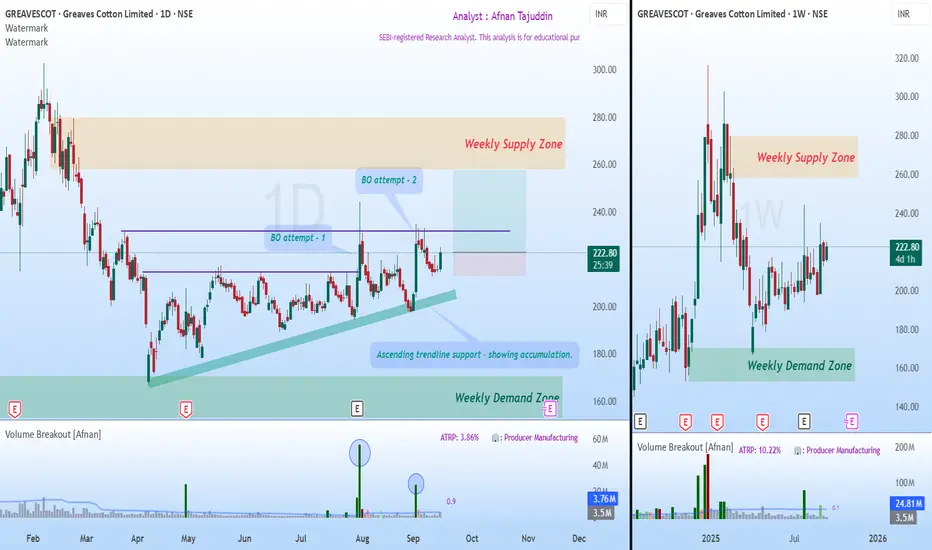
Accumulation and a Possible Breakout Towards Weekly Supply📈 Market Trend and Structure 📈
After forming an all-time high, price began its decline and developed a weekly supply zone . This supply zone now stands as the major target area for buyers.
Following the decline, price touched the weekly demand zone , which acted as a powerful reversal point . As supply-demand traders, this gave us a strong indication of the probable bottom.
From there, price recovered and moved into a phase of sideways consolidation , reflecting the tug of war between buyers and sellers.
⚡ Breakout Attempts and Trendline Support ⚡
During this consolidation, price attempted two breakouts with strong volumes . Both times, sellers stepped in aggressively at the horizontal resistance line.
Buyers, however, showed resilience by consistently defending an ascending trendline . This steady support is a sign of accumulation and growing demand.
Recently, price and volume contracted , forming an inside candle —a balance between buyers and sellers.
Today, this inside candle was broken to the upside, which could make this third breakout attempt successful.
🎯 Trading Plan 🎯
Bias: Bullish continuation.
Entry Trigger: Two previous breakout attempts + today’s breakout of the inside candle.
Target: Weekly supply zone.
Stop Loss: Below the previous swing low.
Risk-to-Reward: Approximately 1:3, a favorable setup.
✨ In Short : Sellers are still active near horizontal resistance, but buyers are showing greater strength at higher lows. The breakout of today’s inside candle tilts the balance towards buyers, making this the most promising pre-breakout setup so far.
🚀💡 “In trading, patience to wait and courage to act make all the difference.”
Lastly, Thank you for your support, your likes & comments. Feel free to ask if you have questions.
⚡ Stay disciplined, trade smart, and let the charts guide your story! 📊✨
This analysis is purely for educational purposes and is not intended as a trading or investment recommendation. I am not a SEBI registered Analyst.
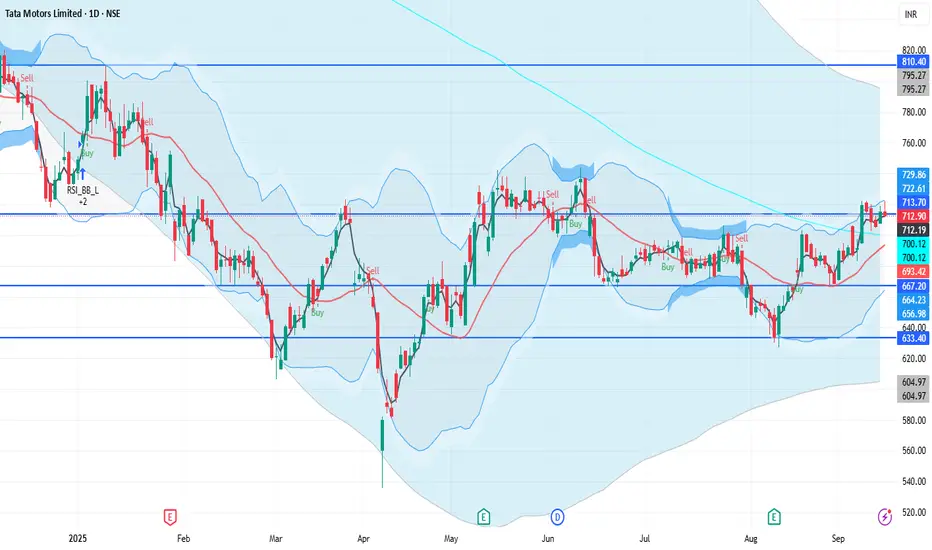
TATAMOTORS 1D Time frameUpdated Snapshot
Current Price: ₹712 – ₹715
Day’s Range: ₹712 – ₹721.95
Previous Close: ₹705.85
🔹 Support & Resistance
Support 1: ₹710 – ₹708
Support 2: ₹700 – ₹705
Resistance 1: ₹721 – ₹725
Resistance 2: ₹735 – ₹740
bankniftyI feel that bank nifty and axis bank has shown good recovery in the past two weeks. With axis bank closing over 200 dma and with strong gains for last three days, the momemtum should continue. Good time to buy for investors and traders as one can go positionally long here with targets of 1140 and 1220 on axis bank. no stoploss for nifty large cap stocks for investors.

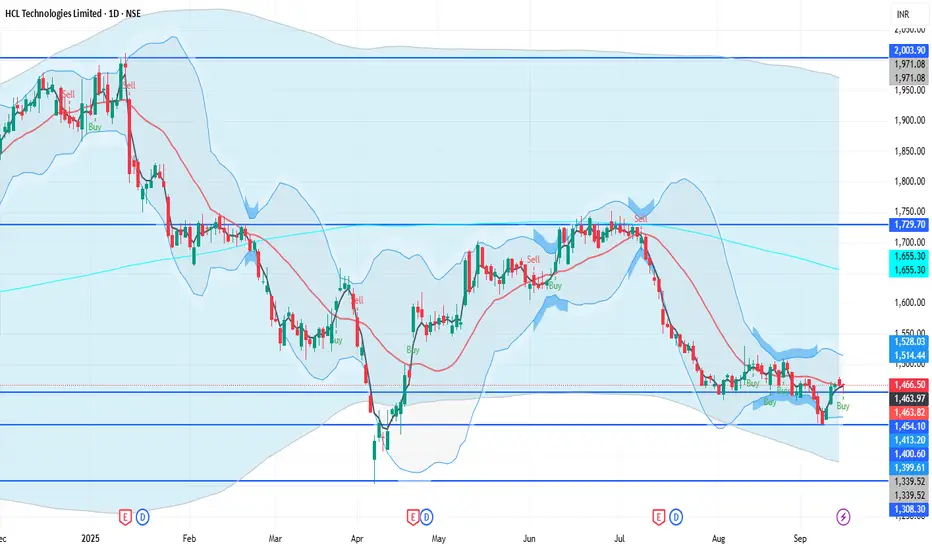
HCLTECH 1D Time frameUpdated Snapshot
Current Price: ₹1,466
Day’s Range: ₹1,452 – ₹1,467
Previous Close: ₹1,467.20
🔹 Support & Resistance
Support 1: ₹1,452 – ₹1,450
Support 2: ₹1,430 – ₹1,420
Resistance 1: ₹1,470 – ₹1,475
Resistance 2: ₹1,490 – ₹1,500
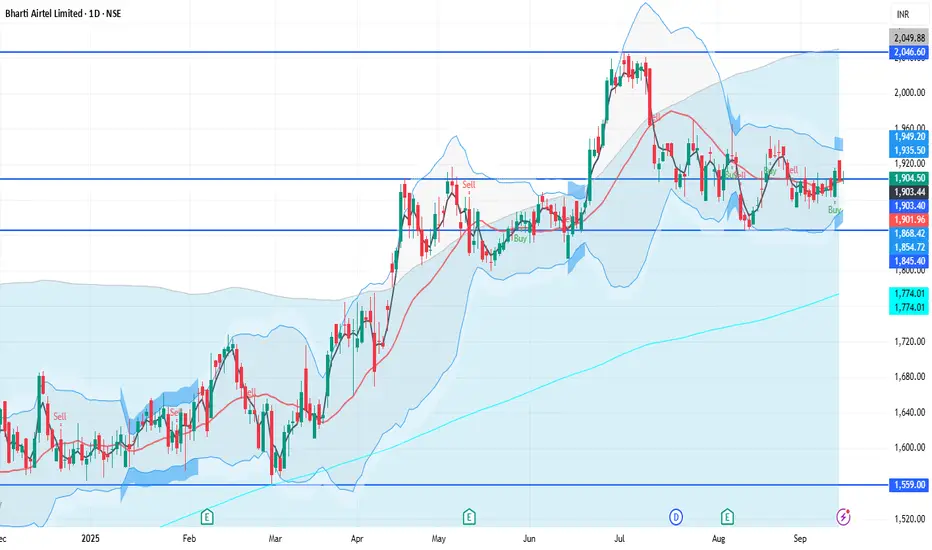
BHARTIARTL 1D Time frameUpdated Snapshot
Current Price: ₹1,903 – ₹1,906
Day’s Range: ₹1,901.60 – ₹1,925
Previous Close: ₹1,902.60
🔹 Support & Resistance
Support 1: ₹1,900 – ₹1,895
Support 2: ₹1,880 – ₹1,870
Resistance 1: ₹1,920 – ₹1,925
Resistance 2: ₹1,950 – ₹1,960
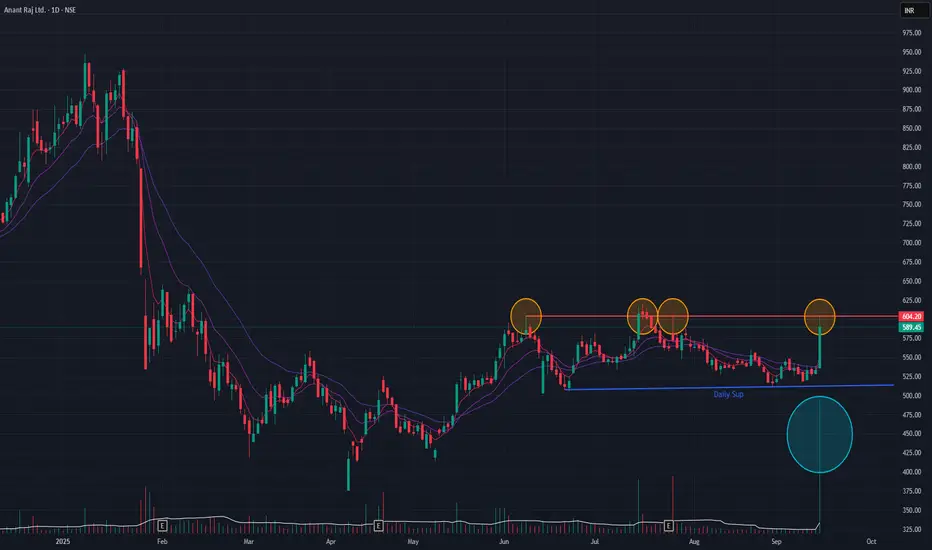
Anant Raj (Daily Timeframe) - Potential BreakOut candidate ??Following a downtrend that began in January 2025, Anant Raj has been in a sideways consolidation phase since May 2025. After several failed breakout attempts from this range, the stock demonstrated significant buying interest today, surging +10.53% on substantial volume.
While this move is positive, a cautious approach is recommended as the short-term Exponential Moving Averages (EMAs) have not yet registered a bullish positive crossover. The price action in the coming sessions will be critical for confirmation.
A sustained breakout above the consolidation channel could pave the way for further upside, with a potential short-term target of ₹667.
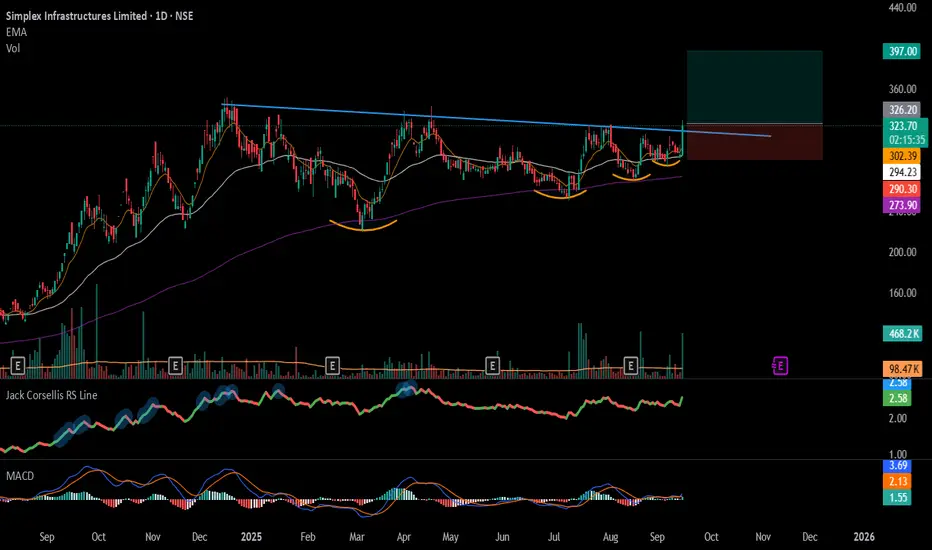
#SIMPLEXINF - TrendLine Breakout in Daily Time FrameScript: SIMPLEXINF
Key highlights: 💡⚡
📈 TrendLine Breakout in Daily Time Frame
📈 Volume spike during Breakout
📈 MACD Bounce
📈 Can go for a swing trade
BUY ONLY ABOVE 325 DCB
⏱️ C.M.P 📑💰- 322.25
🟢 Target 🎯🏆 – 22%
⚠️ Stoploss ☠️🚫 – 11%
⚠️ Important: Market conditions are Okish, Position size 50% per Trade. Protect Capital Always
⚠️ Important: Always Exit the trade before any Event.
⚠️ Important: Always maintain your Risk:Reward Ratio as 1:2, with this RR, you only need a 33% win rate to Breakeven.
✅Like and follow to never miss a new idea!✅
Disclaimer: I am not SEBI Registered Advisor. My posts are purely for training and educational purposes.
Eat🍜 Sleep😴 TradingView📈 Repeat 🔁
Happy learning with MMT. Cheers!🥂
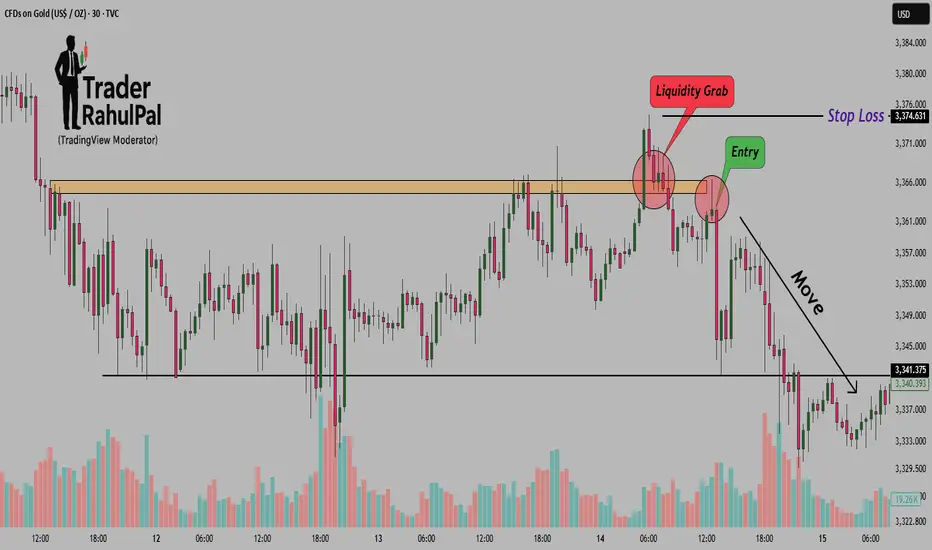
The Secret of Liquidity Grab – Why Price Hunts Highs Before FallHello Traders!
Have you ever noticed how the market first breaks a recent high, traps breakout traders, and then suddenly reverses? This is not random, it’s called a liquidity grab .
Understanding this concept can completely change how you see price action.
1. What is a Liquidity Grab?
Liquidity means orders in the market, stop losses, buy orders, sell orders.
When price hunts a previous high or low, it triggers stop losses and pending orders. This creates a sudden burst of liquidity.
Institutions use this liquidity to enter or exit large positions without causing slippage.
2. Why Price Hunts Highs Before Falling
At previous swing highs, many breakout traders place buy orders and short sellers place stop losses.
When the price spikes above that level:
Breakout traders enter long positions.
Short sellers’ stop losses get triggered (buy orders).
This creates a pool of buying liquidity. Once institutions have sold into this buying pressure, price often reverses sharply.
3. Why This Matters for Retail Traders
Most retail traders get trapped during these liquidity grabs.
They either chase breakouts too late or panic exit at the wrong time.
By recognizing this pattern, you can avoid being the liquidity and instead trade with the smart money.
4. How to Use This in Trading
Wait for the Grab: Don’t rush into a breakout. Wait to see if price quickly reverses after taking out a high/low.
Confirm With Volume: A liquidity grab often shows a sudden spike in volume followed by an opposite move.
Look for Rejection Candles: Pin bars, engulfing candles, or sharp wicks at highs/lows confirm the trap.
Rahul’s Tip:
Next time you see price breaking a high, don’t get excited. Ask yourself, is this a real breakout or just a liquidity grab? Waiting a little longer often saves you from being trapped.
Conclusion:
Liquidity grabs are the hidden traps of the market. Price doesn’t move randomly, it seeks liquidity first.
By understanding this, you can avoid becoming the victim and instead align yourself with the institutions.
If this post gave you clarity on liquidity grabs, like it, share your thoughts in the comments, and follow for more smart price action insights!
GOLD DAILY PLAN 15/09: SMC & Wyckoff Logic🔎 Market Overview
Market Structure (SMC): Price is currently moving inside a short-term descending channel but is showing signs of Wyckoff accumulation around the 3620–3635 zone (Liquidity BUY). This is a key support area.
Wyckoff: After a supply test, price is likely to consolidate and then push higher to sweep liquidity above (Liquidity SELL at 3688–3703).
Liquidity Zones
Liquidity BUY: 3595–3592 (major demand area)
Liquidity SELL: 3688–3703 (profit-taking & potential reversal zone)
📌 Key Levels
Resistance: 3668 – 3688 – 3703
Support: 3634 – 3629 – 3622 – 3617
🟢 BUY Plan (Primary Setup)
Entry: 3595–3592
Stop Loss (SL): 3587 (below Liquidity BUY)
Take Profit (TP) targets:
TP1: 3615
TP2: 3625
TP3: 3635
TP4: 3645
Open TP: 3685 (extended Wyckoff target)
🔴 SELL Plan (Counter-trade)
Entry: 3698–3701 (Liquidity SELL zone)
Stop Loss (SL): 3706 (just above breakout trap)
Take Profit (TP) targets:
TP1: 3690
TP2: 3680
TP3: 3670
TP4: 3660
Open TP: 3650
⚡ Scalping Strategy
Enter only on confirmation signals at Order Blocks (OB) or Liquidity Zones.
Prioritise BUY trades at support and SELL trades at resistance.
Apply strict risk management: risk no more than 1–2% per trade.
✅ Conclusion
Main directional bias for the day: BUY from 3595–3592, targeting the 3685–3700 region.
At Liquidity SELL 3688–3703, short-term SELL setups can be considered with targets back to 3660–3650.

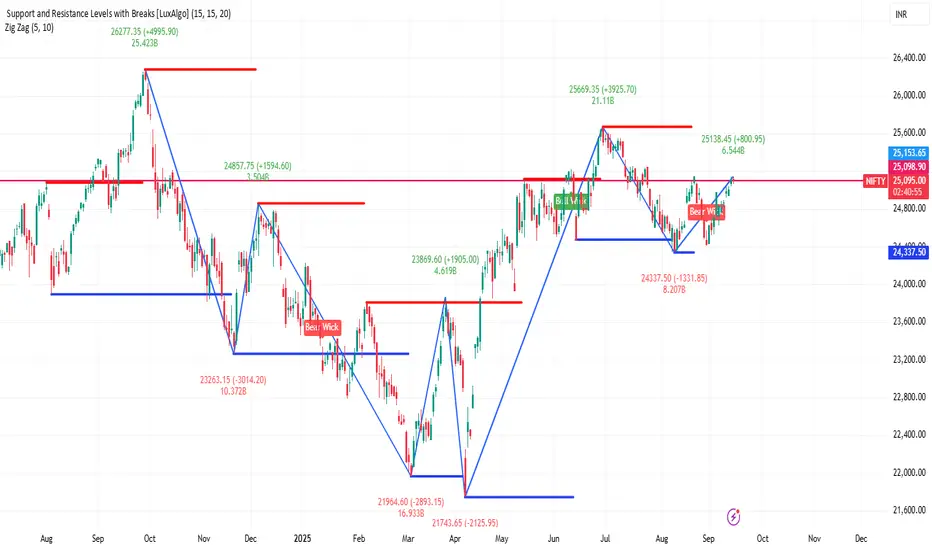
NIFTY 1D Time frameCurrent Price: ~25,085
Day’s Low: 24,900
Day’s High: 25,138
🔹 Support & Resistance (based on today’s range)
Support 1 (S1): 24,950 – 24,925
Support 2 (S2): 24,900 – 24,875
Resistance 1 (R1): 25,120 – 25,138
Resistance 2 (R2): 25,150 – 25,180
ANGELONE 1D Time frameCurrent Price: ₹2,238 – ₹2,240
Day’s Range: ₹2,212.60 – ₹2,274
Previous Close: ₹2,222.30
🔹 Support & Resistance
Support 1: ₹2,220 – ₹2,215
Support 2: ₹2,200 – ₹2,180
Resistance 1: ₹2,250 – ₹2,260
Resistance 2: ₹2,270 – ₹2,280

LT 1D Time frameCurrent Price
₹3,600.70
🔹 Market Snapshot
Day’s Range: ₹3,575.50 – ₹3,607.00
Previous Close: ₹3,579.80
52-Week Range: ₹2,965.30 – ₹3,963.50
Market Cap: ₹4.95 lakh crore
P/E Ratio (TTM): 31.91
P/B Ratio: 5.68
Dividend Yield: 0.94%
EPS (TTM): ₹112.82
Book Value per Share: ₹634.43

BRITANNIA INDUSTRIES LTD ( 1D ) 🔑 KEY LEVELS 🔑
✔ 6240 - 6300 Selling Zone.
✔ Trend Line Act As Resistance.
✔ RSI Also Overbought Zone.
🎯 TRADING PLAN 🎯
✔ Near the key levels , Bearish Harami
Candlestick Pattern has formed.
✔ The Entry Point is @ Below 6207.00
✔ The Stoploss Point is @ 6319.50
✔ The First Target is @ 5929
✔ The Second Target is @ 5777
💡 The goal of successful trader is to make
the best trades. Money is secondary.
Disclaimer : Educational & Informational
Purpose Only. Not a
Buy / Sell Recommendation.

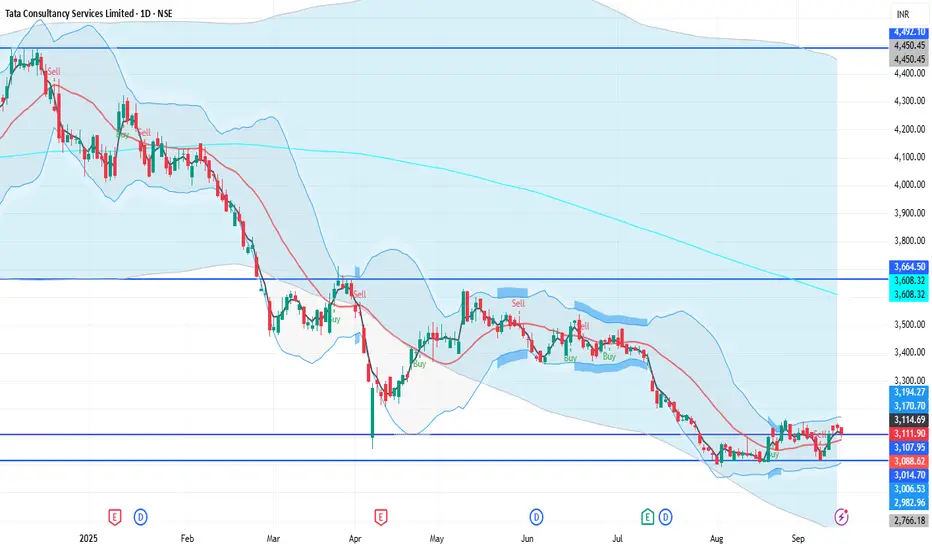
TCS 1D Time framePrice Action
Current Price: ₹3,111.60
Previous Close: ₹3,124.20
Day’s Range: ₹3,096 – ₹3,134
52-Week Range: ₹2,991.60 – ₹4,546.05
🔹 Support & Resistance
Support 1: ₹3,096
Support 2: ₹3,050 – ₹3,060
Resistance 1: ₹3,134
Resistance 2: ₹3,150 – ₹3,160
Trading Analysis for Gold Spot / U.S. Dollar (15-Minute Chart)Buy XAU/USD now at 3644.00 level and hold at 3631.00 and target will be specific.
Entry Range 3642.00 to 3644.00
Take Profit 1 = 3646.00
Take Profit 2 = 3650.00
Take Profit 3 = 3654.00
Take Profit 4 = 3658.00
Stock Loss 3631.00
Key News Timings Chart Per.
i will try to update continue.
